. 2013 Oct 4:3:2855.
doi: 10.1038/srep02855.

Personalized prediction of EGFR mutation-induced drug resistance in lung cancer

Affiliations

Personalized prediction of EGFR mutation-induced drug resistance in lung cancer

Debby D Wang et al. Sci Rep. .

Abstract

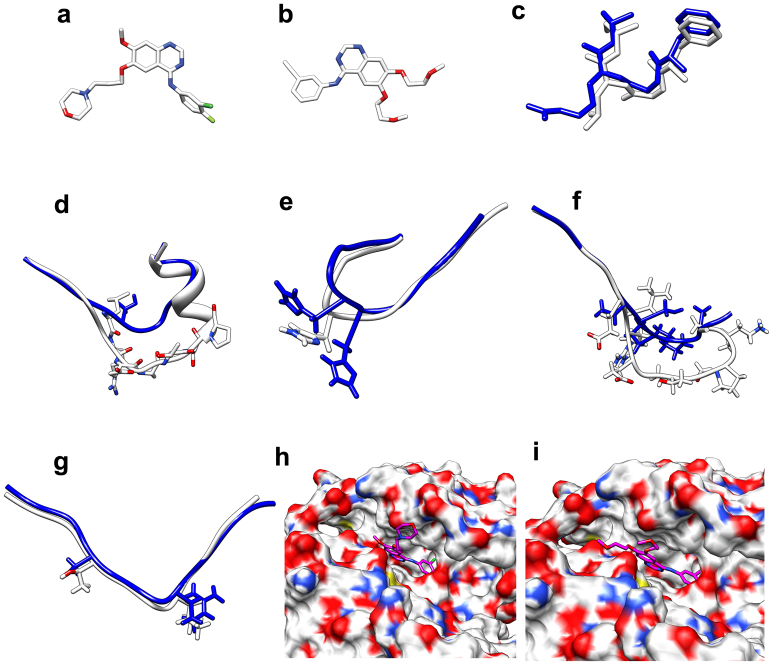
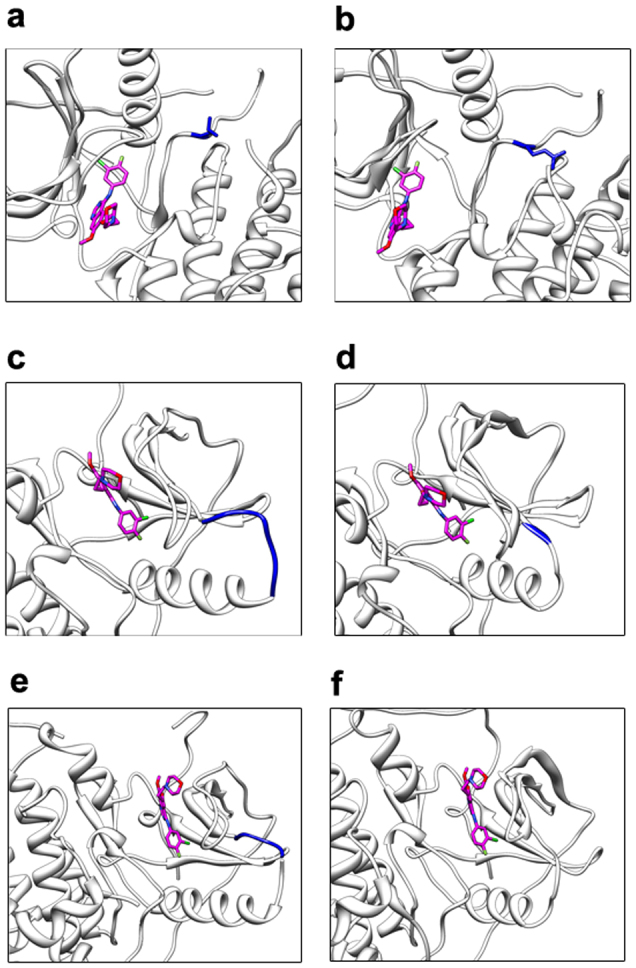
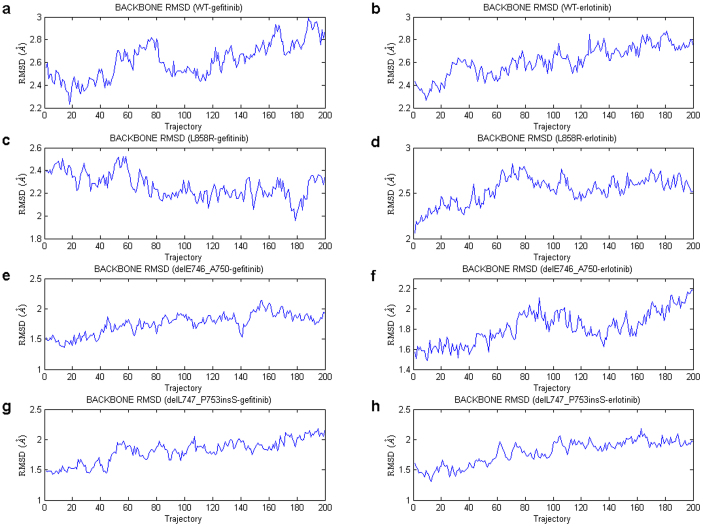
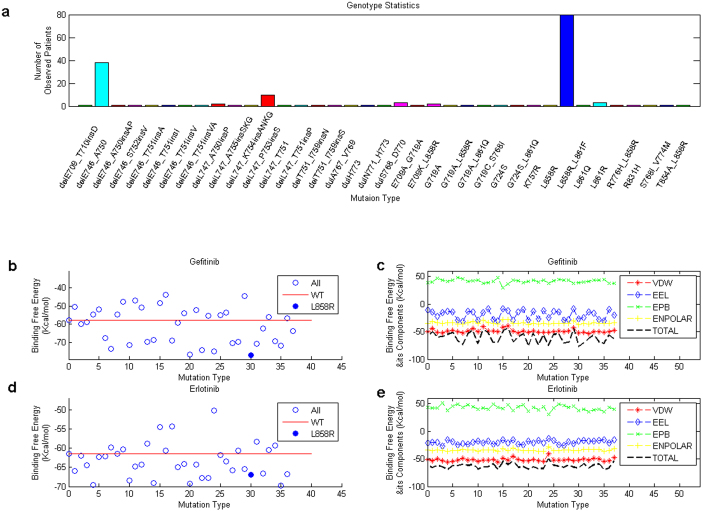
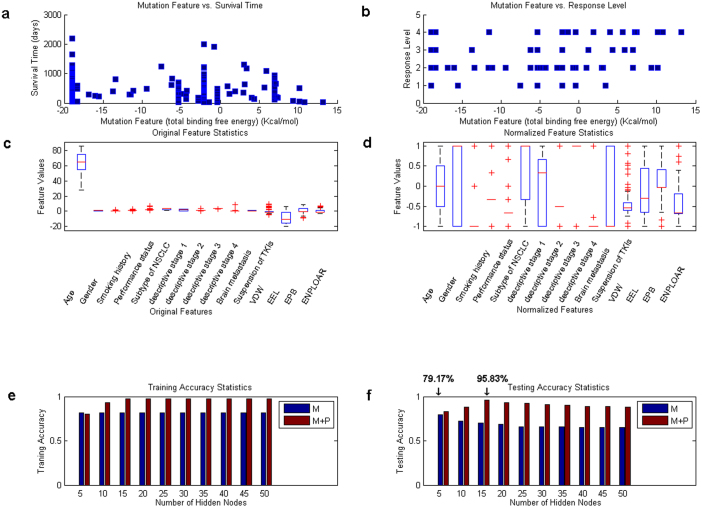
EGFR mutation-induced drug resistance has significantly impaired the potency of small molecule tyrosine kinase inhibitors in lung cancer treatment. Computational approaches can provide powerful and efficient techniques in the investigation of drug resistance. In our work, the EGFR mutation feature is characterized by the energy components of binding free energy (concerning the mutant-inhibitor complex), and we combine it with specific personal features for 168 clinical subjects to construct a personalized drug resistance prediction model. The 3D structure of an EGFR mutant is computationally predicted from its protein sequence, after which the dynamics of the bound mutant-inhibitor complex is simulated via AMBER and the binding free energy of the complex is calculated based on the dynamics. The utilization of extreme learning machines and leave-one-out cross-validation promises a successful identification of resistant subjects with high accuracy. Overall, our study demonstrates advantages in the development of personalized medicine/therapy design and innovative drug discovery.


Figures

Figure 1
Figure 1. 3D structures of inhibitors, computationally predicted mutants and complexes.
Parts (a) and (b) show the 3D structures of inhibitors gefitinib (IRESSA™) and erlotinib (TARCEVA®) respectively. In parts (c) to (g), we present a comparison between the mutation neighborhood of our computationally predicted mutant and the corresponding site of the WT EGFR kinase protein, for a specific mutation type. Each white chain corresponds to the WT structure, and each blue one is our modeling result. Accordingly, parts (c) to (g) show the mutation types L858R, delL747_P753insS, dulH773, delE746_A750, and T854A_L858R respectively. Parts (h) and (i) display the inhibitor-binding pocket of mutant delE746_A750 with inhibitors gefitinib and erlotinib respectively.
Figure 2
Figure 2. A comparison between the mutant-inhibitor complex and the WT-inhibitor complex structures for several major mutation types.
In each diagram, a portion of a WT/mutant-inhibitor complex is presented, with the inhibitor (gefitinib) colored pink and the original/mutation site colored blue. Diagrams (a) and (b) show a comparison between the WT-gefitinib system and the L858R-gefitinib system. Similarly, diagrams (c) ~ (d) and (e) ~ (f) show mutations delL747_P753insS and delE746_A750 respectively.
Figure 3
Figure 3. An investigation of the stabilization of several solvated mutant/WT-inhibitor systems.
Diagrams (a) and (b) show the plots for trajectory (frames) vs. backbone RMSD (Å) in the MD simulation period (2 ns), with regard to the solvated WT-gefitinib and WT-erlotinib systems respectively. Similarly, diagrams (c) ~ (d), (e) ~ (f) and (g) ~ (h) present the plots for the systems involving L858R, delE746_A750 and delL747_P753insS respectively.
Figure 4
Figure 4. Statistics on mutation types and their binding free energies with the two inhibitors.
Part (a) shows the statistics of the 37 mutation types of our observed 168 patients. Parts (b) and (d) present the distributions of total binding free energies of the mutants (with WT protein included) with two inhibitors gefitinib and erlotinib. The red lines and solid blue circles show the binding free energy for the WT EGFR and the L858R mutant respectively. Parts (c) and (e) display the distributions of the binding free energy components, which encompass VDW, EEL, EPB and ENPOLAR, for the two inhibitors.
Figure 5
Figure 5. Statistics on features and classification results of the clinical subjects.
Part (a) shows the distribution of mutation feature (total binding free energy) vs. survival time for the 168 clinical subjects, with each point representing one subject. Similarly, the plot of mutation feature vs. response level is displayed in part (b). The distributions of the adopted features (personal + mutation) for the 168 subjects are shown in parts (c) and (d), with part (c) showing the original distribution while part (d) the normalized values. Part (e) provides a comparison between the training accuracies reported in the case involving the mutation feature only (blue, denoted as ‘M') and the case involving both mutation feature and personal features (brown, denoted as ‘M + P'). Part (f) shows a comparison between the testing accuracies (blue for the first case, and brown for the second).

References

    1. Lynch T. J. et al. Activating mutations in the epidermal growth factor receptor underlying responsiveness of non-small-cell lung cancer to gefitinib. N Engl J Med 350, 2129–2139 (2004). - PubMed
    1. Yun C. H. et al. The T790M mutation in EGFR kinase causes drug resistance by increasing the affinity for ATP. Proc Natl Acad Sci U S A 105, 2070–2075 (2008). - PMC - PubMed
    1. Zhang Z. F. et al. Activation of the AXL kinase causes resistance to EGFR-targeted therapy in lung cancer. Nat Genet 44, 852–60 (2012). - PMC - PubMed
    1. Hou T. J., Zhang W., Wang J. & Wang W. Predicting drug resistance of the HIV-1 protease using molecular interaction energy components. Proteins 74, 837–846 (2009). - PMC - PubMed
    1. Kobayashi S. et al. EGFR mutation and resistance of non-small-cell lung cancer to gefitinib. New Engl J Med 352, 786–792 (2005). - PubMed

Publication types

MeSH terms