. 2013 Oct 4;342(6154):1235587.
doi: 10.1126/science.1235587.

Integrative annotation of variants from 1092 humans: application to cancer genomics

Collaborators, Affiliations

Integrative annotation of variants from 1092 humans: application to cancer genomics

Ekta Khurana et al. Science. .

Abstract

Interpreting variants, especially noncoding ones, in the increasing number of personal genomes is challenging. We used patterns of polymorphisms in functionally annotated regions in 1092 humans to identify deleterious variants; then we experimentally validated candidates. We analyzed both coding and noncoding regions, with the former corroborating the latter. We found regions particularly sensitive to mutations ("ultrasensitive") and variants that are disruptive because of mechanistic effects on transcription-factor binding (that is, "motif-breakers"). We also found variants in regions with higher network centrality tend to be deleterious. Insertions and deletions followed a similar pattern to single-nucleotide variants, with some notable exceptions (e.g., certain deletions and enhancers). On the basis of these patterns, we developed a computational tool (FunSeq), whose application to ~90 cancer genomes reveals nearly a hundred candidate noncoding drivers.


Figures

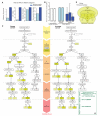
Fig. 1
Fig. 1. Fraction of rare (DAF < 0.5%) SNPs
(A) In various gene categories. Total number of SNPs in each category shown. (B) In noncoding DHSs and coding genes, which show tissue-specific behavior. Matching tissues for which both DHS and gene expression data are available shown in same colors: shades of green for endodermal, gray for mesodermal, and blue for ectodermal origin of tissues. Red dotted lines show the total fraction for all DHSs and coding genes. Asterisks show significant depletion or enrichment after multiple-hypothesis correction. Error bars in both (A) and (B) denote 95% binomial confidence intervals.
Fig. 2
Fig. 2. Fraction of rare SNPs in noncoding categories
Red dotted lines represent genomic average. Error bars denote 95% binomial confidence intervals. Total numbers of SNPs in each category shown. (A) Broad categories. Ultrasensitive and sensitive regions are those under very strong negative selection. TFSS, sequence-specific TFs. Categories tested for enrichment of HighD sites (Fig. 5A) marked by using hollow triangles on the left. (B) Example of high-resolution categories: TFBS motifs separated into 15 families. e superscripts in red denote enrichment of eQTLs in TFBSs of specific families. (C) Examples of TFBSs included in ultrasensitive category. (D) SNPs breaking TF motifs show an excess of rare alleles compared with those conserving them. Representative motifs for two families are shown. (E) Enrichment of HGMD regulatory disease-causing mutations in ultrasensitive, sensitive, and annotated regions compared with all noncoding regions. (F) SNPs not exhibiting allele-specific behavior (−) are enriched in rare alleles compared with SNPs exhibiting allele-specific behavior (+).
Fig. 3
Fig. 3. SNPs in protein-protein interaction (PPI) network
(A) Degree centrality of coding-gene categories in PPI network. (B) Fraction of rare missense SNPs at protein-interaction interfaces is higher than all rare missense SNPs (error bars show 95% binomial confidence intervals; total number of SNPs also shown). (C) Effects of SNVs at interaction interfaces on interactions of WASP with other proteins tested by Y2H experiments. Wild-type (WT) WASP interacts with all proteins shown, whereas each missense SNV disrupts its interaction with at least one protein.
Fig. 4
Fig. 4. Functional annotations of indels and SVs
(A) Fraction of rare indels in coding-gene categories. Total number of indels shown. (B) Enrichment of SVs affecting functional annotations. Middle box shows genes, pseudogenes, and TF motifs; upper blow-out shows gene parts in different modes, and bottom blow-out shows enhancers with different formation mechanisms, i.e., NAHR, NH (nonhomologous), TEI (transposable element insertion), and VNTR (variable number of tandem repeats). Asterisks indicate significant enrichment (green) or depletion (red) after multiple hypothesis correction. SVs intersecting various functional categories in different modes (e.g., whole/partial) are shown in the right-hand schematics. (C) Aggregation of histone signal around breakpoints of deletions formed by different mechanisms. Breakpoints centered at zero. Aggregation for upstream and downstream regions corresponds to negative and positive distance, respectively. Signals for an activating histone mark (H3K4me1) and a repressive mark (H3K27me3) are shown.
Fig. 5
Fig. 5. Functional implications of positive selection
(A) (Left) Frequency of HighD SNPs versus matched sites for broad categories (marked by hollow triangles in Fig. 2A). (Right) Specific categories, e.g., specific TF families. Asterisk denotes significant enrichment after multiple-hypothesis correction. e superscripts in red denote the enrichment of eQTLs. (B) (Left) The in-degree of genes with HighD missense SNPs is lower than that of all genes. (Center) The in-degree of genes with HighD SNPs in their promoters is higher than all genes. (Right) The human regulatory network with edges in gray. Red nodes represent genes with HighD SNPs in their promoters, and blue nodes represent genes with HighD missense SNPs. Size of nodes scaled based on their degree centrality. Nodes with higher centrality are bigger and tend to be in the center, whereas those with lower centrality are smaller and tend to be on the periphery.
Fig. 6
Fig. 6. Functional interpretation of disease variants
(A) Enrichment of functionally deleterious mutations among somatic compared with germline SNVs. Mean values from seven prostate cancer samples shown (variation shown in fig. S16). (B) Ratios for the number of SNVs that conserve versus break TF-binding motifs depicted for NA12878, the average of 1000 Genomes Phase I samples,and the average of somatic and germline samples from different cancers. Error bars represent 1 SD. MB, medulloblastoma. (C) Filtering of somatic variants from a breast (PD4006, left) and a prostate (PR-2832, right) cancer sample leading to identification of candidate drivers. (D) A part of the FAM48A binding site sequenced by Sanger sequencing in an independent cohort of 19 prostate cancer samples shown in green (with the coordinates of mutations observed in one sample). (E) Application of variants filtering scheme to Venter personal genome. Number of SNVs in various categories shown.

References

    1. Yngvadottir B, Macarthur DG, Jin H, Tyler-Smith C. The promise and reality of personal genomics. Genome Biol. 2009;10:237. doi: 10.1186/gb-2009-10-9-237. pmid: 19723346. - PMC - PubMed
    1. Dunham I, et al. An integrated encyclopedia of DNA elements in the human genome. Nature. 2012;489:57–74. doi: 10.1038/nature11247; pmid: 22955616. - PMC - PubMed
    1. Maurano MT, et al. Systematic localization of common disease-associated variation in regulatory DNA. Science. 2012;337:1190–1195. 10.1126/science.1222794. doi: 10.1126/science.1222794; pmid: 22955828. - PMC - PubMed
    1. Ward LD, Kellis M. Interpreting noncoding genetic variation in complex traits and human disease. Nat. Biotechnol. 2012;30:1095–1106. doi: 10.1038/nbt.2422; pmid: 23138309. - PMC - PubMed
    1. Visel A, et al. Targeted deletion of the 9p21 non-coding coronary artery disease risk interval in mice. Nature. 2010;464:409–412. doi: 10.1038/nature08801; pmid: 20173736. - PMC - PubMed

Publication types

Substances