

BH3 profiling discriminates response to cytarabine-based treatment of acute myelogenous leukemia
- PMID: 24092807
- PMCID: PMC3881173
- DOI: 10.1158/1535-7163.MCT-13-0692
BH3 profiling discriminates response to cytarabine-based treatment of acute myelogenous leukemia
Abstract
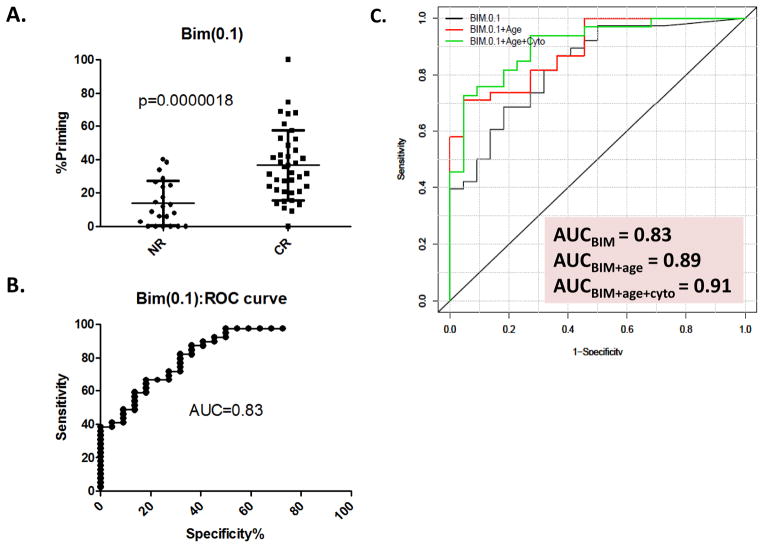
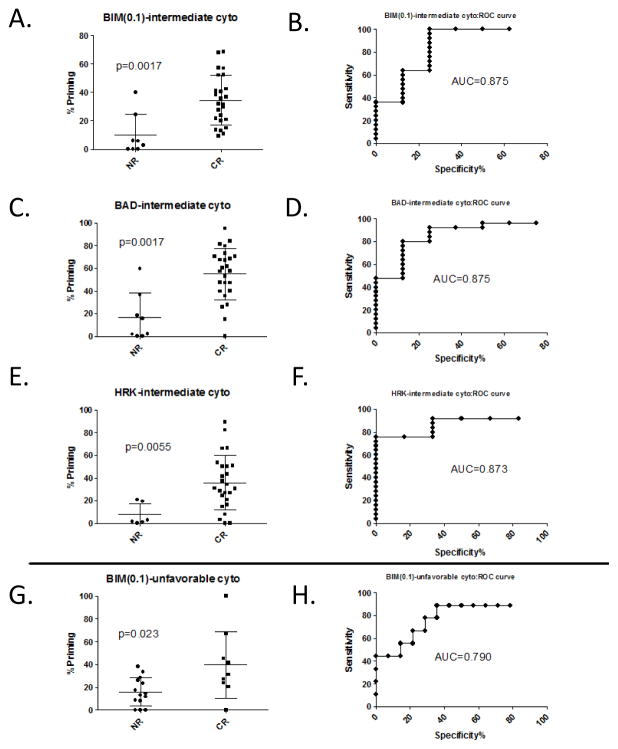
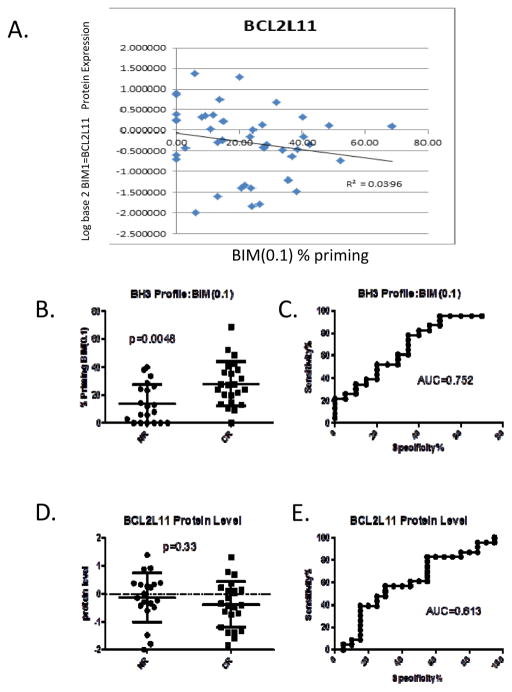
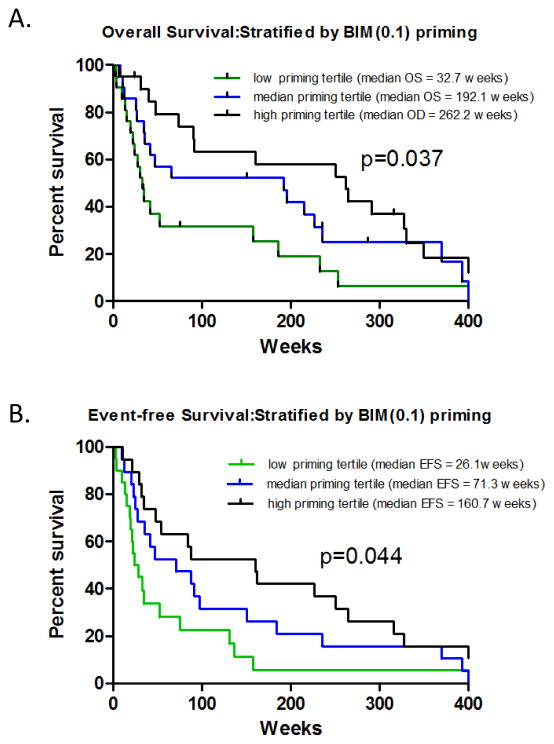
As acute myelogenous leukemia (AML) patient response to cytarabine-based standard-of-care treatment is variable, stratification into subgroups by biomarker-predicted response may lead to improved clinical outcomes. Here, we assess cell mitochondrial depolarization to proapoptotic signaling BH3-only peptides as a surrogate for the function of Bcl-2 family proteins to address clinical response to cytarabine-based therapy in patients with AML (N = 62). Peripheral blood mononuclear cell (PBMC) or bone marrow aspirate specimens were obtained from newly diagnosed patients with AML, viably preserved, and assayed by flow cytometry following BH3 profile assay with individual BH3 peptides. Mann-Whitney analysis indicates biomarker correlation with response to induction therapy: Notably, BIM priming was highly significant (P = 2 × 10(-6)) with a compelling sensitivity/specificity profile [area under curve (AUC) = 0.83; 95% confidence interval (CI), 0.73-0.94; P = 2 × 10(-10)]. Multivariate analysis indicates improved profiles for BIM readout + patient age (AUC = 0.89; 95% CI, 0.81-0.97) and BIM + patient age + cytogenetic status (AUC = 0.91; 95% CI, 0.83-0.98). When patients were stratified by cytogenetic status, BIM readout was significant for both intermediate (P = 0.0017; AUC = 0.88; 95% CI, 0.71-1.04) and unfavorable (P = 0.023; AUC = 0.79; 95% CI, 0.58-1.00) risk groups, demonstrating predictive power independent of cytogenetics. Additional analyses of secondary clinical endpoints displayed correlation between overall survival (P = 0.037) and event-free survival (P = 0.044) when patients were stratified into tertiles by BIM peptide response. Taken together, these results highlight the potential utility of BH3 profiling in personalized diagnostics of AML by offering actionable information for patient management decisions.
©2013 AACR.
Conflict of interest statement
William Pierceall, Nicole Carlson, Ryan Lena, Noel Blake, Michael Elashoff, and Michael Cardone are employees of Eutropics, Inc. The remaining authors declare no conflicts-of-interest.
Figures
References
-
- NCI cancer statistics. ( www.cancer.gov/cancertopics/types/leukemia)
-
- American Cancer Society. Cancer Facts and Figures 2013. Atlanta, Ga: American Cancer Society; 2013. [Last accessed May 2, 2013]. Available online.
-
- Bishop JF. The treatment of adult acute myeloid leukemia. Semin Oncol. 1997;24:57–69. - PubMed
-
- Grimwade D, Walker H, Harrison G, Oliver F, Chatters S, Harrison CJ, et al. The predictive value of hierarchical cytogenetic classification in older adults with acute myeloid leukemia (AML): analysis of 1065 patients entered into the United Kingdom Medical Research Council AML11 trial. Blood. 2001;98:1312–20. - PubMed
-
- Baldus CD, Mrózek K, Marcucci G, Bloomfield CD. Clinical outcome of de novo acute myeloid leukaemia patients with normal cytogenetics is affected by molecular genetic alterations: a concise review. Br J Haematol. 2007;137:387–400. - PubMed
Publication types
MeSH terms
Substances
Grants and funding
LinkOut - more resources
Full Text Sources
Other Literature Sources
Medical
Research Materials
