. 2013 Sep 23:12:193-201.
doi: 10.4137/CIN.S12862. eCollection 2013.

Monitoring of technical variation in quantitative high-throughput datasets

Affiliations

Monitoring of technical variation in quantitative high-throughput datasets

Martin Lauss et al. Cancer Inform. .

Abstract

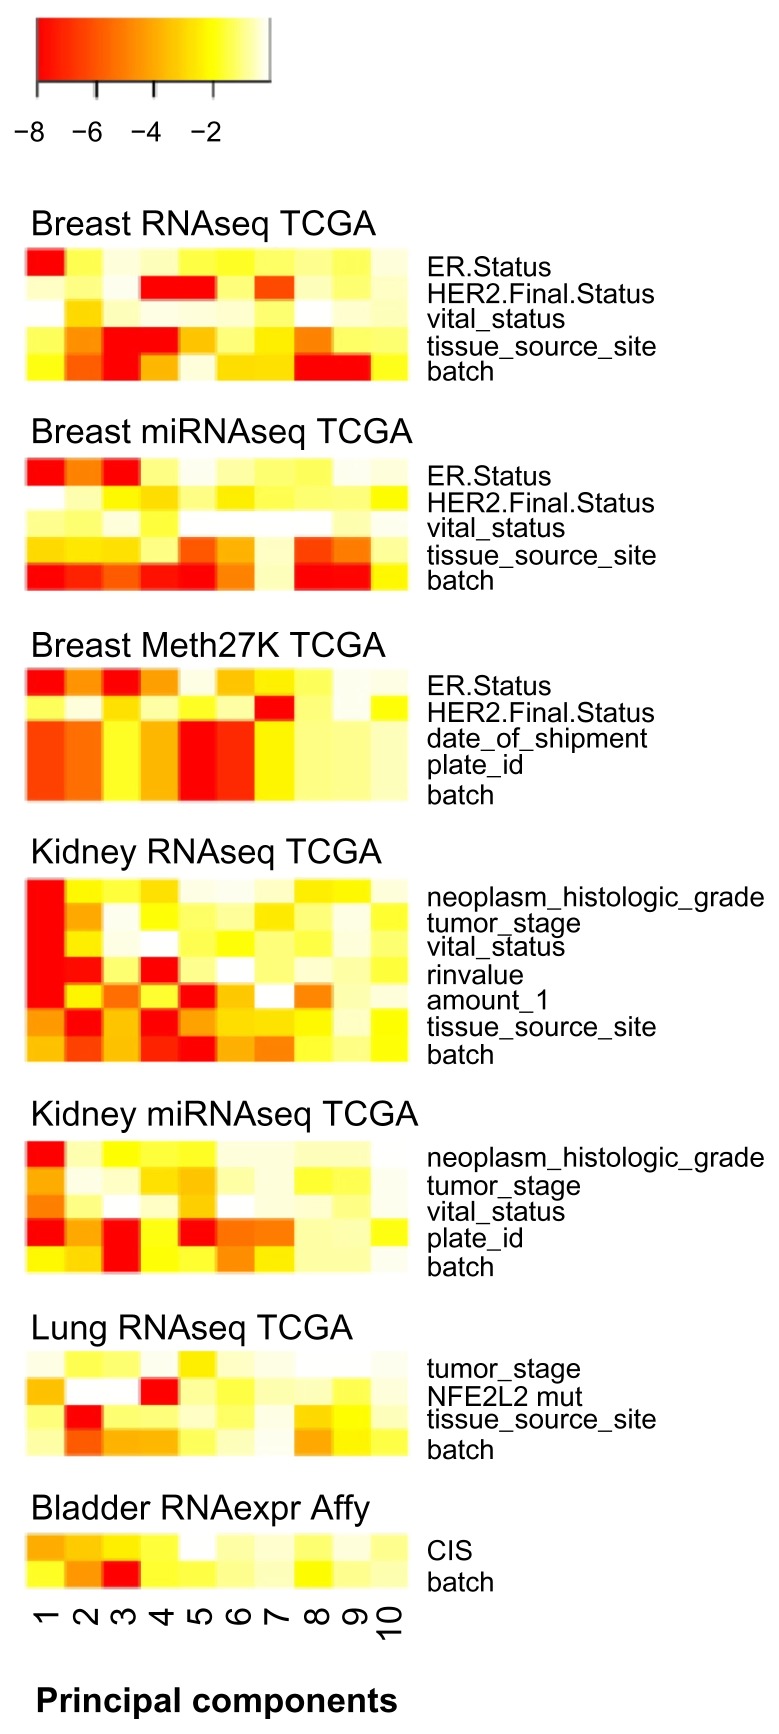
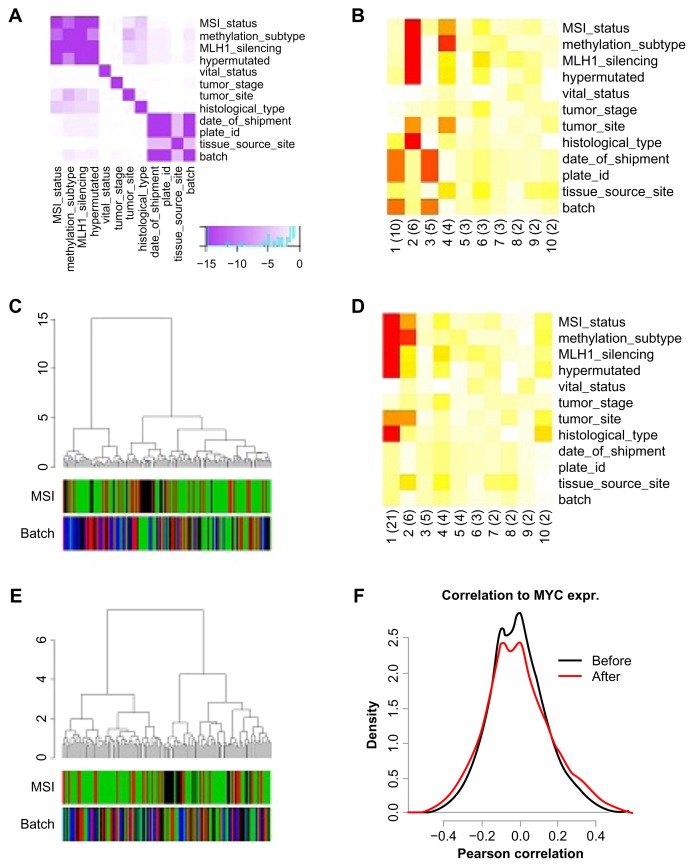
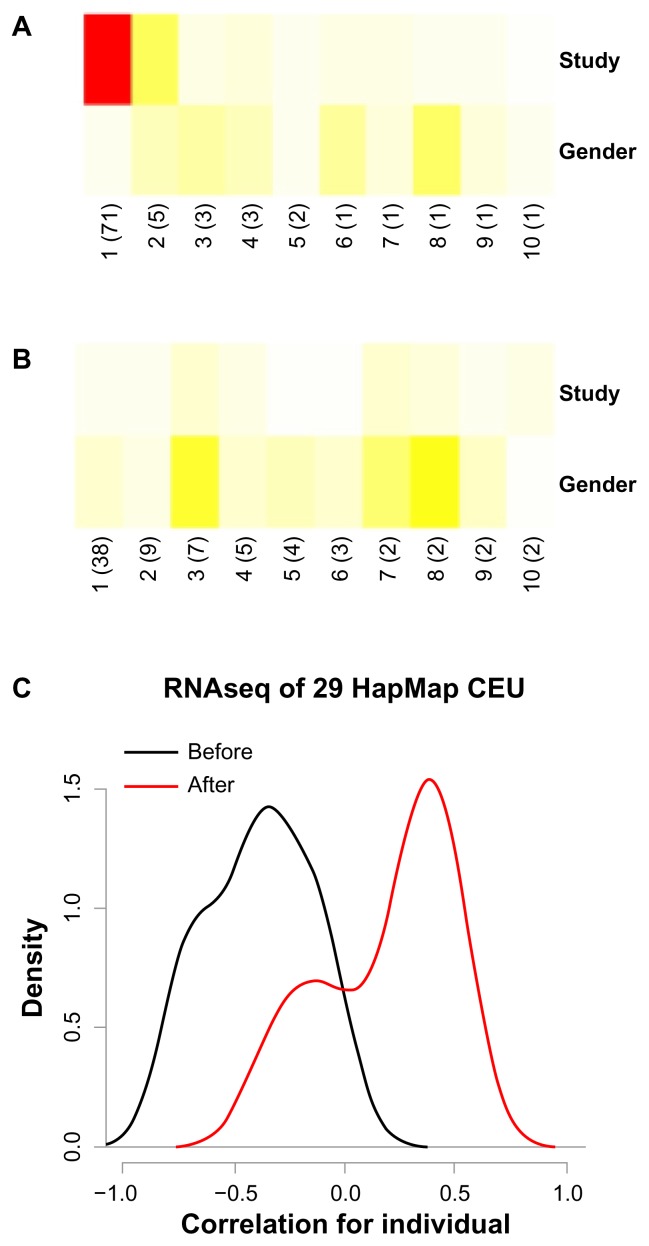
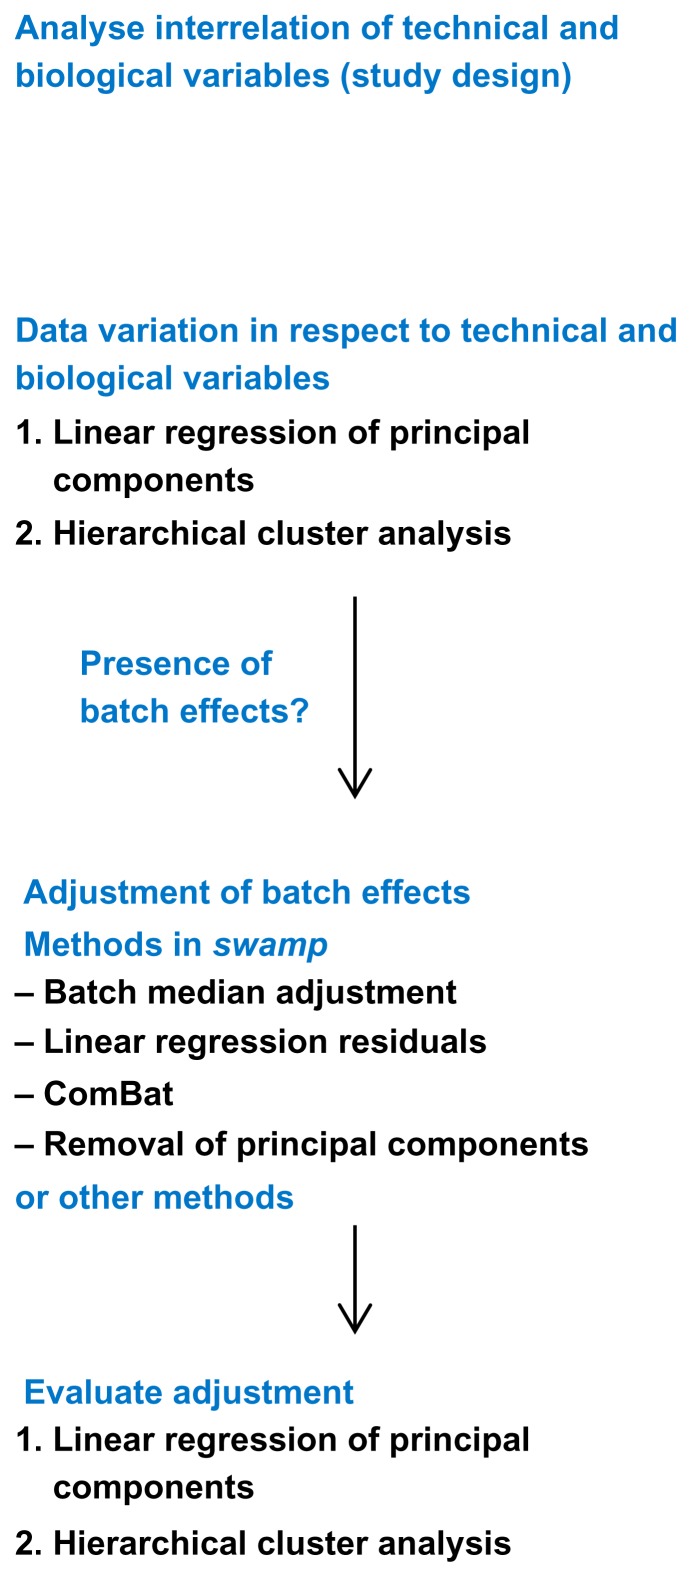
High-dimensional datasets can be confounded by variation from technical sources, such as batches. Undetected batch effects can have severe consequences for the validity of a study's conclusion(s). We evaluate high-throughput RNAseq and miRNAseq as well as DNA methylation and gene expression microarray datasets, mainly from the Cancer Genome Atlas (TCGA) project, in respect to technical and biological annotations. We observe technical bias in these datasets and discuss corrective interventions. We then suggest a general procedure to control study design, detect technical bias using linear regression of principal components, correct for batch effects, and re-evaluate principal components. This procedure is implemented in the R package swamp, and as graphical user interface software. In conclusion, high-throughput platforms that generate continuous measurements are sensitive to various forms of technical bias. For such data, monitoring of technical variation is an important analysis step.

Keywords: RNAseq; batch effect; bias; data adjustment; high-throughput analysis; sample annotation.


Figures

Figure 1
Figure 1
Technical and biological variation in cancer high-throughput data. Notes: The prince plots show the log10P-values from univariate linear regression of the top 10 principal components with sample annotations as regressors. The P-values are color-coded from red (P < 10−8) to white (P = 1). Sample annotations are named as in the TCGA biotab files or patient information tables of the respective TCGA portal publications. Abbreviations: TCGA, The Cancer Genome Atlas; CIS, carcinoma in situ.
Figure 2
Figure 2
Adjustment of the RNAseq data from the TCGA colorectal cancer project. Notes: The 4 largest batches of the colon cancer data are analyzed before and after data correction. (A) Confounding plot shows the association of sample annotations with P-values color-coded from purple (P < 10−8) to white (P = 1). (B) Prince plot before correction. Legend as in Figure 1, and percentage of variation for each principal component in brackets. (C) Hierarchical cluster analysis (HCA) using correlation as distance and ward algorithm as linkage method. MSI, microsatellite instability: green, stable microsatellites; red, MSI-low; black, MSI-high. (D) Prince plot after removal of principal components 1 and 3. (E) HCA after correction. (F) Correlation of the expression of all genes on the platform to MYC expression before (black) and after (green) correction.
Figure 3
Figure 3
Merging of two HapMap RNAseq datasets. Notes: RNAseq data of 29 HapMap cell lines from two independent studies. (A) Prince plot before study correction and (B) after correction. (C) Density plot of correlations of HapMap cell line pairs before (black) and after (red) study correction.
Figure 4
Figure 4
Framework to monitor technical variation.

References

    1. Lazar C, Meganck S, Taminau J, et al. Batch effect removal methods for microarray gene expression data integration: a survey. Brief Bioinformatics. 2013;14(4):469–90. - PubMed
    1. Leek JT, Scharpf RB, Bravo HC, et al. Tackling the widespread and critical impact of batch effects in high-throughput data. Nat Rev Genet. 2010;11(10):733–9. - PMC - PubMed
    1. Teschendorff AE, Menon U, Gentry-Maharaj A, et al. An epigenetic signature in peripheral blood predicts active ovarian cancer. PLoS ONE. 2009;4(12):e8274. - PMC - PubMed
    1. Scharpf RB, Ruczinski I, Carvalho B, Doan B, Chakravarti A, Irizarry RA. A multilevel model to address batch effects in copy number estimation using SNP arrays. Biostatistics. 2011;12(1):33–50. - PMC - PubMed
    1. Taminau J, Meganck S, Lazar C, et al. Unlocking the potential of publicly available microarray data using inSilicoDb and inSilicoMerging R/Bioconductor packages. BMC Bioinformatics. 2012;13:335. - PMC - PubMed

LinkOut - more resources