. 2013 Sep 25:7:599.
doi: 10.3389/fnhum.2013.00599. eCollection 2013.

Multisite functional connectivity MRI classification of autism: ABIDE results

Affiliations

Multisite functional connectivity MRI classification of autism: ABIDE results

Jared A Nielsen et al. Front Hum Neurosci. .

Abstract

Background: Systematic differences in functional connectivity MRI metrics have been consistently observed in autism, with predominantly decreased cortico-cortical connectivity. Previous attempts at single subject classification in high-functioning autism using whole brain point-to-point functional connectivity have yielded about 80% accurate classification of autism vs. control subjects across a wide age range. We attempted to replicate the method and results using the Autism Brain Imaging Data Exchange (ABIDE) including resting state fMRI data obtained from 964 subjects and 16 separate international sites.

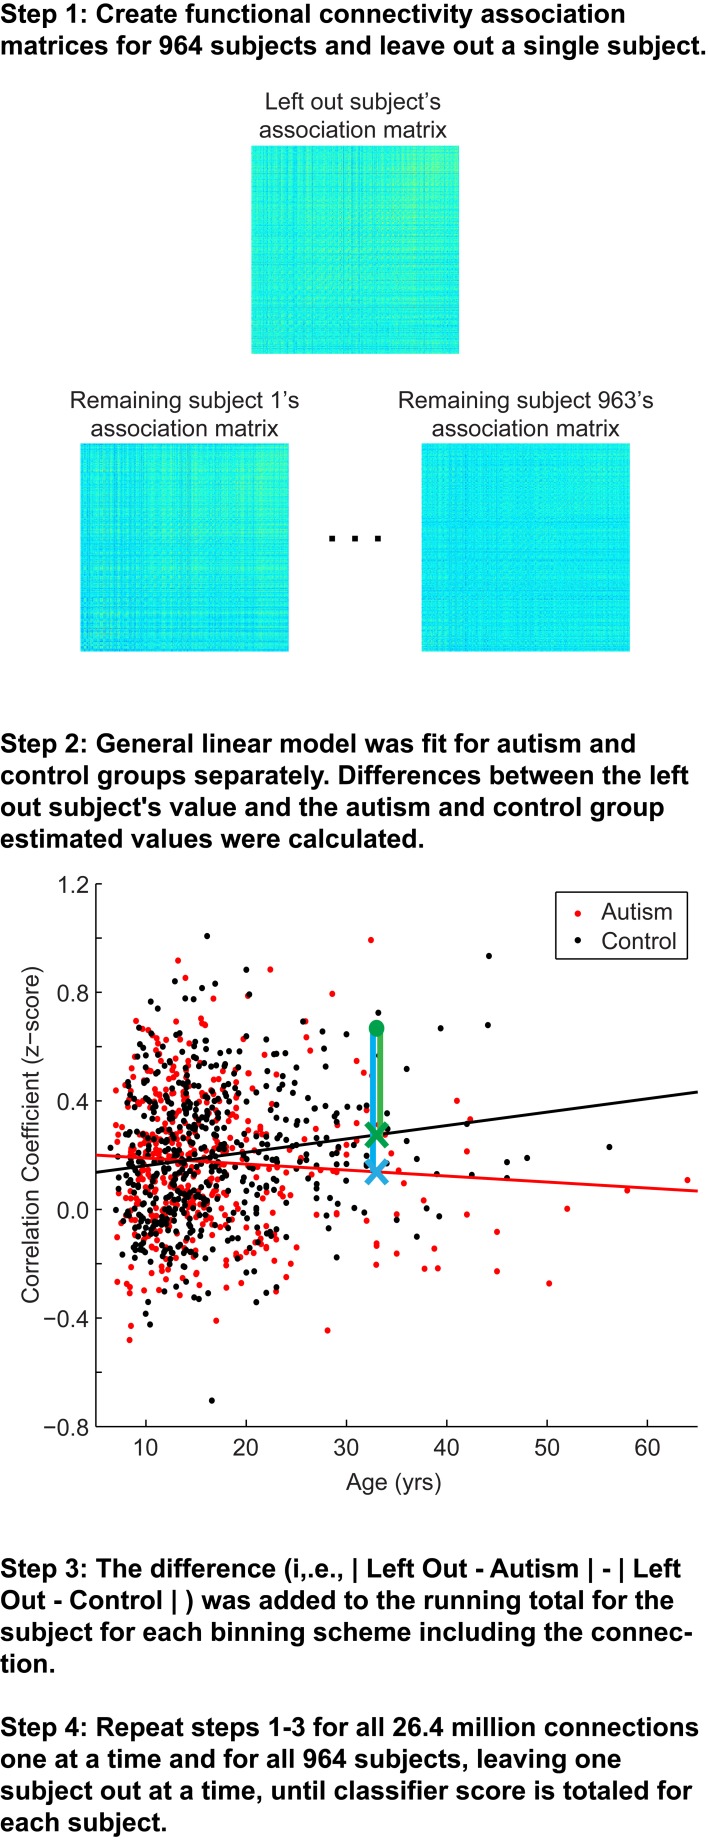
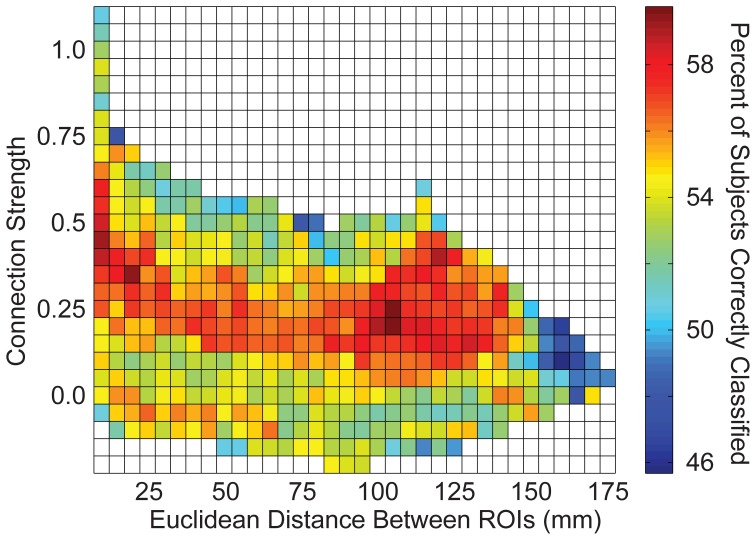
Methods: For each of 964 subjects, we obtained pairwise functional connectivity measurements from a lattice of 7266 regions of interest covering the gray matter (26.4 million "connections") after preprocessing that included motion and slice timing correction, coregistration to an anatomic image, normalization to standard space, and voxelwise removal by regression of motion parameters, soft tissue, CSF, and white matter signals. Connections were grouped into multiple bins, and a leave-one-out classifier was evaluated on connections comprising each set of bins. Age, age-squared, gender, handedness, and site were included as covariates for the classifier.

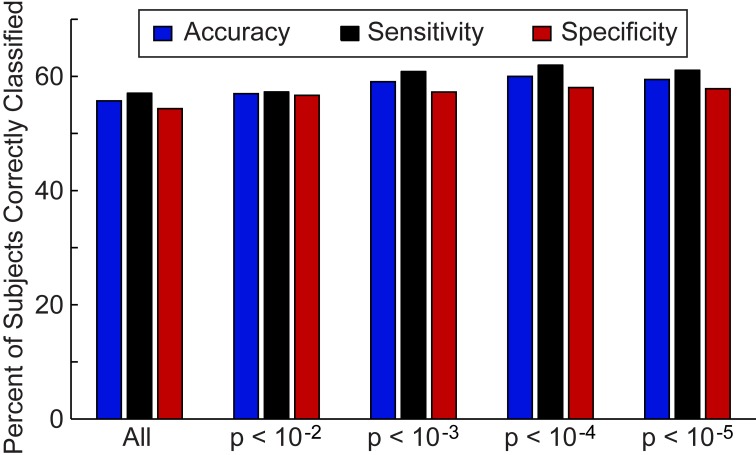
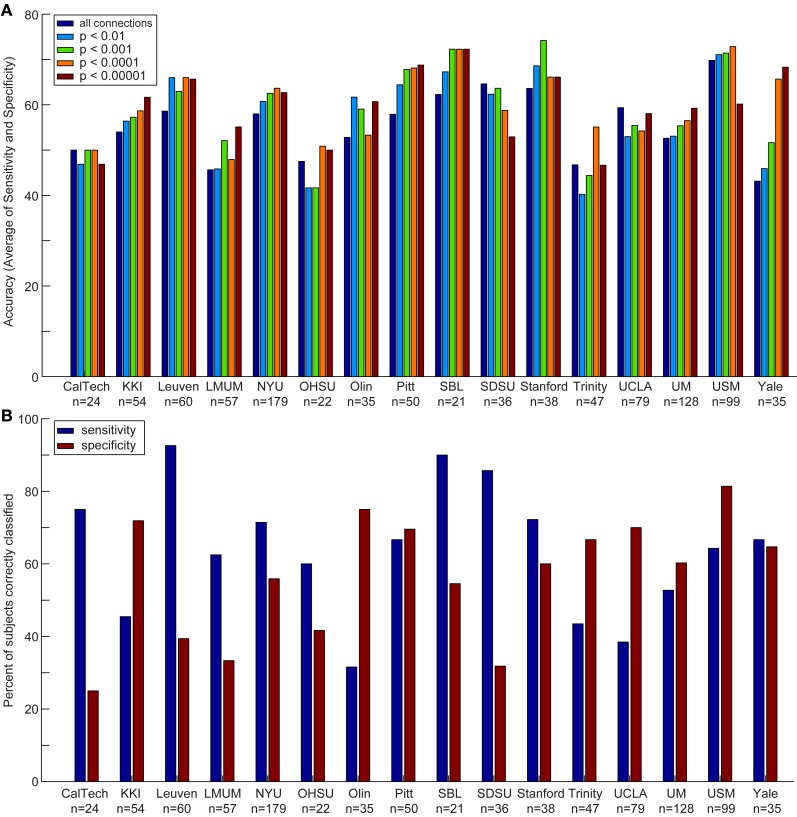
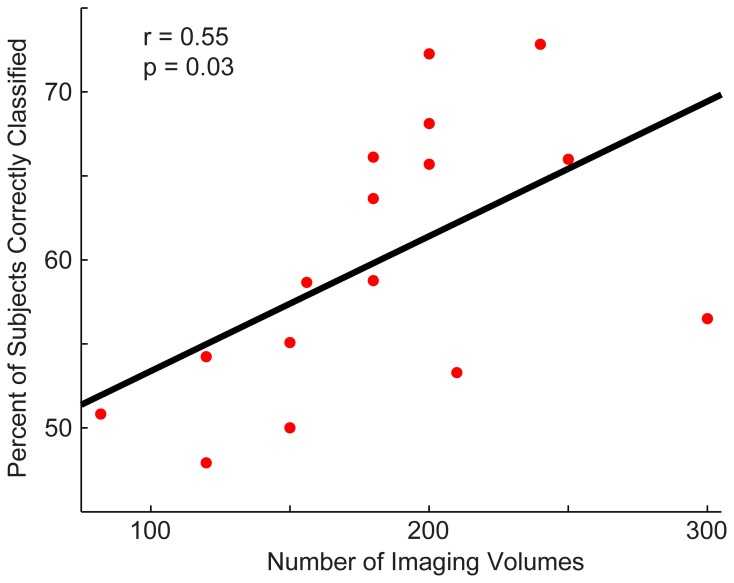
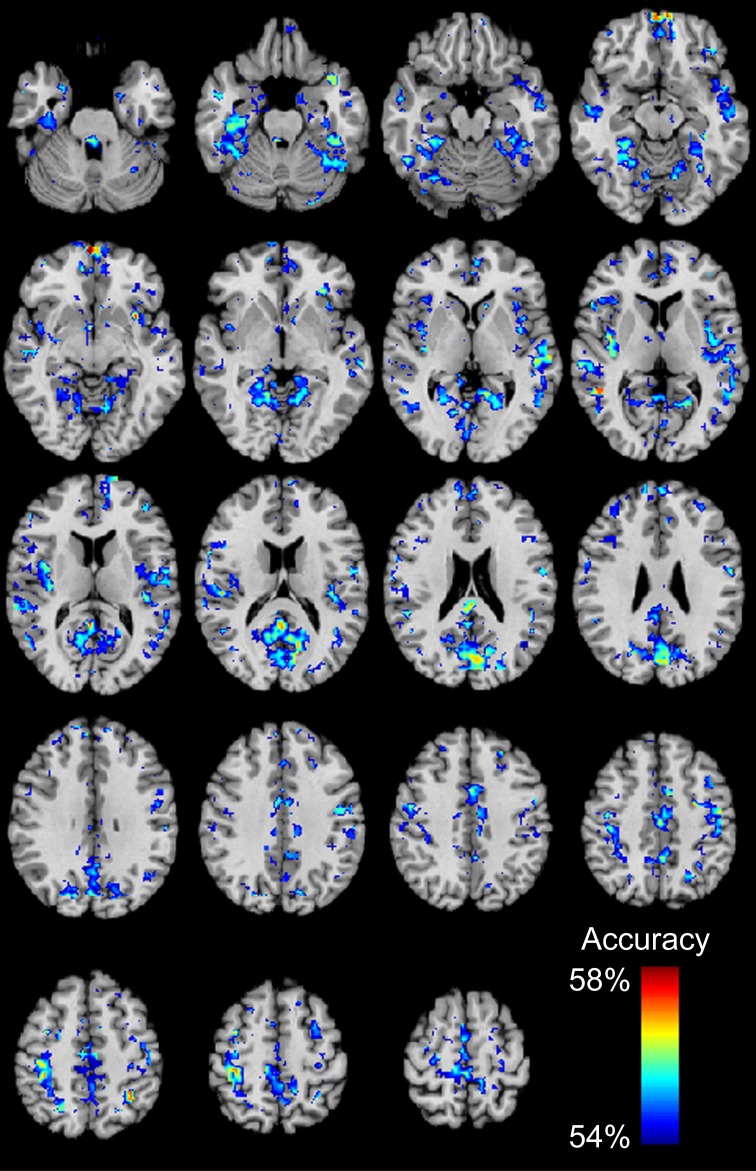
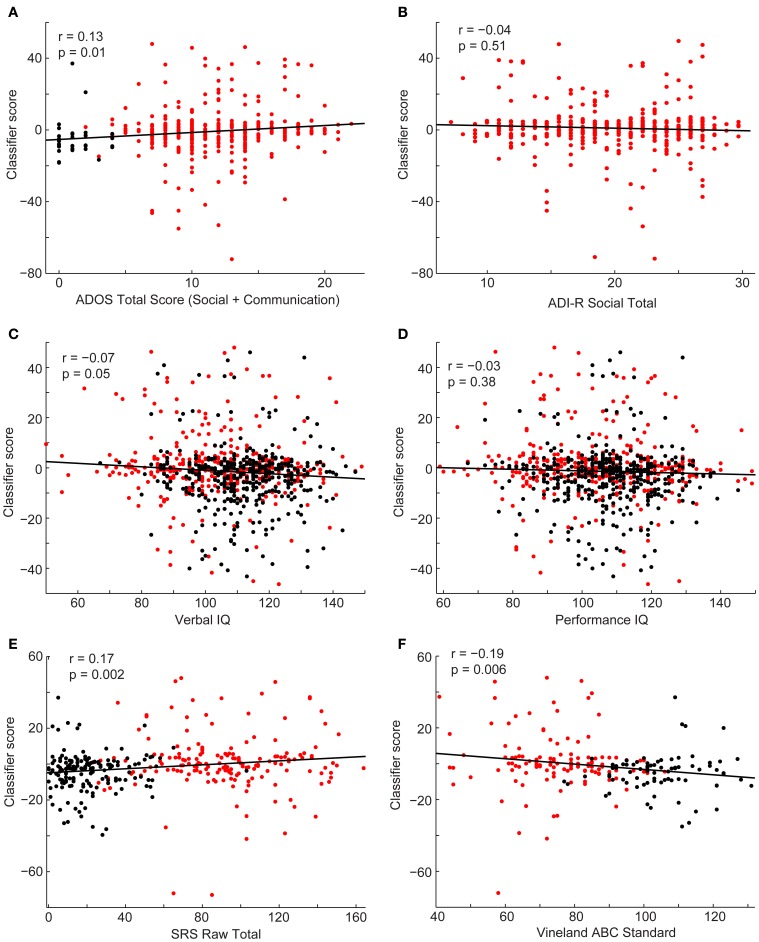
Results: Classification accuracy significantly outperformed chance but was much lower for multisite prediction than for previous single site results. As high as 60% accuracy was obtained for whole brain classification, with the best accuracy from connections involving regions of the default mode network, parahippocampaland fusiform gyri, insula, Wernicke Area, and intraparietal sulcus. The classifier score was related to symptom severity, social function, daily living skills, and verbal IQ. Classification accuracy was significantly higher for sites with longer BOLD imaging times.

Conclusions: Multisite functional connectivity classification of autism outperformed chance using a simple leave-one-out classifier, but exhibited poorer accuracy than for single site results. Attempts to use multisite classifiers will likely require improved classification algorithms, longer BOLD imaging times, and standardized acquisition parameters for possible future clinical utility.

Keywords: ABIDE; autism; classification; fcMRI; functional connectivity.


Figures

Figure 1
Figure 1
Summary of classification approach. Step 1, Association matrices corresponding to the intrinsic connectivity between each pair of 7266 gray matter regions (about 26.4 million connections) are estimated for the left out subject and the 963 remaining subjects. Step 2, Plot depicting an example connection (i.e., single cell of the possible 26.4 million cells from the association matrices in Step 1) for the 964 subjects. The plot includes axes for correlation strength and age, however, the plot represents a multidimensional space that includes age-squared, gender, and handedness as covariates. Black line, fit line for the control group; red line, fit line for the autism group; green data point, left out subject (a control subject in this example); green X, estimated value for the control group; blue X, estimated value for autism group; green vertical line, difference between actual connection strength value for left out subject and estimated value for control group; blue vertical line, difference between actual connection strength value for left out subject and estimated value for autism group. Steps 3 and 4 are described in the text.
Figure 2
Figure 2
Total accuracy, sensitivity, and specificity for leave-one-out classifier in 964 subjects. The total accuracy, sensitivity, and specificity are shown when all 26.4 million connections were included in the classifier and then for different p-value thresholds that determine which connections are included in the classifier.
Figure 3
Figure 3
Accuracy, sensitivity, and specificity for each data acquisition site. Accuracy (A) is shown for each data acquisition site at different p-value thresholds. The sensitivity and specificity (B) are shown for each data acquisition site at a threshold of p < 0.0001 (i.e., the threshold at which optimal total accuracy was obtained in Figure 2).
Figure 4
Figure 4
Relationship between a site's total accuracy and the number of imaging volumes acquired by each site. Each site's total accuracy was calculated when using a p < 0.0001 threshold (i.e., the threshold at which optimal total accuracy was obtained in Figure 2) and correlated with the number of BOLD imaging volumes acquired during the resting-state sequence.
Figure 5
Figure 5
Total accuracy for 7266 brain regions. Accuracy was determined for each of the 7266 brain regions independently by only taking into account the 7265 connections in which a given region was involved (no p-value threshold, all connections used). The minimum accuracy displayed for a single region is 53.95%, which was the false discovery rate corrected percentage for 7266 regions and a binomial cumulative distribution.
Figure 6
Figure 6
Total accuracy across connection strength and distance between brain regions. The 26.4 million connections were divided up into bins based on the correlation strength of the connection (determined by an independent sample) and the distance between the connection's two endpoints. Accuracy is displayed for each bin with at least one connection.
Figure 7
Figure 7
Scatterplots depict the relationship between the classifier scores for control subjects (black) and subjects with autism (red) and the following behavioral measures: ADOS-G social + communication algorithm score (A), ADI-R social verbal algorithm score (B), verbal IQ (C), performance IQ (D), SRS total score (E), and Vineland Adaptive composite standard score (F). Correlation coefficients and corresponding p-values are included on the plots.

References

    1. ADHD-200_Consortium. (2012). The ADHD-200 Consortium: a model to advance the translational potential of neuroimaging in clinical neuroscience. Front. Syst. Neurosci. 6:62 10.3389/fnsys.2012.00062 - DOI - PMC - PubMed
    1. Anderson J. S. (2013). Cortical underconnectivity hypothesis in autism: evidence from functional connectivity MRI, in Comprehensive Guide to Autism, eds Patel V., Martin C., Preedy V. (Berlin: Springer-Verlag; ) (in press). 10.1007/SpringerReference_331190 - DOI
    1. Anderson J. S., Druzgal T. J., Froehlich A., Dubray M. B., Lange N., Alexander A. L., et al. (2011a). Decreased interhemispheric functional connectivity in autism. Cereb. Cortex 21, 1134–1146 10.1093/cercor/bhq190 - DOI - PMC - PubMed
    1. Anderson J. S., Druzgal T. J., Lopez-Larson M., Jeong E. K., Desai K., Yurgelun-Todd D. (2011b). Network anticorrelations, global regression, and phase-shifted soft tissue correction. Hum. Brain Mapp. 32, 919–934 10.1002/hbm.21079 - DOI - PMC - PubMed
    1. Anderson J. S., Ferguson M. A., Lopez-Larson M., Yurgelun-Todd D. (2011c). Reproducibility of functional connectivity measurements in single subjects. AJNR Am. J. Neuroradiol. 32, 548–555 10.3174/ajnr.A2330 - DOI - PMC - PubMed