. 2013 Oct 1;18(4):533-45.
doi: 10.1016/j.cmet.2013.09.004.

Resveratrol improves adipose insulin signaling and reduces the inflammatory response in adipose tissue of rhesus monkeys on high-fat, high-sugar diet

Affiliations

Resveratrol improves adipose insulin signaling and reduces the inflammatory response in adipose tissue of rhesus monkeys on high-fat, high-sugar diet

Yolanda Jimenez-Gomez et al. Cell Metab. .

Abstract

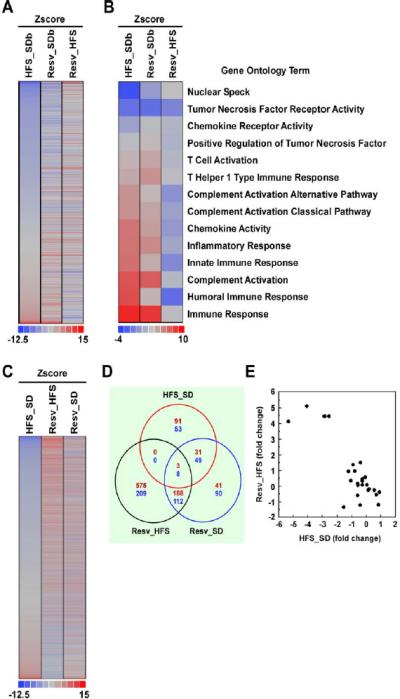
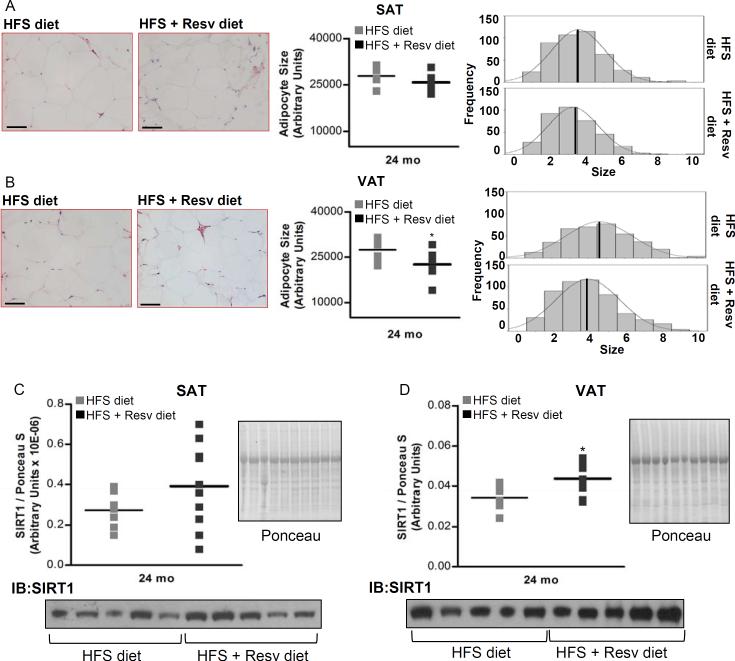
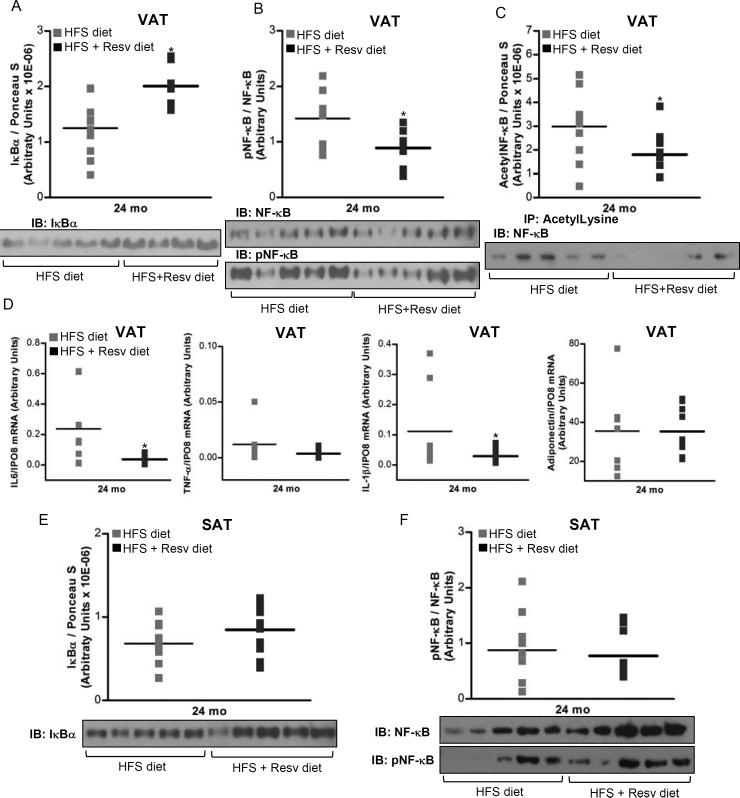
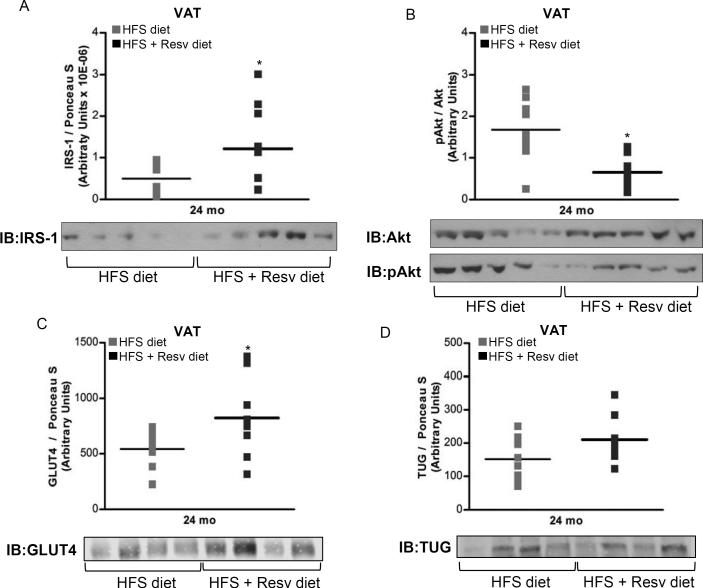
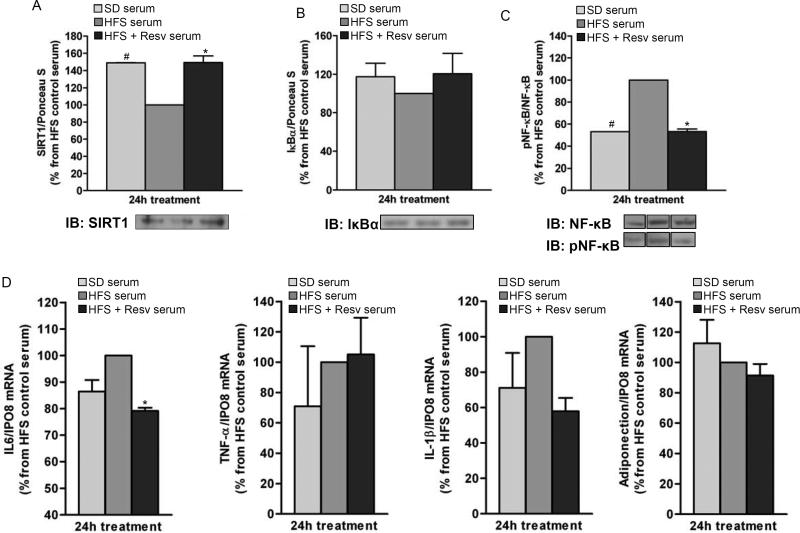
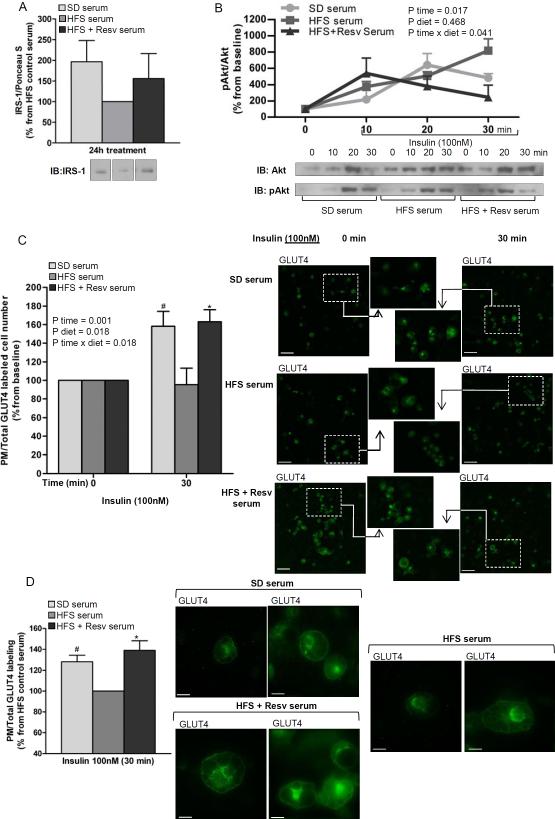
Obesity is associated with a chronic, low-grade, systemic inflammation that may contribute to the development of insulin resistance and type 2 diabetes. Resveratrol, a natural compound with anti-inflammatory properties, is shown to improve glucose tolerance and insulin sensitivity in obese mice and humans. Here, we tested the effect of a 2-year resveratrol administration on proinflammatory profile and insulin resistance caused by a high-fat, high-sugar (HFS) diet in white adipose tissue (WAT) from rhesus monkeys. Resveratrol supplementation (80 and 480 mg/day for the first and second year, respectively) decreased adipocyte size, increased sirtuin 1 expression, decreased NF-κB activation, and improved insulin sensitivity in visceral, but not subcutaneous, WAT from HFS-fed animals. These effects were reproduced in 3T3-L1 adipocytes cultured in media supplemented with serum from monkeys fed HFS ± resveratrol diets. In conclusion, chronic administration of resveratrol exerts beneficial metabolic and inflammatory adaptations in visceral WAT from diet-induced obese monkeys.


Figures

Figure 1
Figure 1. see also Table S2 and Table S3. Resveratrol supplementation induces changes in gene expression in two fat depots
(A) Gene expression profile from subcutaneous fat of rhesus monkeys fed for 2 years with a high-fat, high-sugar diet (HFS) without or with resveratrol (Resv) supplementation compared to standard diet-fed animals at baseline (SDb). (B) Heatmap of immune-related GO Terms in subcutaneous fat depot. The Z-score of a given GO Term showed striking difference when comparing Resv to HFS (Resv_HFS) vs. HFS to SDb (HFS_SDb). (C) Gene expression profile from visceral fat of rhesus monkeys fed for 2 years with HFS diet +/− Resv supplementation compared to SD-fed animals. (D) Venn diagram of overlapping genes significantly changed in the comparison HFS_SD, Resv_HFS, and Resv_SD. (E) Scatter plot of gene expression values in Resv_HFS vs. HSF_SD within the ‘stresspathway’ gene set. (A to E) SDb, n=2; SD, n=2; HFS diet, n=4 and HFS + Resv diet, n=4.
Figure 2
Figure 2. see also Figure S3. Resveratrol decreases mean adipocyte size and increases SIRT1 protein expression in visceral WAT of rhesus monkeys maintained on HFS diet for 2 years
(A) Morphologic characteristics of subcutaneous WAT. (B) Morphologic characteristics of visceral WAT. (C) SIRT1 protein levels in subcutaneous WAT. (D) SIRT1 protein levels in visceral WAT. (A and B) H&E-stained sections of WAT from monkeys fed HFS and HFS + Resv diet are shown. Images were captured at 20× magnification. Scale bar: 200 μm. Mean adipocyte size and adipocyte frequency distribution show cell surface areas in both fat depots after 24-mo of dietary intervention. (A to D) Results are expressed in a dot plot format, which represents the individual data and the mean. (A) n=7 (HFS diet); n=8 (HFS + Resv diet). (B) n=8 for each group. (C and D) n=10 for each group. The data were analyzed using Independent-Samples t test to analyze statistical significance between HFS vs. HFS+Resv diet at 24-mo of dietary intervention. *, P < 0.05 (HFS vs. HFS + Resv diet). HFS: high-fat, high-sugar; Resv: resveratrol; VAT: visceral adipose tissue; SAT: subcutaneous adipose tissue.
Figure 3
Figure 3. see also Table S4 and Table S5. Resveratrol decreases inflammatory response in visceral WAT of rhesus monkeys fed a HFS diet for 2 years
(A) IκBα protein levels in visceral WAT. (B) phosphorylated NF-κB/NF-κB ratio in visceral WAT. (C) Acetylated NF-κB protein content in visceral WAT. IP with a control IgG did not result in NF-κB detection (data not shown). (D) mRNA expression for IL-6, TNF-α, IL-1β and adiponectin in visceral WAT. (E) IκBα protein levels in subcutaneous WAT. (F) Phosphorylated NF-κB/NF-κB ratio in subcutaneous WAT. (A to F) Results are expressed in a dot plot format, which represents the individual data and the mean. (A and E) n=10 for each group. (B) n=9 (HFS diet); n=8 (HFS + Resv diet). (C) n=10 (HFS diet); n=9 (HFS + Resv diet). (D) IL-6 and IL-1β: n=8 (HFS diet); n=10 (HFS + Resv diet). TNF-α and adiponectin: n=7 (HFS diet); n=10 (HFS + Resv diet). (F) n=9 (HFS diet); n=10 (HFS + Resv diet). (A to F) The data were analyzed using Independent-Samples t test to analyze statistical significance between HFS vs. HFS + Resv diet at 24-mo of dietary intervention. IL-1β gene expression was log-transformed before statistical analysis. *, P < 0.05 (HFS vs. HFS + Resv diet). HFS: high-fat, high-sugar; Resv: resveratrol; VAT: visceral adipose tissue; SAT: subcutaneous adipose tissue; pNF-κB: phosphorylated NF-κB.
Figure 4
Figure 4. see also Figure S1. Resveratrol improves insulin sensitivity in visceral WAT of rhesus monkeys fed a HFS diet for 2 years
(A) IRS-1 protein expression. (B) Phosphorylated Akt/Akt ratio. (C) GLUT4 protein levels. (D) TUG protein content. (A to D) Results are expressed in a dot plot format, which represents the individual data and the mean. (A) n=8 (HFS diet); n=10 (HFS + Resv diet). (B) n=9 (HFS diet); n=10 (HFS + Resv diet). (C and D) n=10 (HFS diet); n=9 (HFS + Resv diet). The data were analyzed using Independent-Samples t test to analyze statistical significance between HFS vs. HFS + Resv diet at 24-mo of dietary intervention. *, P < 0.05 (HFS vs. HFS + Resv diet). HFS: high-fat, high-sugar; Resv: resveratrol; VAT: visceral adipose tissue; pAkt: phosphorylated Akt.
Figure 5
Figure 5. Serum from resveratrol-treated monkeys on HFS diet exerts anti-inflammatory effects in 3T3-L1 adipocytes
Fully-differentiated 3T3-L1 adipocytes were incubated for 24-h with media containing serum from SD and HFS +/− Resv diet-fed monkeys for 2 years. (A) SIRT1 protein levels. (B) IκBα protein levels. (C) Phosphorylated NF-κB/NF-κB ratio. Lanes were run on the same gel but were noncontiguous. (D) mRNA expression for IL-6, TNF-α, IL-1β and adiponectin. (A to D) The graphs show the mean ± SEM from 3 independent experiments, and the results are expressed as percent increase over the values observed in adipocytes treated with HFS serum. The data were analyzed using One-Way ANOVA. *, P < 0.05 (HFS vs. HFS + Resv serum); #, P < 0.05 (HFS vs. SD serum). SD: standard diet; HFS: high-fat, high-sugar; Resv: resveratrol; pNF-κB: phosphorylated NF-κB.
Figure 6
Figure 6. Serum from resveratrol-treated monkeys on HFS diet improves insulin signaling in 3T3-L1 adipocytes
(A) IRS-1 protein levels in 3T3-L1 adipocytes incubated for 24-h with media containing serum from SD and HFS +/− Resv diet-fed monkeys for 2 years (n=3). Lanes were run on the same gel but were noncontiguous. (B) Phosphorylated Akt/Akt ratio in 3T3-L1 adipocytes pretreated for 24-h with media containing serum from SD and HFS +/− Resv diet-fed monkeys for 2 years and stimulated with insulin (100 nM) for 10, 20 and 30 min (n=3). (C) Number of cells expressing GLUT4 at the plasma membrane. 3T3-L1 adipocytes were incubated for 24-h with media containing serum from SD and HFS +/− Resv diet-fed monkeys for 2 years and then treated in the absence (0 min) or presence of 100 nM insulin (30 min). GLUT4-labeled sections of 3T3-L1 adipocytes are shown. Images were captured at 10× magnification. Scale bar: 90 μm. The number of cells that were stained for GLUT4 at the plasma membrane over total cell number both in control and insulin-treated cells were counted (n=5). (D) Insulin-induced cell surface GLUT4 labeling. 3T3-L1 adipocytes were pretreated for 24-h with media containing serum from SD and HFS +/− Resv diet-fed monkeys for 2 years and then stimulated with insulin (100 nM) for 30 min. GLUT4-labeled sections of 3T3-L1 adipocytes are shown. Images were captured at 60× magnification. Scale bar: 15 μm. The amount of GLUT4 labeling at the plasma membrane of insulin-treated cells was normalized by the total GLUT4 staining in the same cells (n=5). (A to D) The graphs show the mean ± SEM, and the results are expressed as percent increase over the values observed in adipocytes treated with HFS serum (A and D) or as percent increase over the values observed in adipocytes at baseline (B and C). The data were analyzed using One-Way ANOVA and RM-ANOVA was used to calculate the time effect (P time), the diet effect (P diet) and the diet × time interaction (P diet × time). *, P < 0.05 (HFS vs. HFS + Resv serum); #, P < 0.05 (HFS vs. SD serum). SD: standard diet; HFS: high-fat, high-sugar; Resv: resveratrol; pAkt: phosphorylated Akt; PM: plasma membrane.

References

    1. Baur JA, Pearson KJ, Price NL, Jamieson HA, Lerin C, Kalra A, Prabhu VV, Allard JS, Lopez-Lluch G, Lewis K, et al. Resveratrol improves health and survival of mice on a high-calorie diet. Nature. 2006;444:337–342. - PMC - PubMed
    1. Bernier M, Paul RK, Martin-Montalvo A, Scheibye-Knudsen M, Song S, He HJ, Armour SM, Hubbard BP, Bohr VA, Wang L, et al. Negative regulation of STAT3 protein-mediated cellular respiration by SIRT1 protein. J. Biol. Chem. 2011;286:19270–19279. - PMC - PubMed
    1. Blander G, Guarente L. The Sir2 family of protein deacetylases. Annu. Rev. Biochem. 2004;73:417–435. - PubMed
    1. Bogan JS, Hendon N, McKee AE, Tsao TS, Lodish HF. Functional cloning of TUG as a regulator of GLUT4 glucose transporter trafficking. Nature. 2003;425:727–733. - PubMed
    1. Bogan JS, Rubin BR, Yu C, Löffler MG, Orme CM, Belman JP, McNally LJ, Hao M, Cresswell JA. Endoproteolytic cleavage of TUG protein regulates GLUT4 glucose transporter translocation. 2012. - PMC - PubMed

Publication types

MeSH terms

Associated data