. 2013 Oct 3;13(4):459-70.
doi: 10.1016/j.stem.2013.09.002.

Induction of multipotential hematopoietic progenitors from human pluripotent stem cells via respecification of lineage-restricted precursors

Affiliations

Induction of multipotential hematopoietic progenitors from human pluripotent stem cells via respecification of lineage-restricted precursors

Sergei Doulatov et al. Cell Stem Cell. .

Erratum in

Abstract

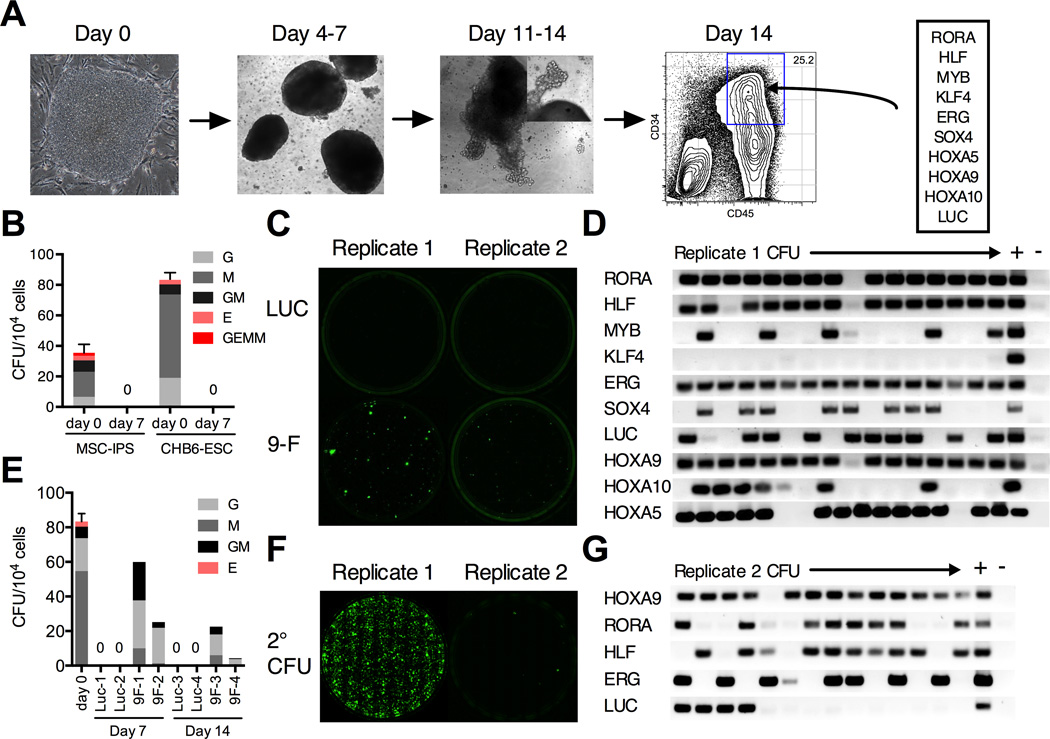
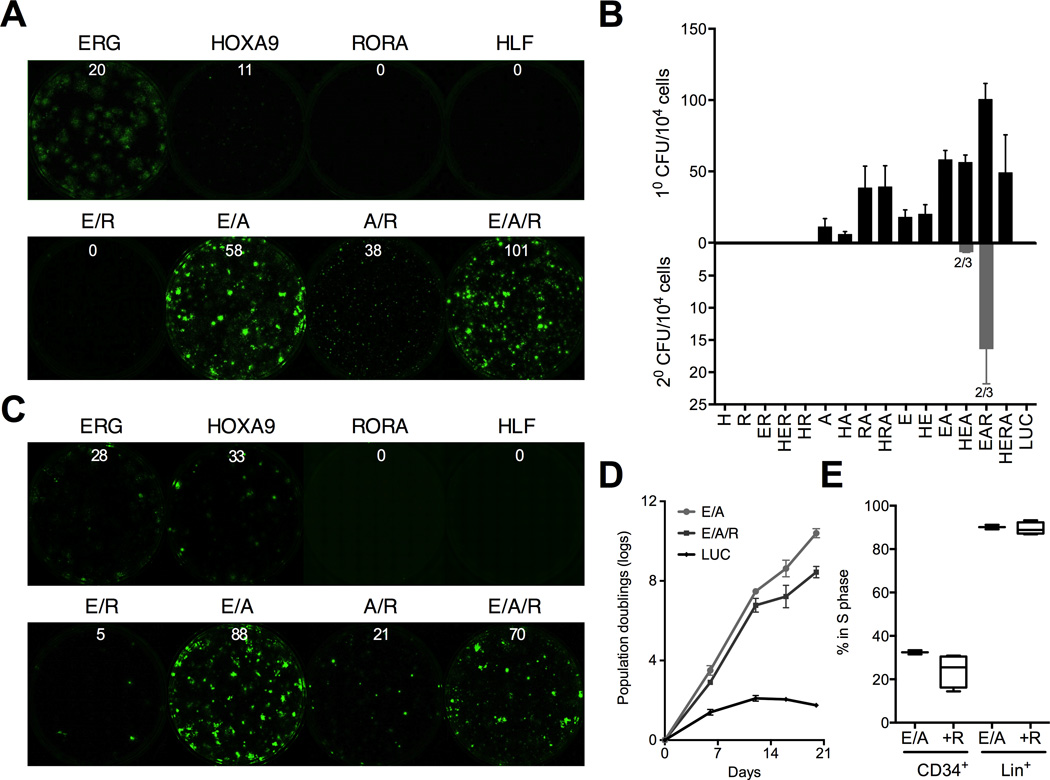
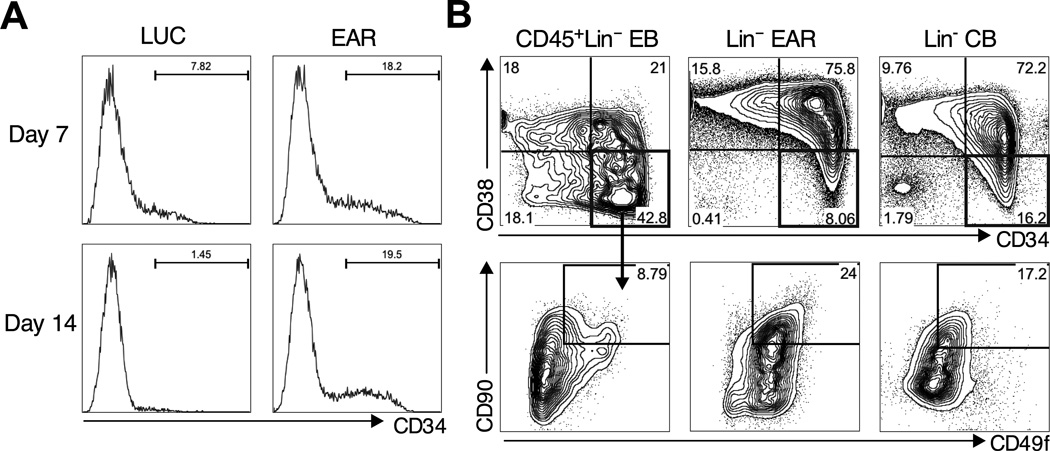
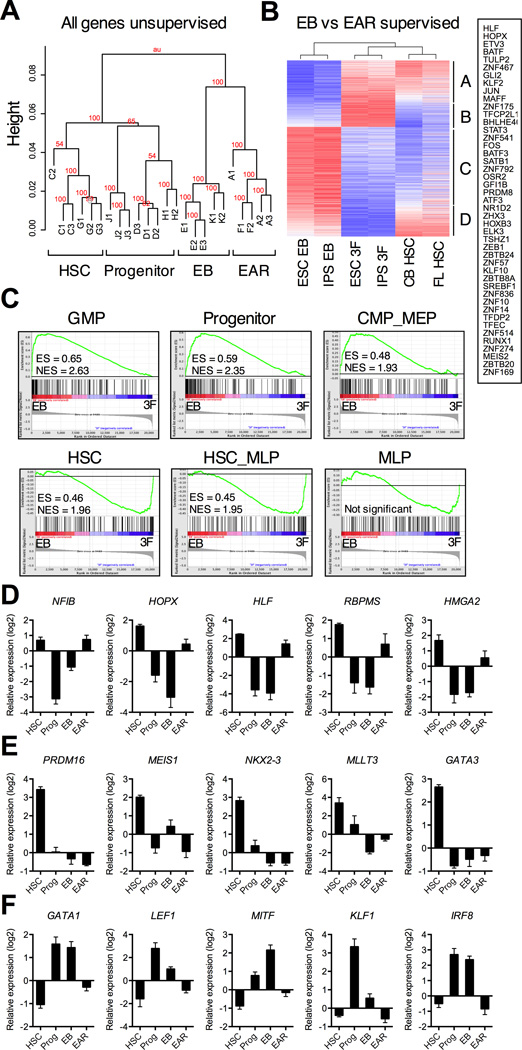
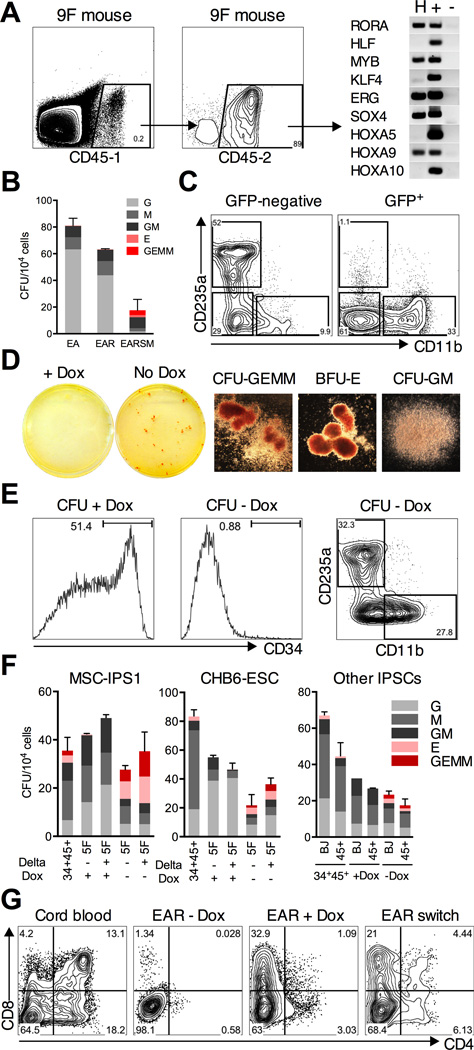
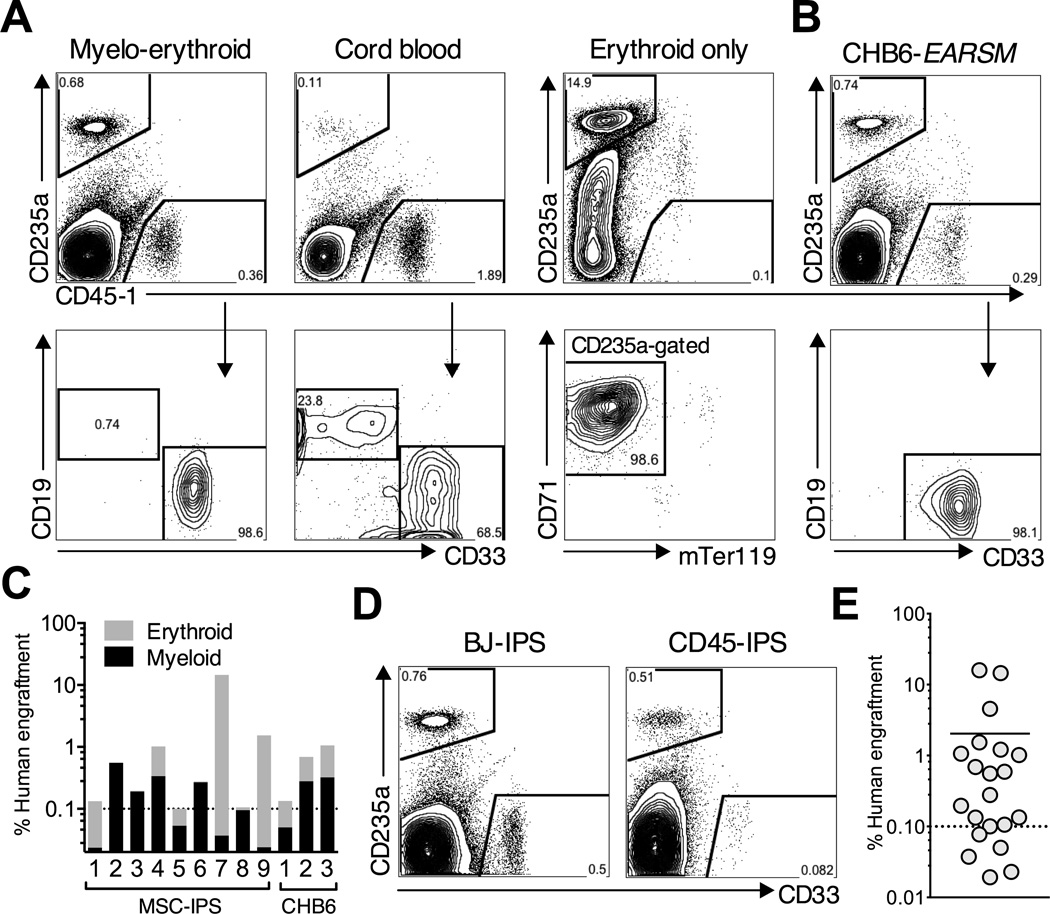
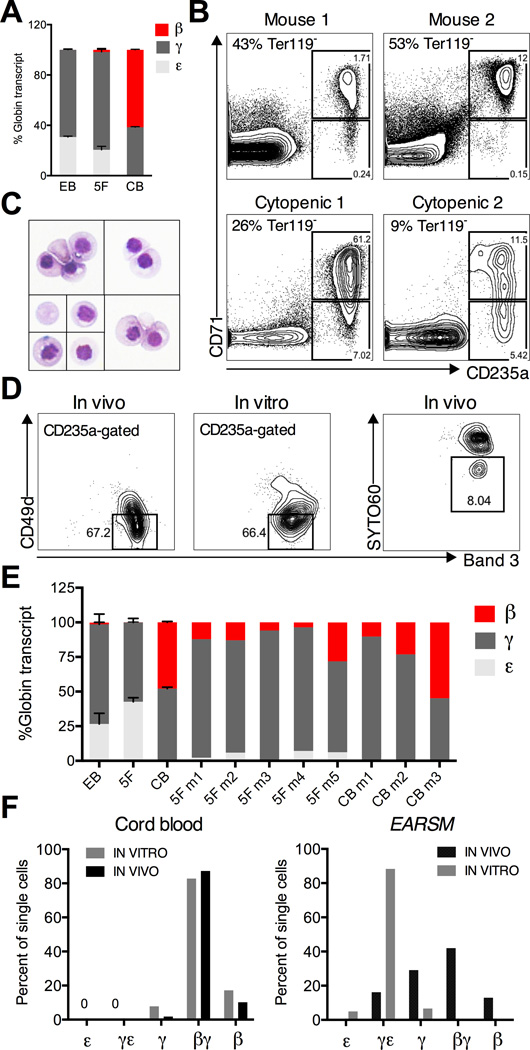
Human pluripotent stem cells (hPSCs) represent a promising source of patient-specific cells for disease modeling, drug screens, and cellular therapies. However, the inability to derive engraftable human hematopoietic stem and progenitor cells (HSPCs) has limited their characterization to in vitro assays. We report a strategy to respecify lineage-restricted CD34(+)CD45(+) myeloid precursors derived from hPSCs into multilineage progenitors that can be expanded in vitro and engrafted in vivo. HOXA9, ERG, and RORA conferred self-renewal and multilineage potential in vitro and maintained primitive CD34(+)CD38(-) cells. Screening cells via transplantation revealed that two additional factors, SOX4 and MYB, conferred engraftment. Progenitors specified with all five factors gave rise to reproducible short-term engraftment with myeloid and erythroid lineages. Erythroid precursors underwent hemoglobin switching in vivo, silencing embryonic and activating adult globin expression. Our combinatorial screening approach establishes a strategy for obtaining transcription-factor-mediated engraftment of blood progenitors from human pluripotent cells.


Figures

Figure 1
Figure 1. In vitro screen for progenitor re-specification
(A) The scheme for EB differentiation of human hPSCs into hematopoietic progenitors. EBs cultured in serum, BMP4, and cytokines are dissociated after 14 days. CD34+CD45+ progenitors are isolated by flow sorting and transduced with a 9F lentiviral library. (B) Colony-forming capacity of CD34+CD45+ EB progenitors from MSC-IPS1 and CHB6-ESC after sorting (day 0) is lost after 7 days of culture in serum-free media (day 7). (C) Representative plates of CHB6 EB progenitors transduced with the 9F library showing emergence of de novo hematopoietic colonies after 7 days of culture. (D) Retrospective analysis of transgene insertions in individual colonies isolated from replicate #1 in (C). LUC is an internal control for transduction efficiency. Columns ‘+’ and ‘–’ are positive and negative controls for PCR. (E) Colony counts and types observed after 7 or 14 days of culture of luciferase (Luc) or 9F–transduced progenitors. (F) Serial replating potential of 9F replicates. (G) Transgene insertions for a non-replating sample (replicate #2 in C) show that most colonies do not contain higher-order combinations of the common integrations. Data are shown as mean ± SEM of 3 independent samples. See also Figure S1.
Figure 2
Figure 2. Self-renewal is driven by HOXA9, ERG, and RORA
Prospective analysis of HOXA9 (A), ERG (E), HLF (H), and RORA (R) combinations in CHB-ESC (A and B) and MSC-IPS (C) (see also Figure S2A) progenitors using the in vitro colony assay. Independent pluripotent lines are shown to demonstrate reproducibility of the factor combinations. Representative plates for combinations of HOXA9, ERG, and RORA are shown in (A) and (C), and the full quantitation of primary and secondary colony-forming efficiency in (B). Numbers above the plates indicate an average number of colonies per 104 cells plated. Numbers below secondary bars indicate the fraction of replicates that gave rise to secondary colonies. (D) Proliferation of ERG, HOXA9 and RORA (EAR)- transduced progenitors compared with ERG and HOXA9 without RORA (EA), and LUC control. (E) Cell cycle analysis of EA- and EAR-induced CD34+ cells and the more mature lineage-positive (Lin+; defined as CD14+, CD15+, or CD11b+) cells with or without RORA after 14 days of culture. All data are shown as mean ± SEM of at least 3 independent replicates. See also Figure S2.
Figure 3
Figure 3. Factor-based establishment of hematopoietic hierarchy
(A) Progressive loss of CD34+ progenitors in control serum-free cultures (left panels, LUC), while EAR maintains and expands CD34+ cells (right panels). (B) Detailed analysis of the phenotypic HSC compartment in EBs, EAR cultures (from dissociated colonies), and primary CB. Lineage-positive cells are gated out (using a combination of CD14/CD15/CD11b for EBs and EAR). CD34 and CD38 delineates CD34+CD38 HSCs and CD34+CD38+ progenitors (top). CD34+CD38 fraction is further marked by CD90 and CD49f (bottom) with double positive cells being the most primitive in CB.
Figure 4
Figure 4. Gene expression analysis of re-specified progenitors
CD34+CD38 cells re-specified with EAR (fractions A and F) were compared to their respective starting CHB6-ESC and MSC-IPS EBs (fractions E and K), primary CB and FL HSCs (fractions C and G) and CD34+CD38+ progenitors (fractions D and H) by Affymetrix microarray profiling. Each sample was isolated by flow sorting with 2 or 3 biological replicates (#1–). (A) Unsupervised global clustering of all probes. Bootstrap values indicate confidence levels. (B) Supervised clustering of 2070 genes differentially expressed between CD34+CD38EBs and EAR progenitors re-specified from them (>2-fold; ttest, FDR <0.05). Clusters of differential genes are marked A-D. Transcription factors significantly upregulated by EAR (from clusters A and B) are boxed on the right. See Table S1 for a full list of genes. (C) Gene set enrichment of human HSC and progenitor signatures in EBs compared with EAR progenitors. ES = enrichment score; NES = normalized enrichment score; all comparisons were significant with FDR <10−4, except MLP. (D-F) Expression levels of top differentially expressed transcription factors (ranked by fold change) between CB and FL HSCs and progenitors (>2-fold; ttest, FDR <0.05; see Table S2 for a full gene list). Expression values are median transformed relative to all probes. (D) HSC transcription factors significantly upregulated by EAR. (E) HSC transcription factors not induced EAR. (F) Progenitor transcription factors significantly repressed by EAR. Data are shown as mean ± SEM of 6 total biological replicates for HSCs, or 5 replicates for progenitors, EBs, and EAR. See also Figure S3, Table S3 and S4.
Figure 5
Figure 5. Re-specification of myeloid-restricted precursors into multi-lineage progenitors
(A) Detailed analysis of human engraftment in a mouse transplanted with 9F cells after 14 days of culture. Two independent CD45 antibodies (CD45–1 and −2) were used to label human cells. (Right) Transgene insertions in CD45+ cells (column H) isolated from this mouse by flow sorting show SOX4 and MYB integrations. (B) Colony-forming efficiency of EB progenitors transduced with EA, EAR (+R), and EARSM (+SM) after 14 days of culture. (C) Flow analysis of dissociated EARSM colonies using CD235a (erythroid) and CD11b (myeloid) lineage markers. At least ten GEMM colonies were pooled, and plots are gated on GFP+ or -negative populations. (D) Colonies plated with or without Dox in the inducible transgene system. Erythroid and mixed colonies appear only upon Dox withdrawal. (Right) Representative images of CFU-GEMM, BFU-E, and CFU-GM colonies on plates without Dox. (E) Self-renewing CD34+ progenitors differentiate into myeloid and erythroid cells upon Dox removal. Flow analysis of dissociated EARSM colonies using the CD34 progenitor marker (left panels) and lineage markers CD11b and CD235a (right panel). (F) Re-specification of EB myeloid precursors into mixed lineage CFU-GEMM progenitors from MSC-IPS1 (left), CHB6-ESC (middle), and two other myeloid-restricted IPSC lines (right). EB progenitors were infected with EARSM and cultured with or without immobilized Delta1 ligand. Each group was plated with or without Dox. (G) T cell potential of re-specified cells in an OP9-DL1 stromal co-culture. EAR-induced cells were cultured on OP9-DL1 without Dox (EAR - Dox), with Dox (EAR + Dox), or with Dox for the first 2 weeks followed by Dox removal (EAR switch). Development of CD4+CD8+ T cells was assessed following 35 days of culture, compared with CB CD34+ cells. Plots are gated on CD45+ cells. Data in (B) and (F) are shown as mean ± SEM of at 3 independent replicates. See also Figure S4 and S5.
Figure 6
Figure 6. Short-term engraftment of re-specified progenitors
EB progenitors derived from MSC-IPS (A) or CHB6-ESC (B) were re-specified with inducible EARSM in serum free culture with Dox for 7–16 days, and 0.8 – 1.2 × 10⁶ cells were transplanted into the right femur of adult NSG mice. As a control, 1 × 10⁶ CB mononuclear cells were transplanted. All mice were kept on Dox in the drinking water. Human engraftment was analyzed 4–5 weeks post-transplantation using two human CD45 (myeloid, lymphoid) and CD235a (erythroid) antibodies. Only engraftment the in injected femur is shown. (A) Representative myelo-erythroid engraftment in EARSM- (left) and cord blood- (middle) transplanted mice. Cells positive for CD45 are sub-gated on CD19 and CD33 (bottom row). Right: a representative mouse engrafted only with human erythroid cells. CD235a–positive cells are sub-gated on CD71 and mouse Ter119. (B) Representative engraftment in CHB6-ESC mice. (C) Myeloid and erythroid lineage distribution in engrafted (>0.1% of human chimerism) MSC-IPS and CHB6-ESC mice. The height of the bar indicates total engraftment level calculated as %CD235a plus %CD45+. (D) Representative engraftment in mice transplanted with independently-derived IPSC lines, BJ-IPS and CD45-IPS. (E) Summary of engraftment level in all transplanted mice with four different hPSC lines. See also Figure S6 and S7.
Figure 7
Figure 7. In vivo globin switching in embryonic erythrocytes
(A) Quantitative PCR for the expression of adult HBB (β), fetal HBG (γ), and embryonic HBE (ε) hemoglobin genes in BFU-E colonies derived from EBs, EARSM (5F), and CB. Expression of each gene was calculated using absolute quantification and displayed as percent of total globin transcript. (B) Analysis of human erythroid graft in two normopenic (Mouse 1 and 2) and two cytopenic EARSM mice using human CD71 and CD235a. Plots are sub-gated on Ter119-negative mouse cells, and percent of mouse erythrocytes is indicated. (C) Giemsa staining of Ter119-CD71+CD235+ human erythrocytes. Representative single cells and clusters are shown. (D) Erythroid maturation in vivo and in vitro determined by expression of Band3 and CD49d (integrin α4). Progressive maturation is marked by high levels of Band3 and loss of CD49d (gated population). Only CD235a+ cells are shown. (Right panel) The proportion of enucleated erythrocytes in vivo using cell-permeable nuclear dye SYTO60 (gated SYTO60-negative population). (E) Hemoglobin expression in Ter119-CD71+CD235+ human erythroblasts isolated from the marrow of multiple mice transplanted with CB or EARSM progenitors, in comparison with BFU-Es from EBs, 5F, and CB. (E) Hemoglobin expression in single Ter119-CD71+CD235+ erythroblasts isolated from transplanted mice (IN VIVO) or from cultured BFU-Es (IN VITRO). The cut-off for co-expression was set at 10% (i.e. a cell with 90/10% ratio of β/γ transcript is classified as βγ, while 95/5% as β-only). Single cell expression was validated by comparing against wells sorted with 50 cells. Data in (A) and (E) is shown as the mean ± SEM of at least 2 samples. Data in (F) represents >80 sorted single cells.

References

    1. Agarwal S, Loh YH, McLoughlin EM, Huang J, Park IH, Miller JD, Huo H, Okuka M, Dos Reis RM, Loewer S, et al. Telomere elongation in induced pluripotent stem cells from dyskeratosis congenita patients. Nature. 2010;464:292–296. - PMC - PubMed
    1. Amsellem S, Pflumio F, Bardinet D, Izac B, Charneau P, Romeo PH, Dubart-Kupperschmitt A, Fichelson S. Ex vivo expansion of human hematopoietic stem cells by direct delivery of the HOXB4 homeoprotein. Nature medicine. 2003;9:1423–1427. - PubMed
    1. Anstee DJ, Gampel A, Toye AM. Ex-vivo generation of human red cells for transfusion. Current opinion in hematology. 2012;19:163–169. - PubMed
    1. Bertrand JY, Chi NC, Santoso B, Teng S, Stainier DY, Traver D. Haematopoietic stem cells derive directly from aortic endothelium during development. Nature. 2010;464:108–111. - PMC - PubMed
    1. Boisset JC, van Cappellen W, Andrieu-Soler C, Galjart N, Dzierzak E, Robin C. In vivo imaging of haematopoietic cells emerging from the mouse aortic endothelium. Nature. 2010;464:116–120. - PubMed

Publication types

MeSH terms

Associated data