. 2013 Oct 21;23(20):1999-2010.
doi: 10.1016/j.cub.2013.07.076. Epub 2013 Oct 3.

Nuclear repulsion enables division autonomy in a single cytoplasm

Affiliations

Nuclear repulsion enables division autonomy in a single cytoplasm

Cori A Anderson et al. Curr Biol. .

Abstract

Background: Current models of cell-cycle control, based on classic studies of fused cells, predict that nuclei in a shared cytoplasm respond to the same CDK activities to undergo synchronous cycling. However, synchrony is rarely observed in naturally occurring syncytia, such as the multinucleate fungus Ashbya gossypii. In this system, nuclei divide asynchronously, raising the question of how nuclear timing differences are maintained despite sharing a common milieu.

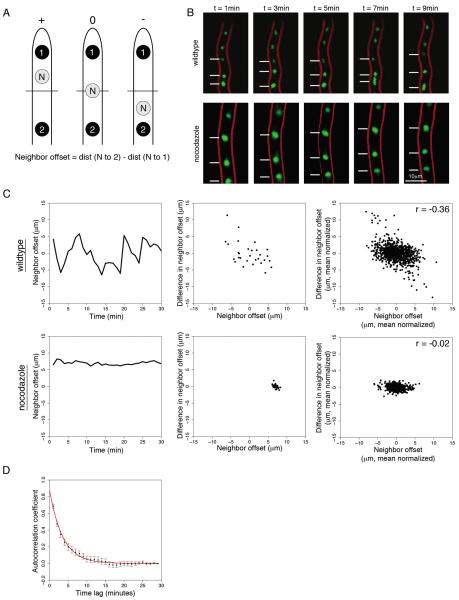
Results: We observe that neighboring nuclei are highly variable in division-cycle duration and that neighbors repel one another to space apart and demarcate their own cytoplasmic territories. The size of these territories increases as a nucleus approaches mitosis and can influence cycling rates. This nonrandom nuclear spacing is regulated by microtubules and is required for nuclear asynchrony, as nuclei that transiently come in very close proximity will partially synchronize. Sister nuclei born of the same mitosis are generally not persistent neighbors over their lifetimes yet remarkably retain similar division cycle times. This indicates that nuclei carry a memory of their birth state that influences their division timing and supports that nuclei subdivide a common cytosol into functionally distinct yet mobile compartments.

Conclusions: These findings support that nuclei use cytoplasmic microtubules to establish "cells within cells." Individual compartments appear to push against one another to compete for cytoplasmic territory and insulate the division cycle. This provides a mechanism by which syncytial nuclei can spatially organize cell-cycle signaling and suggests size control can act in a system without physical boundaries.


Figures

Figure 1
Figure 1. Mitosis in A. gossypii is not restricted in space or time
A) Observed division times in A. gossypii cells, mean=118±38min (n=92 division times, 7 independent timelapse movies). B) Plot of mitosis locations throughout the cell. Each mitosis is indicated as an `x'. The color of the `x' corresponds to the timepoint of mitosis. This mitosis map shows most nuclei divide in the central parental hypha rather than in the lateral side branches. Some of this bias is from the fact that the parent hypha has been in existence for longer time than the side branches and so by chance more mitoses would occur in that region of the cell. C) Movie still images of dividing nuclei in a germinating spore. After the first nuclear division, sister nuclei cycle asynchronously, 15 minutes apart (asterisks indicate the first sister mitosis, arrowheads indicate the second sister mitosis).
Figure 2
Figure 2. Non-random nuclear spacing requires microtubule regulation
A) Image of an A. gossypii cell expressing H4-GFP. Cell outline is false colored red. B) Cumulative distribution plot of observed distances between nuclei (black line) compared to randomzed simulations of nuclear spacing (p<0.001). The grey dashed line represents the median and the grey shaded area represents the bounds of 100 random simulations. C) Cumulative distribution plot of observed distances between nuclei in mutants that lack microtubule motors or have perturbed microtubule length. D) Cumulative distribution plot of observed distances between nuclei compared to a simulation of randomized nuclear spacing for both WT and prom180-DYN1. E) Percent difference of observed nuclear spacing from random spacing. Bar heights correspond to a comparison against the mean of 100 random simulations and error bars represent comparisons against the 2.5 and 97.5th percentiles of the random simulations. Values near 100% indicate more constant spacing, while values near 0% indicate spacing that is closer to random.
Figure 3
Figure 3. Nuclei repel one another to generate non-random spacing
A) Schematic of neighbor offset. The reference nucleus (N) is in grey and its two neighboring nuclei are labeled 1 & 2. The neighbor offset for each scenario is indicated above the hypha (+, 0, or −). B) Images of nuclear positions in wild-type and nocodazole treated cells. Lines indicate nuclear positions of three neighboring nuclei changing over time in wildtype but remaining comparable in nocodazole treated cells. C) Nuclear offset time series for wild-type cells and nocodazole treated cells. Left plots: Neighbor offset through time for an individual nucleus. Middle plots: scatterplot of neighbor offset versus difference in neighbor offset for a single nucleus. Right plots: Mean normalized neighbor offset versus difference in neighbor offset for all tracked nuclei. D) Autocorrelation functions of nuclear offsets in wild-type cells and an exponential fit (red). Points represent mean autocorrelation function over all wild-type nuclear traces, bars represent SEM.
Figure 4
Figure 4. Local nuclear spacing is related to cell cycle progression
A) Scatterplot of local nuclear spacing through time for an individual nucleus (r=0.91). B) Cumulative distribution plots of all nuclear spacing (excluding timepoints immediately after mitoses) and spacing immediately before a mitosis events. C) Still images of nuclear spacing at t=0 hours and t=4 hours after nocodazole treatment release. Cells were treated with either DMSO or 10μg/ml nocodazole for 4 hours before release. D) Cumulative distribution plot of internuclear distances at t=0 hours and t=4 hours post release. Cells were treated with either DMSO or 10μg/ml nocodazole for 4 hours before release. T=0 hours post release: control median=2.9μm, nocodazole median=6.9μm; T=4 hours post release: control median=3.2μm, nocodazole median=4.4μm.
Figure 5
Figure 5. Nuclear spacing and division timing synchrony
A) Schematic of nuclear relationships. By-passing nuclei are defined as those that come within 0.25μm of each other. Neighboring nuclei are defines as those who spend >30min within 2–5μm of each other. The difference between the timepoint of division for each nuclear relationship is indicated as Δtimepoint of mitosis. B) Boxplot of delta timepoint of mitosis for all tracked nuclei and observed divisions. A randomized delta timepoint was calculated based on observed mitosis times. ANOVA, p<0.05. C) Movie still images of nuclei in prom130-DYN1 cells. Synchronously dividing nuclei are indicated with an asterisk (*). In cells 1 and 2, neighboring nuclei divide at the exact same time, while a run of several nuclei in cell 3 divide within a 10min timespan. D) Stacked barplot of synchronous runs of nuclei based on immunofluorescence analysis of cell cycle stages. Black bars indicate those runs that contain only 2 nuclei and bars in white represent those runs with three or greater nuclei. A chance proportion of expected runs was calculated and plotted to compare with the observed synchrony in both WT and prom130-DYN1.
Figure 6
Figure 6. Sister nuclear division cycle durations are correlated
A) Schematic of division timing relationship in a nuclear lineage (difference in observed division times is shown as ΔT). B) Sister nuclear cycle durations. The nuclear division cycle length of the slower sister is plotted in black with the faster sister overlaid in grey (n=32 pairs of sisters). Kolmogorov-Smirnov (K-S) test plot of observed sister nuclear cycle durations. The observed differences in sister division times displayed as a cumulative distribution plot in black. A randomized difference was calculated and the cumulative distribution shown as a red line (p<0.05). C) Representative nuclear pairs that remain close or travel far apart over time (red nuclear pair is 8.2μm apart and orange nuclear pair is 26.9μm apart 75min after mitosis). Histogram of sister distances 75min after mitosis.

Similar articles

Cited by

References

    1. Rao PN, Johnson RT. Premature chromosome condensation: a mechanism for the elimination of chromosomes in virus-fused cells. J. Cell. Sci. 1972;10:495–513. - PubMed
    1. Johnson RT, Rao PN. Nucleo-cytoplasmic interactions in the acheivement of nuclear synchrony in DNA synthesis and mitosis in multinucleate cells. Biol Rev Camb Philos Soc. 1971;46:97–155. - PubMed
    1. Rao PN, Johnson RT. Mammalian cell fusion. IV. Regulation of chromosome formation from interphase nuclei by various chemical compounds. J. Cell. Physiol. 1971;78:217–223. - PubMed
    1. Johnson RT, Rao PN. Mammalian cell fusion: induction of premature chromosome condensation in interphase nuclei. Nature. 1970;226:717–722. - PubMed
    1. Johnson RT, Rao PN, Hughes HD. Mammalian cell fusion III. A hela cell inducer of premature chromosome condensation active in cells from a variety of animal species. J. Cell. Physiol. 1970;76:151–157. - PubMed

Publication types

Substances

LinkOut - more resources