. 2014 Jan;146(1):245-56.
doi: 10.1053/j.gastro.2013.09.050. Epub 2013 Oct 2.

DCLK1 marks a morphologically distinct subpopulation of cells with stem cell properties in preinvasive pancreatic cancer

Affiliations

DCLK1 marks a morphologically distinct subpopulation of cells with stem cell properties in preinvasive pancreatic cancer

Jennifer M Bailey et al. Gastroenterology. 2014 Jan.

Abstract

Background & aims: As in other tumor types, progression of pancreatic cancer may require a functionally unique population of cancer stem cells. Although such cells have been identified in many invasive cancers, it is not clear whether they emerge during early or late stages of tumorigenesis. Using mouse models and human pancreatic cancer cell lines, we investigated whether preinvasive pancreatic neoplasia contains a subpopulation of cells with distinct morphologies and cancer stem cell-like properties.

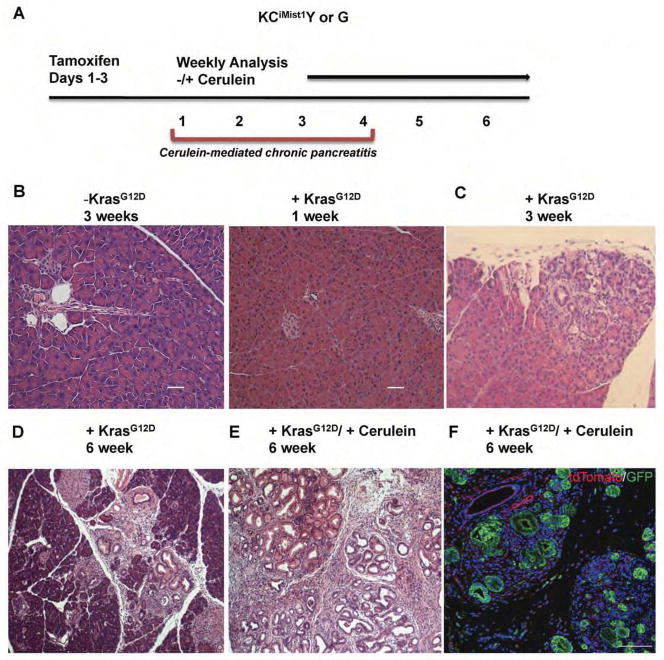
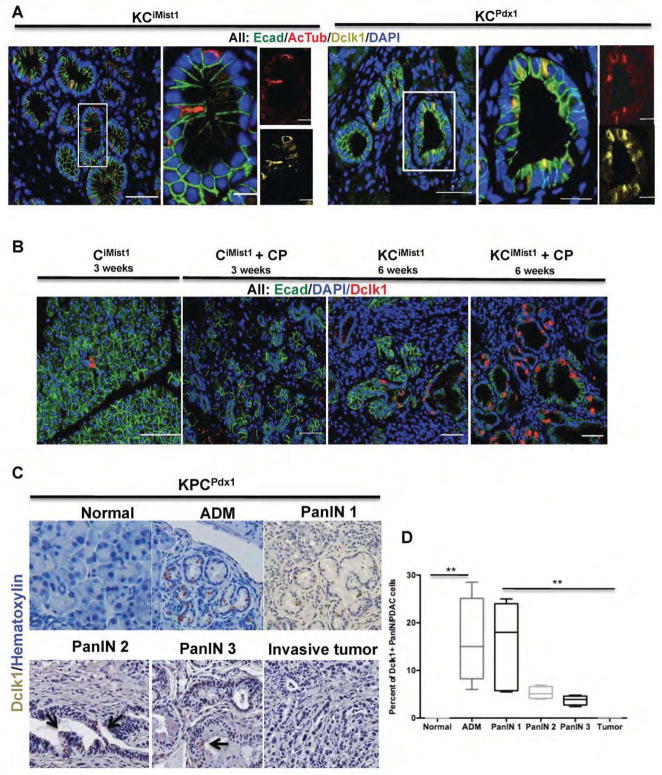
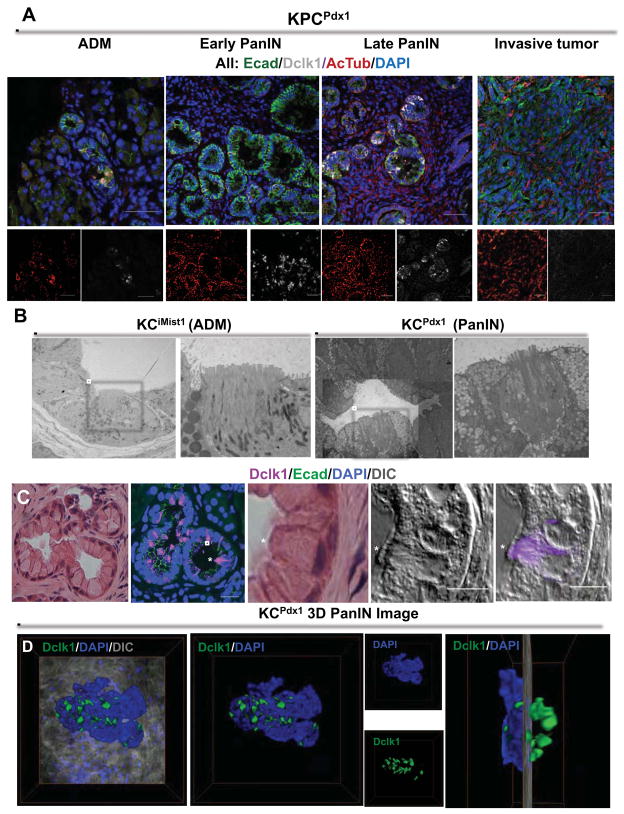
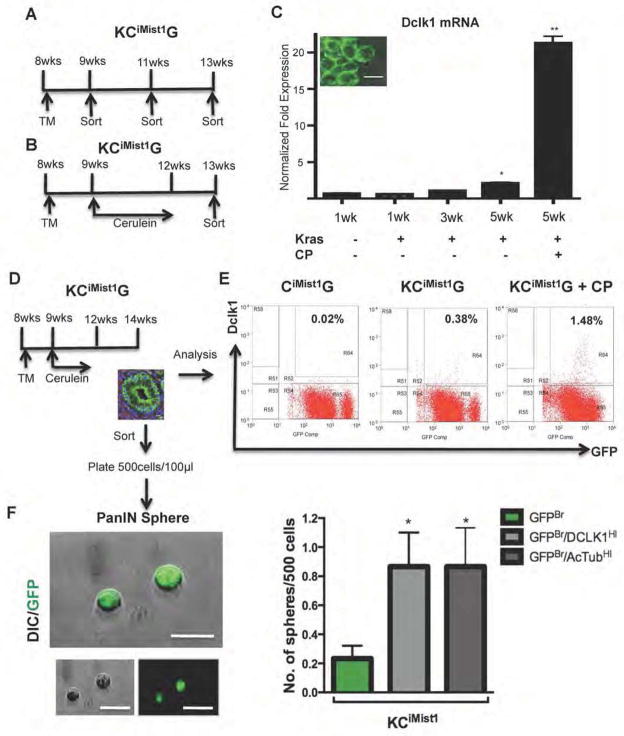
Methods: Pancreatic tissue samples were collected from the KC(Pdx1), KPC(Pdx1), and KC(iMist1) mouse models of pancreatic intraepithelial neoplasia (PanIN) and analyzed by confocal and electron microscopy, lineage tracing, and fluorescence-activated cell sorting. Subpopulations of human pancreatic ductal adenocarcinoma (PDAC) cells were similarly analyzed and also used in complementary DNA microarray analyses.

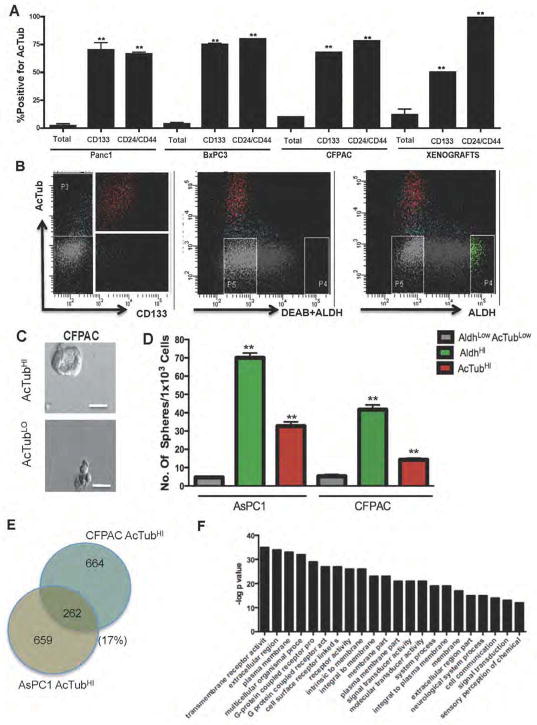
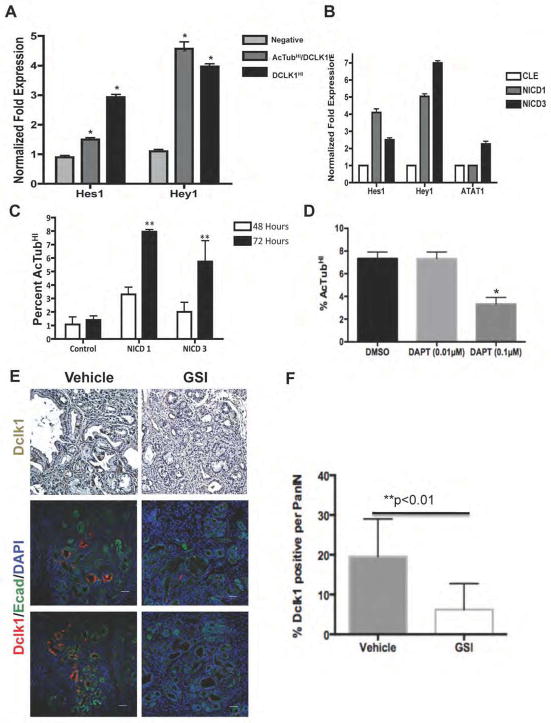
Results: The microtubule regulator DCLK1 marked a morphologically distinct and functionally unique population of pancreatic cancer-initiating cells. These cells displayed morphological and molecular features of gastrointestinal tuft cells. Cells that expressed DCLK1 also expressed high levels of ATAT1, HES1, HEY1, IGF1R, and ABL1, and manipulation of these pathways in PDAC cell lines inhibited their clonogenic potential. Pharmacological inhibition of γ-secretase activity reduced the abundance of these cells in murine PanIN in a manner that correlated with inhibition of PanIN progression.

Conclusions: Human PDAC cells and pancreatic neoplasms in mice contain morphologically and functionally distinct subpopulations that have cancer stem cell-like properties. These populations can be identified at the earliest stages of pancreatic tumorigenesis and provide new cellular and molecular targets for pancreatic cancer treatment and/or chemoprevention.

Keywords: ADM; AcTub; Acetylated Tubulin; Dclk1; FACS; GFP; Kras; Notch; PDAC; PanIN; TEM; acetylated α-tubulin; acinar-to-ductal metaplasia; doublecortin and Ca(2+)/calmodulin-dependent kinase-like 1; fluorescence-activated cell sorting; green fluorescent protein; mPanIN; murine pancreatic intraepithelial neoplasia; pancreatic ductal adenocarcinoma; pancreatic intraepithelial neoplasia; transmission electron microscopy.


Conflict of interest statement

Jennifer M. Bailey has no Conflict of interest

Janivett Alsina has no Conflict of Interest

Zeshaan A. Rasheed has no Conflict of Interest

Ya-Yuan Fu has no Conflict of Interest

Ruben Pletz has no conflict of Interest

Florencia McAllister has no Conflict of Interest

Hao Zhang has no Conflict of Interest

Nabeel Bardeesy has no conflict of interest

Pankaj Pasricha has no Conflict of Interest

William Matsui has no Conflict of Interest

Anirban Maitra has no Conflict of Interest

Steven Leach has no Conflict of Interest

Figures

Figure 1
Figure 1. Histological analysis of mPanIN progression model after activation of oncogenic Kras in the acinar cell compartment
(A) Schematic illustrating tamoxifen induction of CreERT2 activity with and without concomitant cerulein-induced chronic pancreatitis in Mist1:CreERT2; LSL-Kras; LSL-YFP (KCiMist1Y) and Mist1:CreERT2; LSL-Kras; mTmG (KCiMist1G) mice. (B–E) Progressive PanIN formation with and without concomitant chronic pancreatitis. (B) No PanIN are detected in either the absence of KrasG12D activation or 1 week following KrasG12D activation. (C) Representative section depicting mPanIN three weeks after oncogenic Kras expression, at which point mPanINs typically occupy ~5% of cross sectional area. (D) Increased PanIN density 6 weeks following KrasG12D activation, at which point mPanINs typically occupy ~10–15% of cross sectional area. (E) Accelerated PanIn formation following KrasG12D activation in combination with cerulein-mediated chronic pancreatitis; PanIN lesions occupy greater than 70% of the pancreas. (F) Antibody labeling for GFP and tdTomato in pancreatic tissue harvested from KCiMist1G mice confirms acinar cell origin of ADM and PanIN.
Figure 2
Figure 2. Dclk1 and AcTub label a distinct cell type in mPanIN
(A) Expression of E-cadherin (green), Dclk1 (yellow) and AcTub (red) in KCiMist1+CP (6 weeks post tamoxifen) and KCPdx1 (18 weeks old) mice. White boxes outline representative areas depicted at higher magnification in adjacent images. Note overlapping labeling for Dclk1 (yellow) and AcTub (red) in distinct subset of mPanIN epithelial cells. (B) Cerulein treatment increases the abundance of Dclk1-expressing cells within mPanIN. (C) Immunohistochemical analysis of Dclk1 expressing cells in KPCPdx1 mice. (D) Dclk1 expressing cells are significantly increased in ADM, mPanIN and invasive PDAC relative to normal pancreatic ductal epithelium. Compared to PanIN1, however, the relative abundance of Dclk1-expressing cells progressively decreases in advanced PanINs and invasive PDAC (**p<0.01).
Figure 3
Figure 3. Dclk1- and AcTub-expressing PanIN cells display a tuft cell phenotype
(A) Immunoflourescent analysis of E-cadherin (green) Dclk1 (white) and AcTub (red) in ADM, early and late PanIN and invasive tumors from KPCPdx1 mice. (B) Transmission electron micrograph depicting ADM (left) and mPanIN (right) from the KCiMist1 model. White boxes indicate cells with pronounced microvilli, shown at higher magnification in adjacent images.. (C) H&E staining on mPanIN from a 9 month old KCPdx1 mouse. Confocal microscopy showing overlay of Dclk1 (purple) and E-cadherin (green). H&E and high-resolution confocal analysis of PanIN tuft cell (marked by *), displaying prominent apical microvilli and expressing Dclk1 (purple). (D) Three dimensional PanIN image from a 9 month old KCPdx1 mouse showing spatial orientation of Dclk1 (green) positive cells. Right most image depicts 90 degree rotation of three-dimensional image, revealing clusters of Dclk1 expressing PanIN cells.
Figure 4
Figure 4. Dclk1 and AcTub cells show progenitor capability in preinvasive lesions
(A,B) Schematic outline of the sorting strategy to isolate eGFP+ cells at different time points after KCiMist1G mice were treated with either tamoxifen alone (A) or tamoxifen and cerulein (B). (C) Dclk1 mRNA levels significantly increase in FACS sorted GFP+ cells during mPanIN progression (**p<0.01). Inset shows imaging confirming membrane eGFP expression in isolated cells. (D) Sorting strategy for FACS-based isolation of eGFP+ cells from PanIN bearing KCiMist1G + CP mice. To generate PanIN spheres, KCiMist1G mice were treated with tamoxifen (TM) and cerulein, then left untreated for two weeks before the isolation of eGFP+ cells. (E) FACS analysis of KCiMist1G + CP demonstrating dramatic increase in Dclk1-expressing cells. Percentages indicate fraction of all pancreatic cells comprising the Dclk1HI/GFPBr subpopulation. (F) PanIN-sphere formation by Dclk1HI/GFPBr, AcTubHI/GFPBr, and GFPBr subpopulations. Dclk1HI/GFPBr, AcTubHI/GFPBr, and GFPBr cells were FACS-sorted, plated at clonal density and cultured for seven days in low attachment plates. Graph indicates relative sphere-forming efficiency for different cell populations (*p<0.05 vs. GFPBr control).
Figure 5
Figure 5. DCLKHI/AcTubHI cells are pancreatic cancer initiating cells
(A) Enrichment for cell surface AcTub labeling among CD133 or CD24/CD44/ESA positive cells in Panc1, BxPC3 and CFPAC cell lines and in two harvested human xenografts. Cells expressing CD133 or CD24/CD44/ESA are also enriched for expression of cell surface AcTub compared to the bulk cell population (**p<0.001). (B) FACS plots showing overlap of AcTub cell surface labeling with other published markers of pancreatic cancer stem cells, CD133 and ALDH. Significant overlap is observed for AcTub and CD133, but not for AcTub and ALDH (C) Tumor sphere derived from FACS sorted AcTubHI cells from the CFPAC cell line (scale bar 50μm). (D) Graphical representation of in vitro tumor initiating capacity of AcTubHI/DCLK1HI subpopulations isolated from two different pancreatic cancer cell lines. The non-overlapping AcTubHI/DCLK1HI and ALDHHI subpopulations formed significantly more spheres than the control AcTubLO/ALDHLO fraction (**p<0.01). (E) Whole transcriptome analysis on FACS-sorted AcTubHI cells from both the CFPAC and AsPC1 cell lines. In these analyses, 926 genes were upregulated in AcTubHI vs. AcTubLO CFPAC cells and 921 genes were upregulated in AcTubHI ASPC1 vs AcTubLO cells. A total of 262 genes were upregulated in both CFPAC AcTubHI and ASPC1 AcTubHI cells. (F) Gene set enrichment analysis of 262 upregulated genes. The GO category “transmembrane receptor activity” was the most highly enriched functional group (p=1.322e-35), and many other groups related to cell surface receptors were similarly enriched. A complete listing of differentially expressed genes is provided in Table S2.
Figure 6
Figure 6. AcTubHI/DCLK1HI PDAC stem cell function is regulated by Notch
(A) Quantitative Real Time PCR confirming increased expression of Hes1 and Hey1 in FACS sorted AcTubHI/DCLK1HI cells. (B) Expression of NICD1 or NICD3 increases the expression of Hes1, Hey1 and ATAT1 mRNA levels. (C) Expression of NICD1 or NICD3 significantly increases the percentage of cells with detectable cell surface AcTub (**p<0.01). (D) Treatment of the CFPAC cell line with DAPT decreases the percentage of cells with cell surface AcTub labeling (*p<0.05). (E) Immunohistochemistry and immunoflourescent analysis of pancreatic tissue from vehicle-treated and γ-secretase inhibitor (MRK-300)-treated KPCPdx1 mice. (F) Quantification of Dclk1 labeling shown in (E). In vivo inhibition of Notch signaling significantly reduces the fraction of mPanIN epithelial cells expressing Dclk1 (**p<0.01).

Comment in

References

    1. Chen J, Li Y, Yu TS, McKay RM, Burns DK, Kernie SG, Parada LF. A restricted cell population propagates glioblastoma growth after chemotherapy. Nature. 2012;488:522–6. - PMC - PubMed
    1. Driessens G, Beck B, Caauwe A, Simons BD, Blanpain C. Defining the mode of tumour growth by clonal analysis. Nature. 2012;488:527–30. - PMC - PubMed
    1. Schepers AG, Snippert HJ, Stange DE, van den Born M, van Es JH, van de Wetering M, Clevers H. Lineage tracing reveals Lgr5+ stem cell activity in mouse intestinal adenomas. Science. 2012;337:730–5. - PubMed
    1. Li C, Heidt DG, Dalerba P, Burant CF, Zhang L, Adsay V, Wicha M, Clarke MF, Simeone DM. Identification of pancreatic cancer stem cells. Cancer Res. 2007;67:1030–7. - PubMed
    1. Rasheed ZA, Yang J, Wang Q, Kowalski J, Freed I, Murter C, Hong SM, Koorstra JB, Rajeshkumar NV, He X, Goggins M, Iacobuzio-Donahue C, Berman DM, Laheru D, Jimeno A, Hidalgo M, Maitra A, Matsui W. Prognostic significance of tumorigenic cells with mesenchymal features in pancreatic adenocarcinoma. J Natl Cancer Inst. 2010;102:340–51. - PMC - PubMed

Publication types

MeSH terms

Substances