

Sparse canonical correlation analysis relates network-level atrophy to multivariate cognitive measures in a neurodegenerative population
- PMID: 24096125
- PMCID: PMC3911786
- DOI: 10.1016/j.neuroimage.2013.09.048
Sparse canonical correlation analysis relates network-level atrophy to multivariate cognitive measures in a neurodegenerative population
Abstract
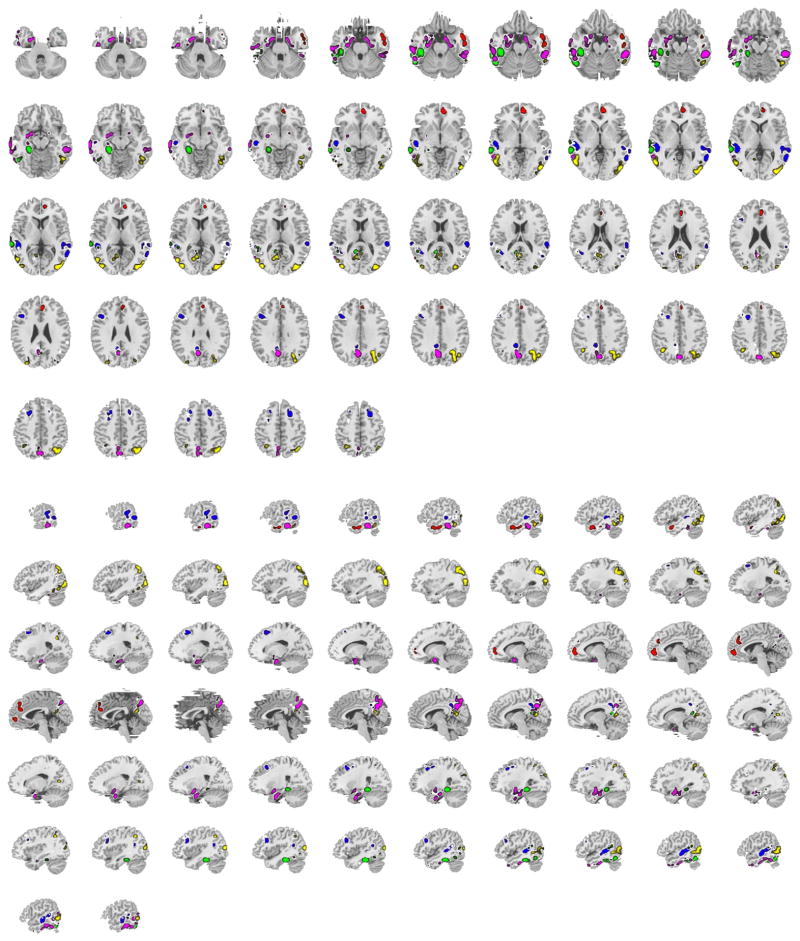
This study establishes that sparse canonical correlation analysis (SCCAN) identifies generalizable, structural MRI-derived cortical networks that relate to five distinct categories of cognition. We obtain multivariate psychometrics from the domain-specific sub-scales of the Philadelphia Brief Assessment of Cognition (PBAC). By using a training and separate testing stage, we find that PBAC-defined cognitive domains of language, visuospatial functioning, episodic memory, executive control, and social functioning correlate with unique and distributed areas of gray matter (GM). In contrast, a parallel univariate framework fails to identify, from the training data, regions that are also significant in the left-out test dataset. The cohort includes164 patients with Alzheimer's disease, behavioral-variant frontotemporal dementia, semantic variant primary progressive aphasia, non-fluent/agrammatic primary progressive aphasia, or corticobasal syndrome. The analysis is implemented with open-source software for which we provide examples in the text. In conclusion, we show that multivariate techniques identify biologically-plausible brain regions supporting specific cognitive domains. The findings are identified in training data and confirmed in test data.
Keywords: Alzheimer disease; Frontotemporal lobar degeneration; MRI; PBAC; Philadelphia Brief Assessment of Cognition; Sparse canonical correlation analysis.
© 2013.
Conflict of interest statement
Drs. Rascovsky and Avants, and Ms. Boller report no disclosures.
Figures


References
-
- Addis Donna Rose, McIntosh Anthony R, Moscovitch Morris, Crawley Adrian P, Pat McAndrews Mary. Characterizing spatial and temporal features of autobiographical memory retrieval networks: a partial least squares approach. Neuroimage. 2004;23(4):1460–1471. http://dx.doi.org/10.1016/j.neuroimage.2004.08.007 (Dec. URL http://dx.doi.org/10.1016/j.neuroimage.2004.08.007) - DOI - DOI - PubMed
-
- Avants BB, Epstein CL, Grossman M, Gee JC. Symmetric diffeomorphic image registration with cross-correlation: evaluating automated labeling of elderly and neurodegenerative brain. Med Image Anal. 2008 Feb;12(1):26–41. http://dx.doi.org/10.1016/j.media.2007.06.004. URL http://dx.doi.org/10.1016/j.media.2007.06.004. - DOI - DOI - PMC - PubMed
-
- Avants Brian B, Yushkevich Paul, Pluta John, Minkoff David, Korczykowski Marc, Detre John, Gee James C. The optimal template effect in hippocampus studies of diseased populations. Neuroimage. 2010b Feb;49(3):2457–2466. http://dx.doi.org/10.1016/j.neuroimage.2009.09.062. URL http://dx.doi.org/10.1016/j.neuroimage.2009.09.062. - DOI - DOI - PMC - PubMed
-
- Avants Brian B, Tustison Nicholas J, Song Gang, Cook Philip A, Klein Arno, Gee James C. A reproducible evaluation of ants similarity metric performance in brain image registration. Neuroimage. 2011a Feb;54(3):2033–2044. http://dx.doi.org/10.1016/j.neuroimage.2010.09.025. URL http://dx.doi.org/10.1016/j.neuroimage.2010.09.025. - DOI - DOI - PMC - PubMed
Publication types
MeSH terms
Grants and funding
- R01 AG015116/AG/NIA NIH HHS/United States
- AG15116/AG/NIA NIH HHS/United States
- AG32953/AG/NIA NIH HHS/United States
- F31 NR013306/NR/NINR NIH HHS/United States
- AG17586/AG/NIA NIH HHS/United States
- NS53488/NS/NINDS NIH HHS/United States
- HD0406/HD/NICHD NIH HHS/United States
- F32 HD060406/HD/NICHD NIH HHS/United States
- F31NR013306/NR/NINR NIH HHS/United States
- R01 HD050199/HD/NICHD NIH HHS/United States
- R01 NS044266/NS/NINDS NIH HHS/United States
- P01 AG032953/AG/NIA NIH HHS/United States
- NS44266/NS/NINDS NIH HHS/United States
- P01 AG017586/AG/NIA NIH HHS/United States
- R01 AG038490/AG/NIA NIH HHS/United States
- P50 NS053488/NS/NINDS NIH HHS/United States
- R01 DC008779/DC/NIDCD NIH HHS/United States
LinkOut - more resources
Full Text Sources
Other Literature Sources
Medical
