. 2013 Nov;15(11):1378-85.
doi: 10.1038/ncb2855. Epub 2013 Oct 6.

The spindle assembly checkpoint works like a rheostat rather than a toggle switch

Affiliations

The spindle assembly checkpoint works like a rheostat rather than a toggle switch

Philippe Collin et al. Nat Cell Biol. 2013 Nov.

Abstract

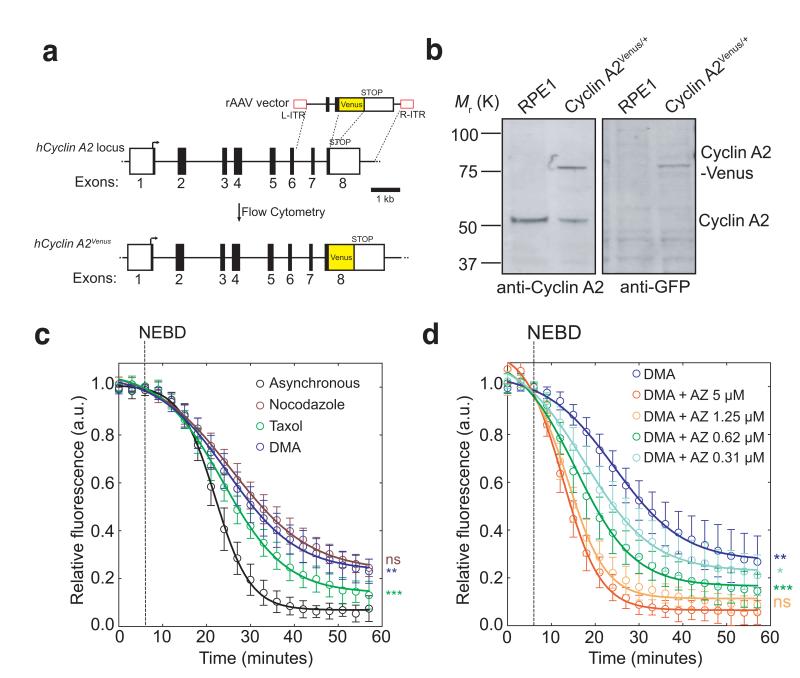
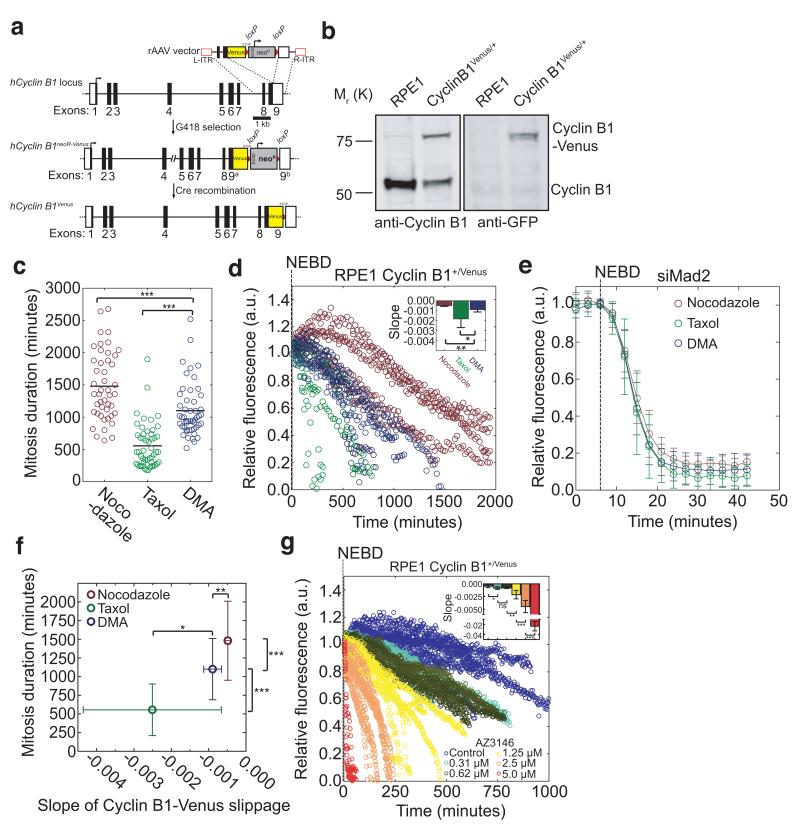
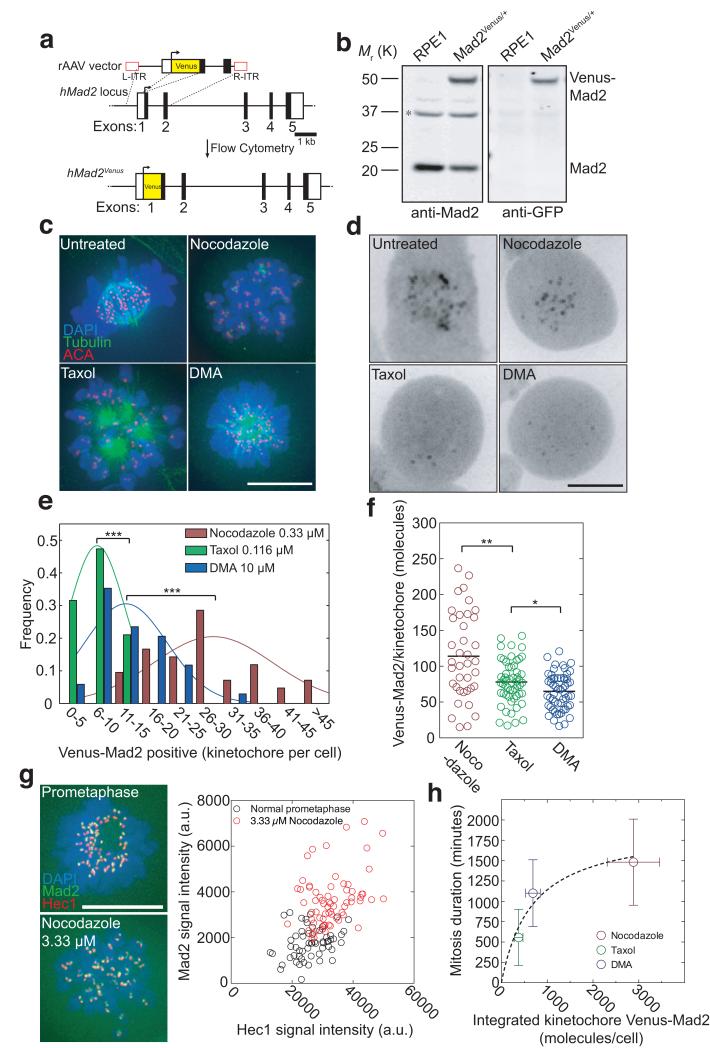
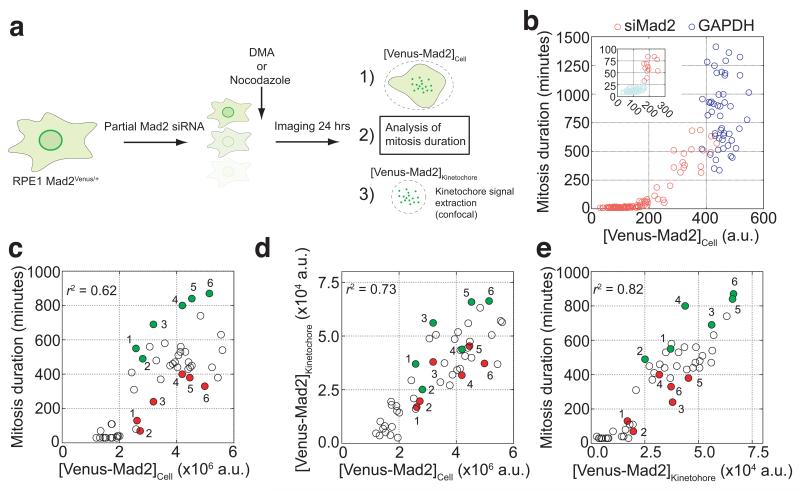
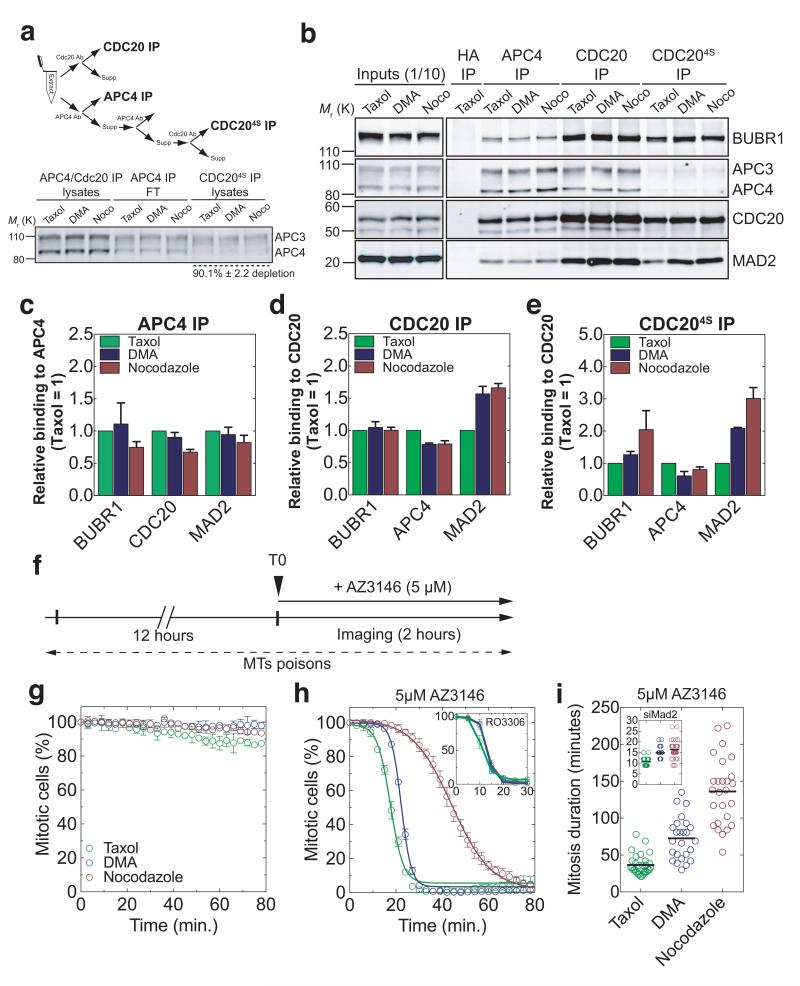
The spindle assembly checkpoint (SAC) is essential in mammalian mitosis to ensure the equal segregation of sister chromatids. The SAC generates a mitotic checkpoint complex (MCC) to prevent the anaphase-promoting complex/cyclosome (APC/C) from targeting key mitotic regulators for destruction until all of the chromosomes have attached to the mitotic apparatus. A single unattached kinetochore can delay anaphase for several hours, but how it is able to block the APC/C throughout the cell is not understood. Present concepts of the SAC posit that either it exhibits an all-or-nothing response or there is a minimum threshold sufficient to block the APC/C (ref. 7). Here, we have used gene targeting to measure SAC activity, and find that it does not have an all-or-nothing response. Instead, the strength of the SAC depends on the amount of MAD2 recruited to kinetochores and on the amount of MCC formed. Furthermore, we show that different drugs activate the SAC to different extents, which may be relevant to their efficacy in chemotherapy.


Figures

Fig. 1
Fig. 1. Cyclin A2-Venus degradation as a readout of SAC activity.
(a), Venus ORF targeting into the hCCNA2 locus by rAAV-mediated homologous recombination. The rAAV vector contains the coding sequence of Venus, which was inserted between two gene-specific homology arms to replace the STOP codon at the junction between non-coding (white square) and coding (black square) regions in exon 8 and two inverted terminal repeats (L-ITR, R-ITR; red rectangles). Integrants were selected by fluorescence-activated cell sorting (FACS). (b), Western blot analysis of parental RPE1 and a Cyclin A2-Venus clone. Cell lysates were probed with anti-Cyclin A2 (left panel) and anti-GFP (right panel) antibodies. Note the two forms of Cyclin A2 in the Cyclin A2-Venus clone (the upper one uniquely recognized by the anti-GFP antibody). Molecular mass markers on the left. (c-d), Single-cell Cyclin A2-Venus destruction assays of asynchronously growing RPE1 Cyclin A2-Venus cells treated with nocodazole (n=15 cells), Taxol (n=12 cells) or DMA (n=12 cells) c) or different concentrations of AZ3146 in presence of 10 μM DMA (n=15 cells for all conditions except 5 μM AZ3146 where n= 11 cells) d). Images were acquired at 3-5 min intervals and the total cell fluorescence was quantified. Fluorescence intensities were normalized to the level at nuclear envelope breakdown (NEBD). Error bars indicate s.d. and are representative of at least two independent experiments. The time to reach half-maximum fluorescence after NEBD was used for statistical tests.
Fig. 2
Fig. 2. Different spindle poisons activate the SAC to different extents
(a) Venus ORF targeting into the hCCNB1 locus by rAAV-mediated homologous recombination. The rAAV vector contains both the coding sequence of Venus and a G418 resistance cassette (flanked by loxP sites, red triangles), which were inserted between two gene-specific homology arms to replace the STOP codon at the junction between non-coding (white square) and coding (black square) regions in exon 9 and two inverted terminal repeats (L-ITR, R-ITR; red rectangles). Integrants were selected by survival in G418-containing medium. (b) Western blot analysis of parental RPE1 and a Cyclin B1-Venus clone. Cell lysates were probed with anti-Cyclin B1 (left panel) and anti-GFP (right panel) antibodies. Note the two forms of Cyclin B1 in the Cyclin B1-Venus clone (the upper one uniquely recognized by the anti-GFP antibody). Molecular mass markers on the left. (c) Scatter plot displaying the duration of the mitotic arrest of RPE1 Cyclin B1-Venus cells treated with the same drugs as in Fig. 1c) (n=50 in each condition). (d) Single-cell analysis of mitotic slippage in asynchronously growing RPE1 Cyclin B1-Venus cells treated with nocodazole (n=5 cells), Taxol (n=6 cells) or DMA (n=5 cells). Images were acquired at 5 min intervals and quantified, plotted and analysed as in Fig 1c. The inset shows the slopes of the linear regressions in the main panel. Error bars indicate s.d. and are representative of at least two independent experiments. (e) Single-cell analysis of asynchronously growing RPE1 Cyclin B1-Venus cells treated with siRNA against Mad2 in presence of nocodazole (n=6 cells), Taxol (n=13 cells) or DMA (n=16 cells). Note that only cells with mitosis durations of 9-12 minutes (minimum mitosis duration in RPE1 cells) were considered. Error bars indicate s.d. and are representative of at least two independent experiments. (f) Effect of the rate of Cyclin B1-Venus slippage in d) on the duration of mitosis in different drug treatments in c). Error bars indicate s.d. and are representative of at least two independent experiments. (g) Single-cell analysis of mitotic slippage in asynchronously growing RPE1 Cyclin B1-Venus cells treated with nocodazole (n=7 cells) and increasing AZ3146 concentrations (n=5 cells for 0.31 μM; n=6 cells for 0.62 μM; n=6 cells for 1.25 μM, n=9 cells for 2.5 μM and n=7 cells for 5 μM). Images were acquired at 5 min intervals and total fluorescence was quantified. Fluorescence intensities were normalised to the level at NEBD. The insets show the slopes of the linear regressions in the respective main panel. Error bars indicate s.d. and are representative of two independent experiments.
Fig. 3
Fig. 3. The amount of Mad2-positive kinetochores correlates with the length of a mitotic block
(a) Venus ORF targeting into the hMAD2L1 locus by rAAV-mediated homologous recombination. The rAAV vector contained the coding sequence of Venus, which was inserted between two gene-specific homology arms to replace the ATG at the junction between non-coding (white square) and coding (black square) regions of exon 1 and two inverted terminal repeats (L-ITR, R-ITR; red rectangles). Integrants were selected by FACS. (b) Western blot analysis of parental RPE1 and a Venus-Mad2 clone. Cell lysates were probed with anti-Mad2 (left panel) and anti-GFP (right panel) antibodies. The asterisk indicates a cross-reacting band. Note the two forms of Mad2 in the Venus-Mad2 clone (the upper one uniquely recognized by the anti-GFP antibody). Molecular mass markers on the left. (c) Asynchronous RPE1 cells were treated for 12-16 hours with nocodazole, or Taxol or DMA, fixed with methanol and processed for immunofluorescence using anti-beta-tubulin (green) and ACA antibodies to stain the kinetochores (red). DNA was stained using DAPI (blue). Merged images are presented. Representative of 20-50 cells from at least two independent experiments. (d) Typical localization of Venus-Mad2 in living mitotic cells treated with different spindle poisons as in c). (e) Distribution of Venus-Mad2-positive kinetochores per cell following 12-16 hours of treatment with different drugs (n=42 cells for nocodazole; n=38 cells for Taxol and n=34 cells for DMA), representative of at least two independent experiments. (f) Scatter plots obtained by fluorescence correlation using data shown in Supplementary Fig. 4 of the number of Venus-Mad2 molecules per kinetochore in cells treated with different drugs (n=57 kinetochores from 8 cells for nocodazole; n=38 kinetochores from 11 cells for Taxol and n=55 kinetochores from 8 cells for DMA), representative of at least two independent experiments. The black line represents the mean. (g) Asynchronous (top) or 3.33 μM nocodazole-treated (bottom) RPE1 Venus-Mad2 cells were fixed in methanol and processed for immunofluorescence against Hec1 (red), and DNA stained with DAPI (blue). The signal intensity for Hec1, a stable kinetochore component, was used as a measure of kinetochore size. Kinetochore-associated Mad2 signals (green in image) were quantified and plotted as a function of the corresponding Hec1 fluorescence (n=56 kinetochores from 6 cells for asynchronous and n=60 kinetochores from 3 cells for 3.33 μM nocodazole). Data are representative of two independent experiments. (h) Plot of the relationship between the duration of mitosis (from Fig. 2c) and the integrated molecule number of Venus-Mad2 at kinetochores in the different poisons (from Fig. 3e,f). Error bars indicate s.d. and are representative of at least two independent experiments. Scale bars = 10 μm.
Fig. 4
Fig. 4. Reducing the level of Mad2 at kinetochores decreases the strength of the SAC
(a) Schematic representation of experiments and analysis in b-e. RPE1 Mad2Venus/+ cells were subjected to partial siRNA against Mad2 for 24 hours before being imaged in the presence of DMA (10 μM) or nocodazole (0.33 μM). Measurements on total cellular fluorescence and thresholded kinetochore fluorescence were done 10 minutes after NEBD. (b) Graph displaying the duration of mitosis in DMA of each GAPDH (n=50 cells) or siMad2-treated cells (n=100 cells) analysed as a function of the corresponding total cellular fluorescence of Venus-Mad2 ([Venus-Mad2]Cell measured using wide-field microscopy. The inset expands the data points at the apparent threshold of Venus-Mad2, below which the checkpoint does not work (red vs green). Representative of two independent experiments. (c) Graph displaying the duration of mitosis in nocodazole of each cell analysed (n=50 cells) as a function of the corresponding total cellular fluorescence of Venus-Mad2 ([Venus-Mad2]Cell from spinning disk confocal imaging. (d) Graph displaying the relationship between total cellular fluorescence of Venus-Mad2 and integrated kinetochore fluorescence of Venus-Mad2 (n=50 cells). (e) Graph displaying the duration of mitosis of each cell analysed (n=50 cells) as a function of the corresponding integrated kinetochore fluorescence of Venus-Mad2 ([Venus-Mad2]Kinetochore. In panels c-e, cells that have similar total Mad2 levels were assigned matching numbers and the green color highlights the cell in each match that has more Venus-Mad2 at kinetochores, compared to the red cell which has less. Note that in all cases this resulted in different mitotic arrests (green, stronger checkpoint; red, weaker checkpoint. n>50 cells. Representative of two independent experiments.
Fig. 5
Fig. 5. Cdc20 incorporation into the MCC correlates with the strength of the SAC
(a) Isolation of different complexes and Western blot analysis of the different lysates (n=5 extracts for nocodazole; n=4 extracts for Taxol and n=3 extracts for DMA). Error indicate s.e.m. and are representative of at least three independent experiments. (b) Anti-APC4 or anti-CDC20 immunoprecipitates (IP) from extracts of RPE1 cells treated with nocodazole (n=5 extracts), Taxol (n=4 extracts) or DMA (n=3 extracts) and isolated by mitotic shake-off 12-16 hours later. (c-e), The amount of MCC proteins that co-purified with c) APC4 or d-e) CDC20 were analysed by quantitative immunoblotting, normalised to the level in Taxol-treated cells, and displayed as bar graphs. Error bars indicate s.e.m. and are representative of at least three independent experiments. Note that the CDC20 immunoprecipitates in panel b) (last three lanes to the left) and e) were obtained from APC/C-free extracts (in panel a). (f) Schematic of experiments in panels g) and h). (g) Time-course of the percentage of mitotic cells after 12 hours of drug treatment (automatic detection, n>100 cells per condition). Error bars indicate s.d. and are representative of two independent experiments. (h) Same as g) after the addition of AZ3146 (5 μM) (automatic detection, n>100 cells per condition). Inset is the same as g) after addition of RO3306 (10 μM) (automatic detection, n>100 cells per condition). Error bars indicate s.d. and are representative of two independent experiments. (i), Scatter plot displaying the duration of mitosis of RPE1 Cyclin B1-Venus cells treated with AZ3146 (5μM) in the presence of nocodazole (n=26 cells), Taxol (n=30 cells) or DMA (n=25 cells). Inset represents similar conditions except that cells were treated with siRNA against Mad2 (n=28 cells for nocodazole; n=34 cells for Taxol and n=39 cells for DMA). Representative of at least two independent experiments.

Comment in

References

    1. Musacchio A, Salmon ED. The spindle-assembly checkpoint in space and time. Nat Rev Mol Cell Biol. 2007;8:379–393. - PubMed
    1. Lara-Gonzalez P, Westhorpe FG, Taylor SS. The spindle assembly checkpoint. Curr Biol. 2012;22:R966–980. - PubMed
    1. Pines J. Cubism and the cell cycle: the many faces of the APC/C. Nat Rev Mol Cell Biol. 2011;12:427–438. - PubMed
    1. Sudakin V, Chan GK, Yen TJ. Checkpoint inhibition of the APC/C in HeLa cells is mediated by a complex of BUBR1, BUB3, CDC20, and MAD2. J Cell Biol. 2001;154:925–936. - PMC - PubMed
    1. Rieder CL, Cole RW, Khodjakov A, Sluder G. The checkpoint delaying anaphase in response to chromosome monoorientation is mediated by an inhibitory signal produced by unattached kinetochores. J Cell Biol. 1995;130:941–948. - PMC - PubMed

Publication types

Substances