. 2013 Nov;15(11):1370-7.
doi: 10.1038/ncb2842. Epub 2013 Oct 6.

Kinetic framework of spindle assembly checkpoint signalling

Affiliations

Kinetic framework of spindle assembly checkpoint signalling

Amalie E Dick et al. Nat Cell Biol. 2013 Nov.

Abstract

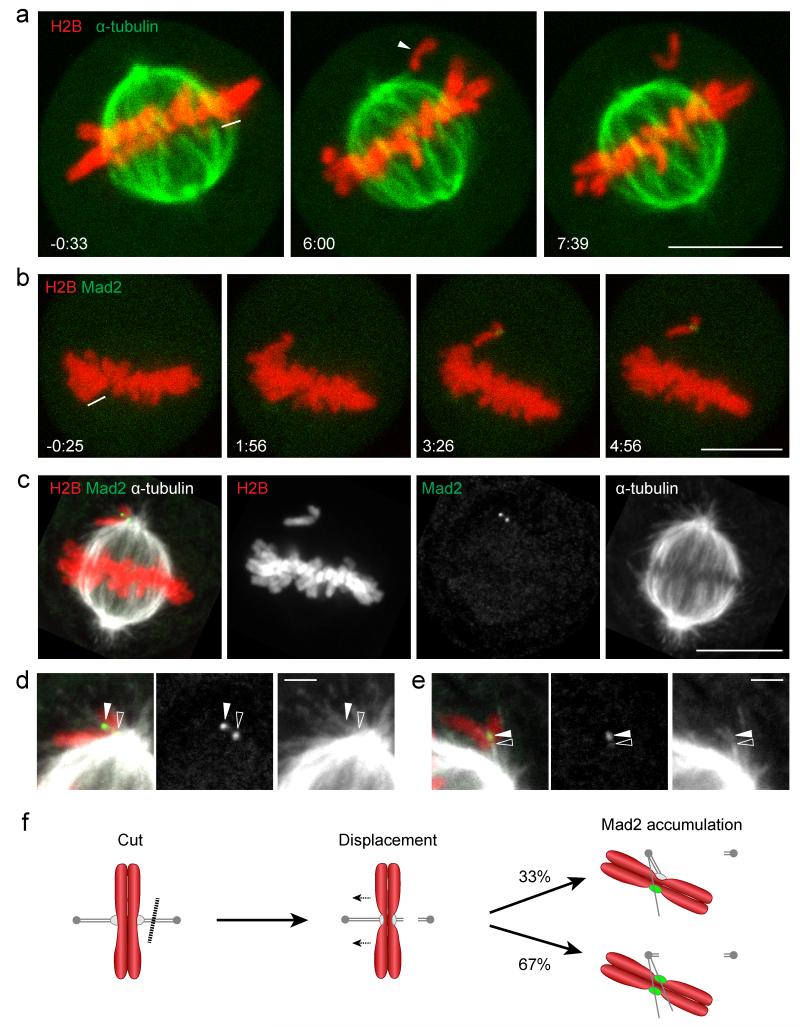
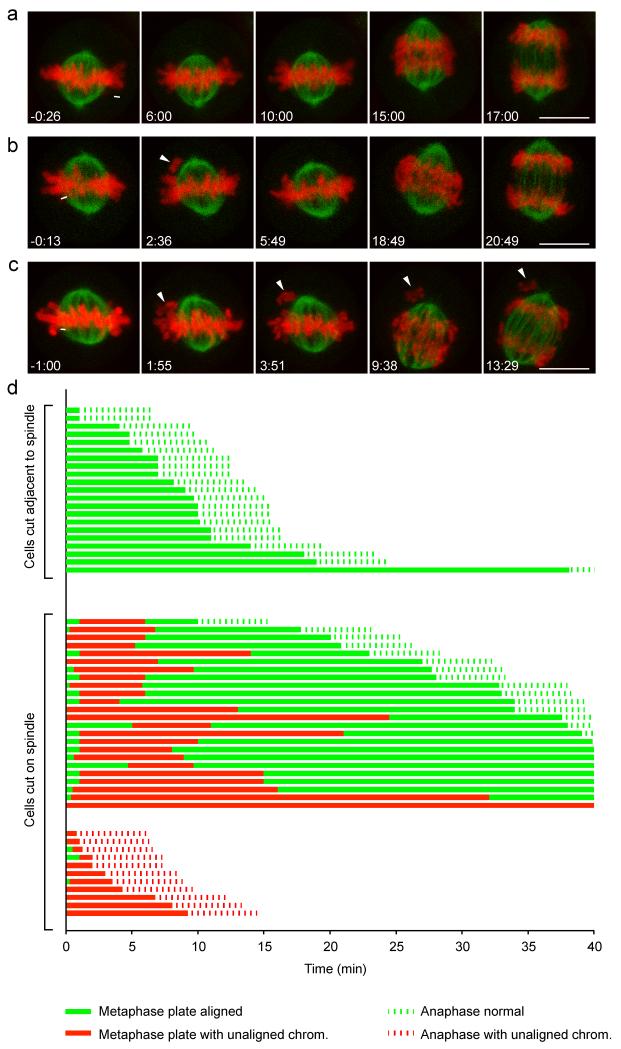
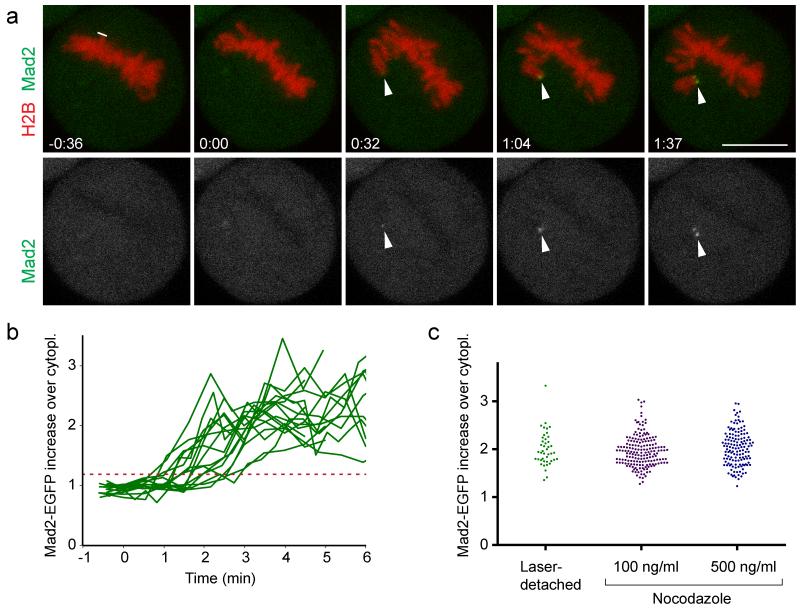
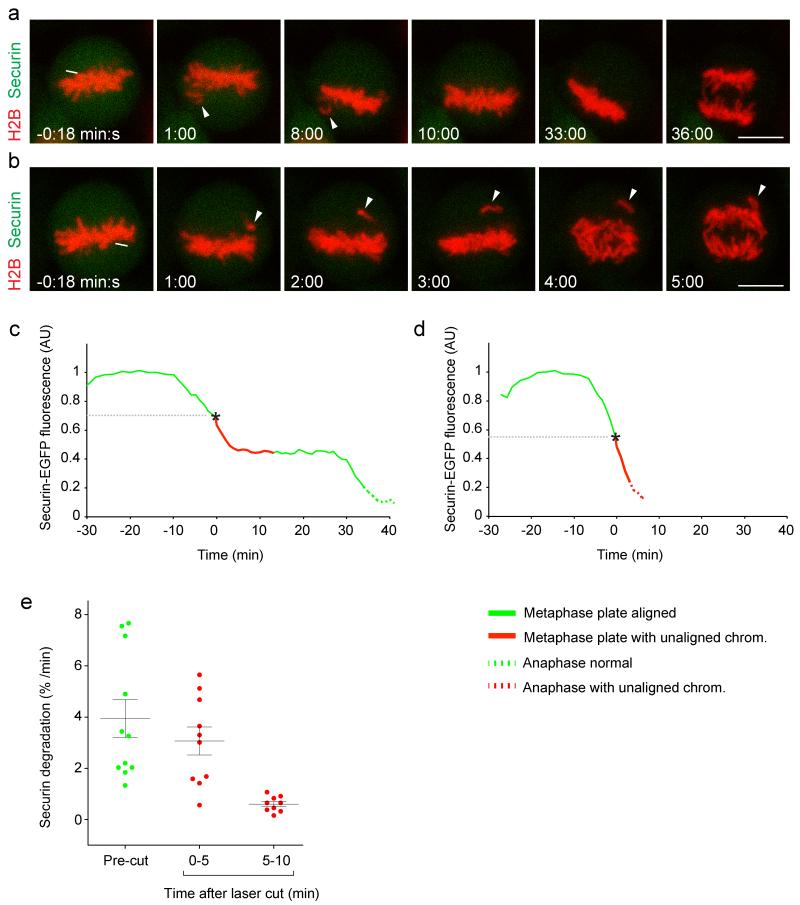
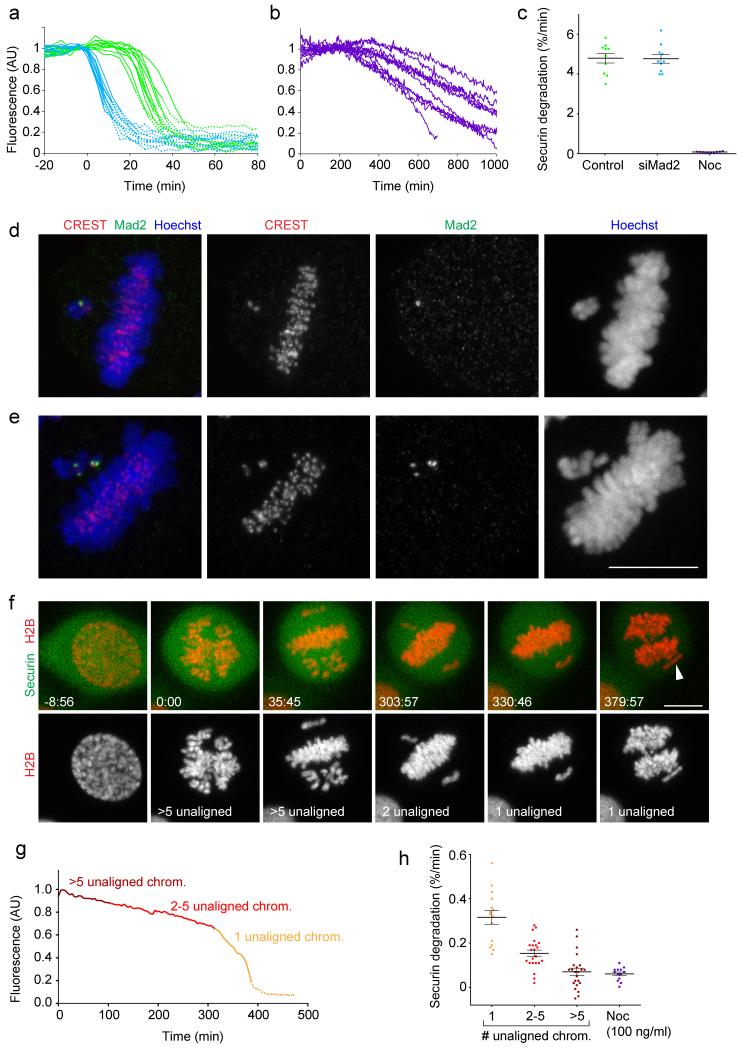
The mitotic spindle assembly checkpoint (SAC) delays anaphase onset until all chromosomes have attached to both spindle poles. Here, we investigated SAC signalling kinetics in response to acute detachment of individual chromosomes using laser microsurgery. Most detached chromosomes delayed anaphase until they had realigned to the metaphase plate. A substantial fraction of cells, however, entered anaphase in the presence of unaligned chromosomes. We identify two mechanisms by which cells can bypass the SAC: first, single unattached chromosomes inhibit the anaphase-promoting complex/cyclosome (APC/C) less efficiently than a full complement of unattached chromosomes; second, because of the relatively slow kinetics of re-imposing APC/C inhibition during metaphase, cells were unresponsive to chromosome detachment up to several minutes before anaphase onset. Our study defines when cells irreversibly commit to enter anaphase and shows that the SAC signal strength correlates with the number of unattached chromosomes. Detailed knowledge about SAC signalling kinetics is important for understanding the emergence of aneuploidy and the response of cancer cells to chemotherapeutics targeting the mitotic spindle.


Figures

Figure 1
Figure 1. Laser microsurgery of kinetochore fibers induces Mad2 accumulation on individual displaced chromosomes
(a) A live metaphase HeLa cell expressing H2B-mCherry and mEGFP-α-tubulin was imaged by 3D-confocal live-cell microscopy. Kinetochore fiber microtubules were cut with a pulsed 915 nm laser at the area indicated by the white line. The arrowhead indicates a single unaligned chromosome. (b-e) Correlative laser microsurgery, time-lapse imaging, and immunofluorescence staining of the spindle. (b) A live metaphase HeLa cell expressing H2B-mCherry and Mad2-EGFP was cut with a pulsed 915 nm laser at the area indicated by the white line, and imaged by 3D-confocal live-cell microscopy. (c) The cell shown in (b) was fixed 6 min after laser microsurgery and stained for α-tubulin. (d) Enlarged region of (c) with linearly increased contrast to enhance visualization of astral microtubules. This reveals lateral microtubule association of a Mad2-positive kinetochore (closed arrowhead), and its sister kinetochore (open arrowhead) localizing to the edge of the spindle. (e) Example for unaligned chromosome with single Mad2 accumulation site (solid arrowhead), 2:20 min:s after laser microsurgery (see Supplementary Fig. S1d, e for time-lapse images and overview of cell). The contrast was linearly increased to visualize astral microtubules. Open arrowhead indicates end-on attachment of a microtubule bundle at a chromosome region opposite of the Mad2-positive kinetochore. (f) Schematic overview of the laser microsurgery assay. Chromosomes (red), microtubules, kinetochores (gray), and Mad2 (green). Dashed line indicates laser microsurgery. Time = 0:00 min:s at the first image acquired immediately after laser microsurgery. Bars: 10 μm (a-c); 2 μm (d, e).
Figure 2
Figure 2. Fate of cells after laser-induced chromosome detachment
HeLa cells expressing H2B-mCherry and mEGFP-α-tubulin were imaged for 40 min by 3D-confocal live-cell microscopy and cut with a pulsed 915 nm laser at the area indicated by the white lines. Time = 0:00 min:s at the first image acquired immediately after laser microsurgery. (a) A representative control cell was cut in a region adjacent to the spindle so that no chromosome was detached. (b) A representative cell in which a single chromosome was detached from the mitotic spindle by laser microsurgery. The arrowhead indicates the detached chromosome (2:36), which subsequently recongresses to the metaphase plate (5:49). (c) As in (b), but this cell enters anaphase in the presence of an unaligned chromosome (arrowheads). Bars: 10 μm. (d) Fate trajectories of 56 cells cut by laser microsurgery. 21 control cells were cut as in (a), and 35 cells were cut as in (b, c).
Figure 3
Figure 3. SAC response kinetics after laser microsurgery
(a) A live metaphase HeLa cell expressing H2B-mCherry and Mad2-EGFP was imaged by 3D-confocal live-cell microscopy and cut with a pulsed 915 nm laser at the area indicated by the white line. Arrowheads indicate site of Mad2-EGFP accumulations on the displaced chromosome. Time = 0:00 min:s at the first image acquired immediately after laser microsurgery. Bar: 10 μm. (b) Kinetics of Mad2-EGFP enrichment on detached chromosomes, measured in a circular region with a diameter of 1.2 μm (n = 16 cells). Each curve represents the sister kinetochore with the first Mad2-EGFP accumulation. Red dashed line indicates 3 s.d. above the mean Mad2-EGFP fluorescence on chromosomes before cutting, which served as threshold to detect the onset of Mad2-EGFP accumulation. (c) Peak levels of Mad2-EGFP were measured at 4:30 - 5:00 min:s after laser microsurgery, or after spindle depolymerization by nocodazole. Each dot represents one kinetochore.
Figure 4
Figure 4. Kinetics of APC/C inhibition after laser microsurgery
HeLa cells expressing H2B-mCherry and securin-mEGFP were imaged by 3D-confocal microscopy from prophase until metaphase. At different time points during metaphase, the spindle was cut by a pulsed 915 nm laser as indicated by the white line. Time = 0:00 min:s at the first image acquired immediately after laser microsurgery. (a) A representative cell in which a detached chromosome (arrowheads) recongressed to the metaphase plate before anaphase entry. (b) A cell that enters anaphase in presence of an unaligned chromosome (arrowheads). Bars: 10 μm. (c, d) Securin-mEGFP degradation kinetics, normalized to metaphase onset, for the cells shown in (a) or (b), respectively. (e) Securin degradation rate was determined by linear interpolation in 11 cells, either before or at different time intervals after laser microsurgery. Error bars indicate mean ± s.e.m.
Figure 5
Figure 5. The inhibitory strength of the SAC correlates with the number of unaligned chromosomes
(a) Securin-mEGFP degradation rates peak briefly before anaphase onset. HeLa cells expressing H2B-mCherry and securin-mEGFP were transfected with non-targeting siRNA (control, green curves), or with siRNA targeting Mad2 (blue), and imaged live 24 h after transfection. Total securin-mEGFP fluorescence was measured in individual cells (n = 10 per condition). Time = 0 min at prometaphase onset. Solid lines indicate pre-anaphase stages; dashed lines indicate post-anaphase stages. (b) Securin-mEGFP degradation was measured as in (a) in cells treated with 100 ng/ml nocodazole. (c) Securin-mEGFP degradation rates for cells shown in (a, b) were determined by linear regression. Each dot represents one cell. (d, e) Low concentrations of nocodazole selectively induce Mad2 accumulation on unaligned chromosomes. Cells treated for 3-5 h with 25 ng/ml nocodazole were fixed and stained with anti-Mad2 and CREST antibodies (n = 34 cells). (d) Cell with a single unaligned chromosome that accumulated Mad2 on a single sister kinetochore. (e) Cell with two unaligned chromosomes, which each accumulated Mad2 on both sister kinetochores. (f) A HeLa cell expressing H2B-mCherry and securin-mEGFP was imaged by 3D-confocal microscopy in presence of 12 ng/ml nocodazole. Arrowhead indicates a single unaligned chromosome during anaphase. Time = 0:00 min:s at prometaphase onset. (g) Total securin-mEGFP was measured as in (a) for the cell shown in (f). Dashed line indicates post-anaphase stages. See Supplementary Fig. S5 for four more examples and raw measurements. (h) Securin-mEGFP degradation was measured in 26 cells treated with 6, 12 or 25 ng/ml nocodazole, using linear regression at different time intervals (each dot represents one measurement that relates to a specific number of unaligned chromosomes, as illustrated in (g)). 13 control cells were treated with 100 ng/ml nocodazole. Error bars indicate mean ± s.e.m. Bars: 10 μm.

Comment in

References

    1. Musacchio A, Salmon ED. The spindle-assembly checkpoint in space and time. Nat Rev Mol Cell Biol. 2007;8:379–393. - PubMed
    1. Lara-Gonzalez P, Westhorpe FG, Taylor SS. The spindle assembly checkpoint. Curr Biol. 2012;22:R966–980. - PubMed
    1. Kitajima TS, Ohsugi M, Ellenberg J. Complete kinetochore tracking reveals error-prone homologous chromosome biorientation in mammalian oocytes. Cell. 2011;146:568–581. - PubMed
    1. Magidson V, et al. The spatial arrangement of chromosomes during prometaphase facilitates spindle assembly. Cell. 2011;146:555–567. - PMC - PubMed
    1. Lampson MA, Cheeseman IM. Sensing centromere tension: Aurora B and the regulation of kinetochore function. Trends Cell Biol. 2011;21:133–140. - PMC - PubMed

Publication types

LinkOut - more resources