. 2013:4:2550.
doi: 10.1038/ncomms3550.

Imaging energy status in live cells with a fluorescent biosensor of the intracellular ATP-to-ADP ratio

Affiliations

Imaging energy status in live cells with a fluorescent biosensor of the intracellular ATP-to-ADP ratio

Mathew Tantama et al. Nat Commun. 2013.

Abstract

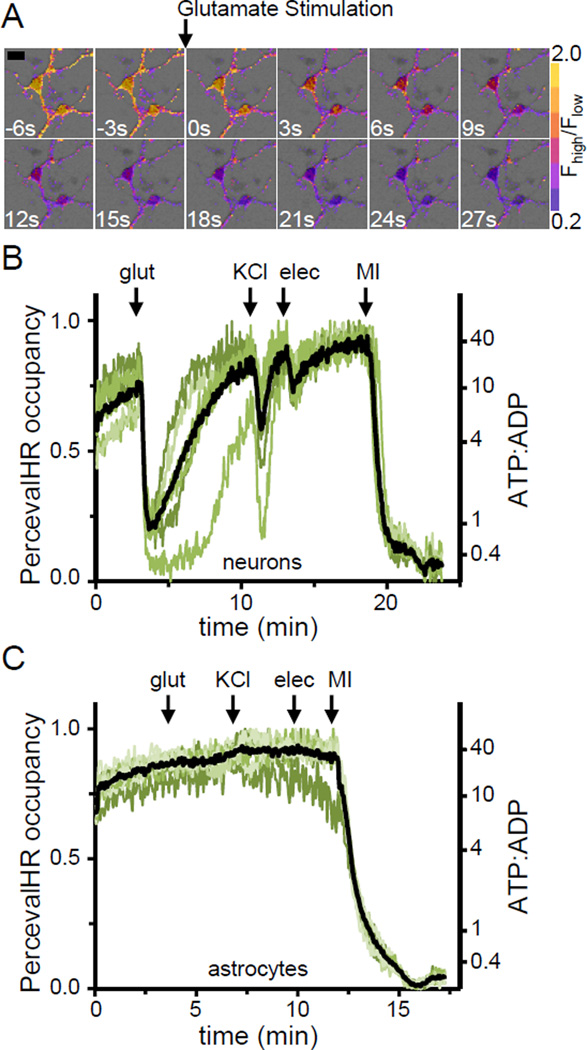
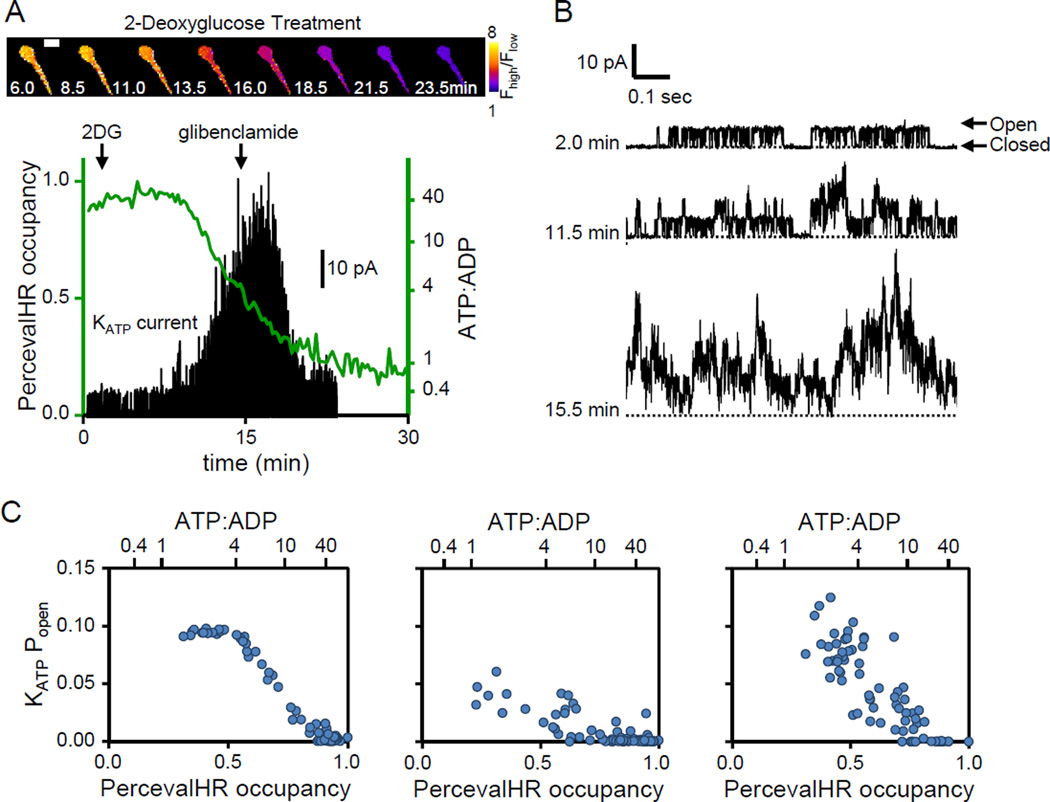
The ATP:ADP ratio is a critical parameter of cellular energy status that regulates many metabolic activities. Here we report an optimized genetically encoded fluorescent biosensor, PercevalHR, that senses the ATP:ADP ratio. PercevalHR is tuned to the range of intracellular ATP:ADP expected in mammalian cells, and it can be used with one- or two-photon microscopy in live samples. We use PercevalHR to visualize activity-dependent changes in ATP:ADP when neurons are exposed to multiple stimuli, demonstrating that it is a sensitive reporter of physiological changes in energy consumption and production. We also use PercevalHR to visualize intracellular ATP:ADP while simultaneously recording currents from ATP-sensitive potassium (KATP) channels in single cells, showing that PercevalHR enables the study of coordinated variation in ATP:ADP and KATP channel open probability in intact cells. With its ability to monitor changes in cellular energetics within seconds, PercevalHR should be a versatile tool for metabolic research.


Figures

Figure 1
Figure 1. PercevalHR sensor characterization
(A) Fluorescence excitation and emission spectra. Excitation spectra from blue to red indicate increasing ATP:ADP and correspond to the colored data points in (B). (B) ATP:ADP dose-response of PercevalHR with Hill fit (green): KR = 3.5 ± 0.2; nH = 0.97 ± 0.04 (N=6). Scaled original Perceval response for comparison (gray) . Dose-response curves and kinetics were obtained in constant 0.5 mM free Mg2+ obtained by adjusting the total MgCl2 concentration for the different nucleotide concentrations. See also Supplementary Fig. S2 for detailed characterization of Mg2+-dependence. (C) Diagram of PercevalHR ATP:ADP sensing. (D) Binding curves for MgATP (red: Kapp = 3.4 ± 0.2 µM; nH = 1.2 ± 0.2; N=6; [MgATP] calculated) and ADP in the presence of EDTA (blue: Kapp = 1.1 ± 0.2 µM; nH = 1.0 ± 0.1; N=6). Expected range of cytosolic [ATP] and [ADP] is indicated . (E) Apparent off rates for MgATP (red: τ= 2.1 ± 0.2 sec; N=3) and ADP (blue: τ = 1.5 ± 0.1 sec; N=3). Data are mean ± s.e.m.
Figure 2
Figure 2. PercevalHR reports changes in ATP:ADP in neurons
Cultured mouse embryonic cortical neurons imaged at 32 ± 1°C in glucose containing solution were metabolically inhibited with 1 µM rotenone and 2.5 µM oligomycin. (A) Representative overlay images of two neurons. Background grayscale images show morphology. Foreground pseudocolored soma show the change in PercevalHR signal, reporting a decrease in ATP:ADP. Scale bar, 20 µm. (B) A representative experiment showing the time course of the PercevalHR ratiometric signal (Fhigh/Fiso) for individual neurons (gray, control, 17 cells; red, inhibitors, 20 cells; arrow, addition of vehicle control or inhibitors). Baseline signals and signal changes with metabolic inhibition are reproducible across cells. (C) The signal change of PercevalHR does not vary with expression level. The fluorescence intensity with excitation at the isosbestic point (x-axis, Fiso) is proportional to expression level. The signal change (y-axis) is the final PercevalHR ratiometric signal divided by the initial baseline signal. Data points in (C) correspond to the responses of individual cells shown in (B). (D) Subsequent to imaging, the same neurons in (A – C) were lysed, and the ATP:ADP was determined using a standard luciferase-based biochemical assay, verifying that ATP:ADP decreased for metabolically inhibited neuron cultures (n=3; mean ± s.e.m.).
Figure 3
Figure 3. Astrocyte ATP:ADP is coupled to extracellular glucose
(A) An astrocyte co-expressing PercevalHR and pHRed imaged at elevated temperature (31 – 34°C). Image sequence shows the change in PercevalHR fluorescence ratio when [glucose] was lowered from 5 to 0.1 mM. Scale bar, 50 µm. (B) PercevalHR signal over time. Initial [glucose] was 25 mM, lowered to 5 mM, then lowered to 0.1 mM three times in sequence. Bath pH was varied from 6.8 to 7.8 for the pH calibration step following [glucose] changes. Rotenone, oligomycin, and IAA were used at 1 µM, 2.5 µM, and 1 mM, respectively. Vertical hash marks indicate approximate times for the images in (A). (C) pHRed fluorescence ratio (left axis). An absolute pH calibration was not necessary, but pH was estimated from in vitro data and shown for convenience only (right axis). Inset: From the pH calibration step, the empirical relationship between the PercevalHR signal and the pHRed signal shows a linear correlation describing the pH sensitivity of PercevalHR, which is used to approximately correct for pH bias. (D) PercevalHR sensor occupancy after approximate removal of pH bias (left axis) and the estimated ATP:ADP ratio (right axis). See also Supplementary Fig. S4. (E) Individual responses (after removal of pH bias) of four other astrocytes. Manipulations of [glucose] and pHbath as well as application of inhibitors was the same as described in (D).
Figure 4
Figure 4. Activity-dependent changes in neuronal ATP:ADP
(A) Cultured dentate granule neurons co-expressing PercevalHR and pHRed in a representative experiment conducted at elevated temperature (31 – 34°C). Image sequence visualizes the change in PercevalHR fluorescence ratio with glutamate application. Scale bar, 20 µm. (B) Stimulation with 50 µM glutamate (glut), 15 mM KCl, or field electrodes (elec; 20Hz, 250 pulses) causes reversible decreases in ATP:ADP ratio. Metabolic inhibitors (MI: 1 mM IAA, 1µM rotenone, 2.5 µM oligomycin) were added at the end of the experiment, and the pH calibration step was subsequently performed. Each green trace represents one neuron, the black trace represents the mean response (N=7 neurons in one representative experiment of 6). (C) Cultured astrocytes do not respond to the same stimuli (N=11 astrocytes).
Figure 5
Figure 5. Direct correlation of ATP:ADP and KATP single-channel activity in intact cells metabolically inhibited with 2-deoxyglucose
HEK293 cells expressing KATP channels were recorded in 5 mM glucose at room temperature and then metabolically inhibited by the replacement of glucose with 10 mM 2DG. (A) Top image sequence visualizes the decrease in PercevalHR ratiometric signal with 2DG treatment for a single cell. Scale bar, 10 µm. Bottom panel shows that metabolic inhibition causes a decrease in ATP:ADP (green trace, y-axes) and a concomitant increase in KATP single-channel activity (black trace) for this cell. Channel activity was characteristic of KATP channels and was inhibited by 200 nM glibenclamide . (B) Examples of increasing single-channel activity. (C) KATP single-channel open probability (Popen) versus PercevalHR occupancy shows that Popen begins to increase when ATP:ADP is ≥ 5. Left panel shows data from the same cell analyzed in (A). Middle and right panels show data acquired from two other cells. See also Supplementary Fig. S5.
Figure 6
Figure 6. Direct correlation of ATP:ADP and KATP single-channel activity in intact cells metabolically inhibited with iodoacetic acid
HEK293 cells expressing KATP channels were recorded in 5 mM glucose at room temperature and then metabolically inhibited by supplementing with 1 mM IAA. (A) Top image sequence visualizes the decrease in PercevalHR ratiometric signal with IAA treatment for a single cell. Scale bar, 10 µm. Bottom panel shows that metabolic inhibition causes a decrease in ATP:ADP (green trace, y-axes) and a concomitant increase in KATP single-channel activity (black trace) for this cell. Channel activity was characteristic of KATP channels and was inhibited by 200 nM glibenclamide . (B) Examples of increasing single-channel activity. (C) KATP single-channel open probability (Popen) versus PercevalHR occupancy shows that Popen begins to increase when ATP:ADP is ≥ 5. Left panel shows data from the same cell analyzed in (A). Middle and right panels show data acquired from two other cells. See also Supplementary Fig. S6.
Figure 7
Figure 7. Ratiometric imaging of PercevalHR with two-photon excitation
(A) Two-photon absorption cross section (σ2p) of PercevalHR protein (squares; left and bottom axes). One-photon absorption spectra (ε1p) shown for reference (dotted lines; right and top axes). ADP-loaded in the presence of EDTA (blue) and MgATP-loaded in the presence of excess Mg2+ (red). (B) HEK293 cells co-expressing PercevalHR (bottom) and pHRed (top) were imaged in 5 mM glucose at room temperature. Scale bar, 20 µm. Left, fluorescence intensity images with two-photon excitation. Middle, high ATP:ADP state. Middle bottom, PercevalHR ratio with two-photon excitation at 950 nm and 840 nm. Middle top, pHRed lifetime with 840 nm two-photon excitation. Right, after metabolic inhibition with 1 mM IAA. (C) PercevalHR, pHRed, and pH-corrected PercevalHR occupancy show that inhibition of glycolysis with IAA causes a large decrease in ATP:ADP ratio. Traces in (C) correspond to the five cells shown in (B).

References

    1. Veech RL, Lawson JW, Cornell NW, Krebs HA. Cytosolic phosphorylation potential. J. Biol. Chem. 1979;254:6538–6547. - PubMed
    1. Gabriel JL, Zervos PR, Plaut GWE. Activity of purified NAD-specific isocitrate dehydrogenase at modulator and substrate concentrations approximating conditions in mitochondria. Metabolism. 1986;35:661–667. - PubMed
    1. Metallo CM, Vander Heiden MG. Understanding metabolic regulation and its influence on cellular physiology. Mol. Cell. 2013;49:388–398. - PMC - PubMed
    1. Yuan H-X, Xiong Y, Guan K-L. Nutrient sensing, metabolism, and cell growth control. Mol. Cell. 2013;49:379–387. - PMC - PubMed
    1. Carling D, Mayer FV, Sanders MJ, Gamblin SJ. AMP-activated protein kinase: nature's energy sensor. Nat. Chem. Biol. 2011;7:512–518. - PubMed

Publication types

MeSH terms