. 2014 Jan;21(1):113-23.
doi: 10.1038/cdd.2013.137. Epub 2013 Oct 4.

Proline oxidase-adipose triglyceride lipase pathway restrains adipose cell death and tissue inflammation

Affiliations

Proline oxidase-adipose triglyceride lipase pathway restrains adipose cell death and tissue inflammation

D Lettieri Barbato et al. Cell Death Differ. 2014 Jan.

Abstract

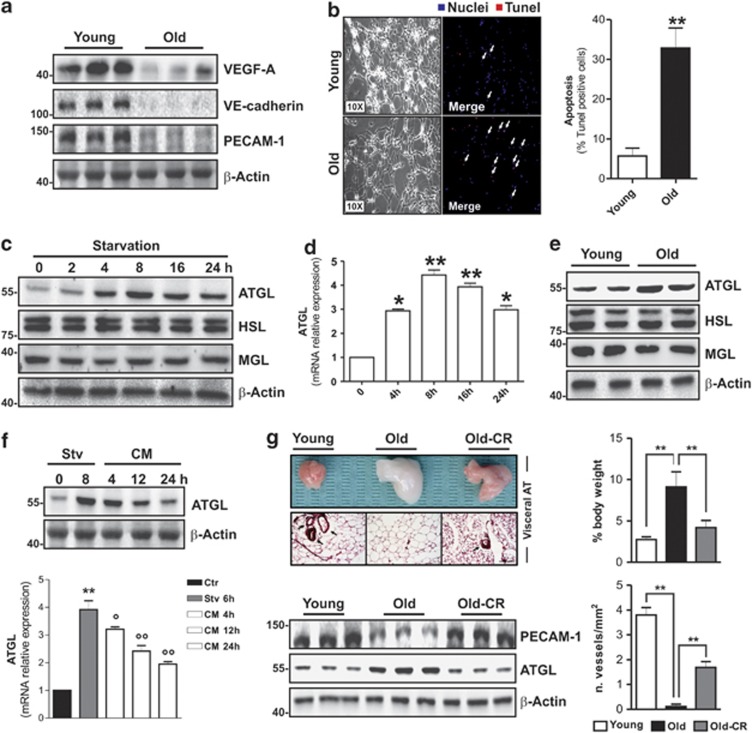
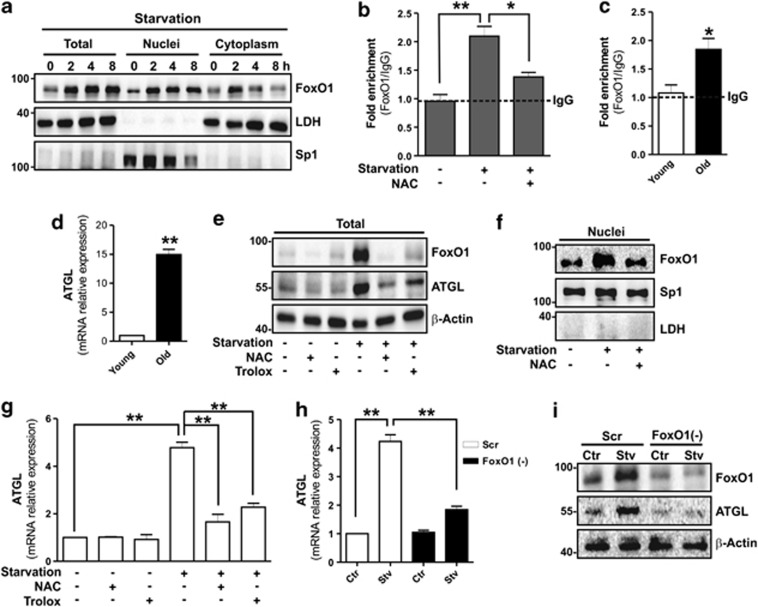
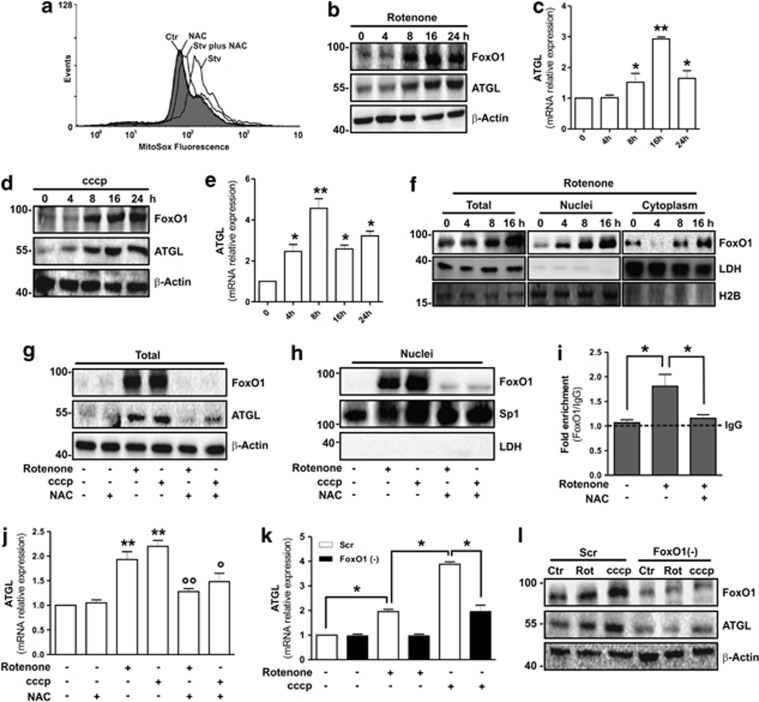
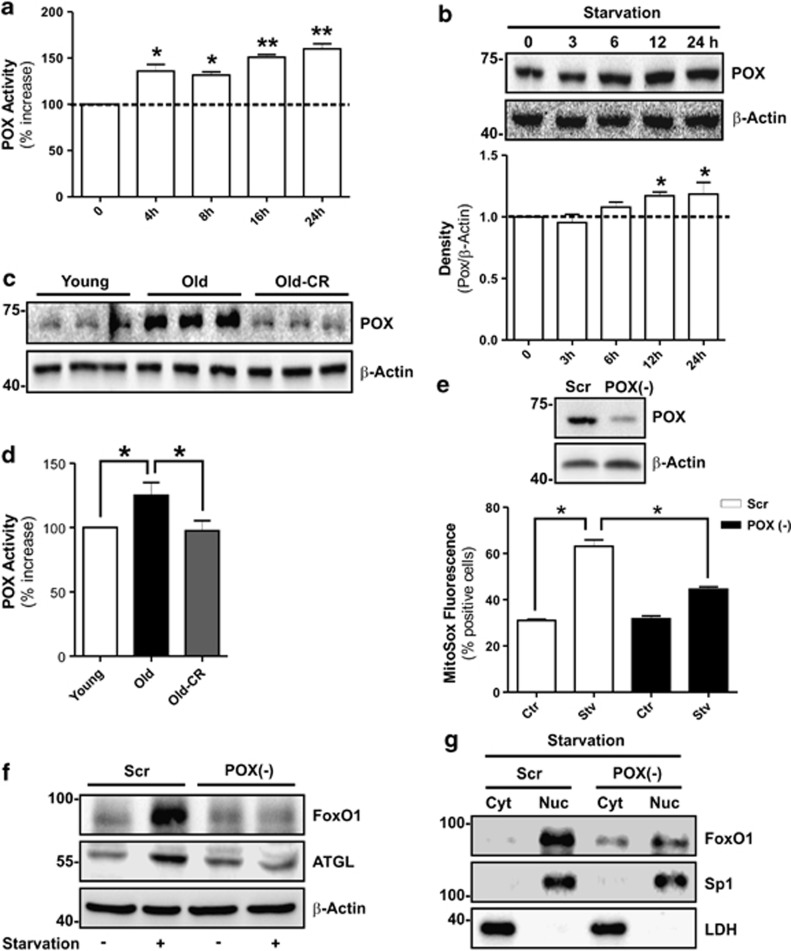
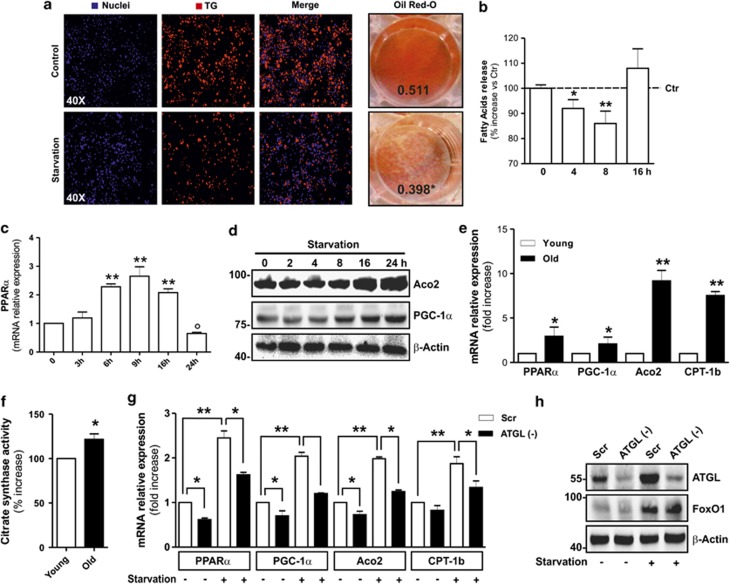
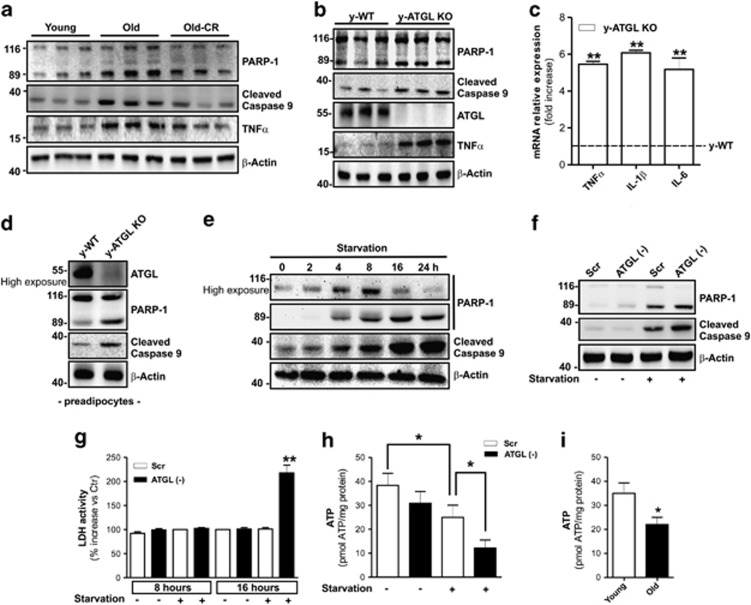
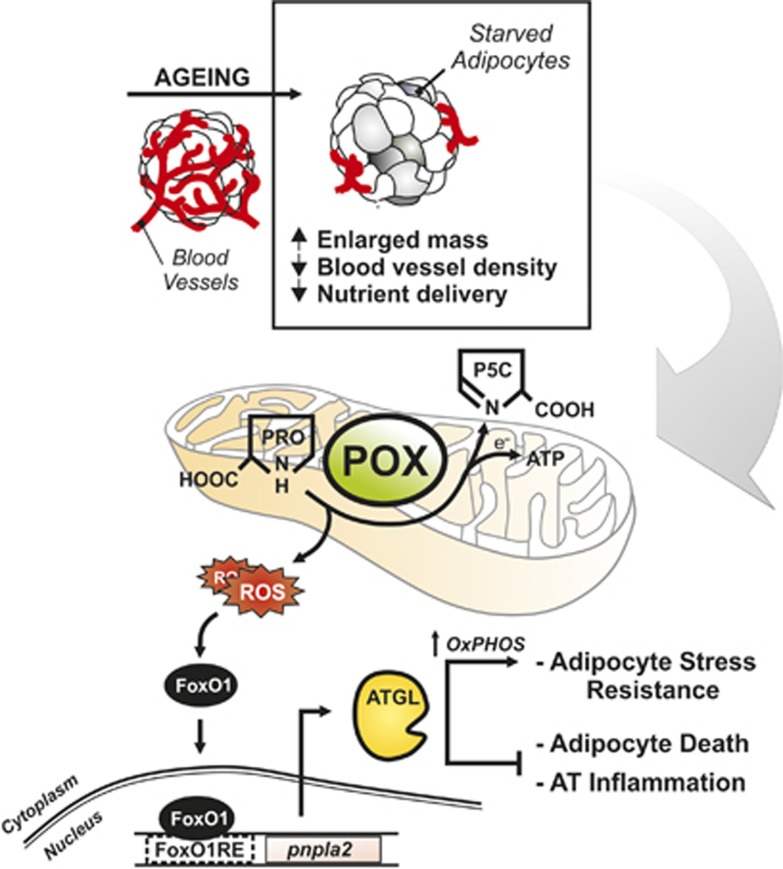
The nutrient-sensing lipolytic enzyme adipose triglyceride lipase (ATGL) has a key role in adipose tissue function, and alterations in its activity have been implicated in many age-related metabolic disorders. In adipose tissue reduced blood vessel density is related to hypoxia state, cell death and inflammation. Here we demonstrate that adipocytes of poorly vascularized enlarged visceral adipose tissue (i.e. adipose tissue of old mice) suffer from limited nutrient delivery. In particular, nutrient starvation elicits increased activity of mitochondrial proline oxidase/dehydrogenase (POX/PRODH) that is causal in triggering a ROS-dependent induction of ATGL. We demonstrate that ATGL promotes the expression of genes related to mitochondrial oxidative metabolism (peroxisome proliferator-activated receptor-α, peroxisome proliferator-activated receptor-γ coactivator-1α), thus setting a metabolic switch towards fat utilization that supplies energy to starved adipocytes and prevents cell death, as well as adipose tissue inflammation. Taken together, these results identify ATGL as a stress resistance mediator in adipocytes, restraining visceral adipose tissue dysfunction typical of age-related metabolic disorders.


Figures

Figure 1
Figure 1
ATGL is increased in visceral AT of old mice and nutrient starved 3T3-L1 adipocytes. (a) Western blotting analysis of VEGF-A, VE-cadherin and PECAM-1 in total protein extracts from young (2 months) and old (16 months) mice visceral AT. (b) Immunofluorescent analysis of apoptosis in young and old mice visceral AT. Nuclei were stained with Hoechst 33342 (blue) and apoptotic nuclei were visualized by TUNEL assay (red). White arrows in merged images indicate apoptotic nuclei. Apoptosis was expressed as the percentage of TUNEL-positive cells (right panel) (n=5 mice per group). (c) Western blotting analysis of ATGL, HSL and MGL in total protein extracts from 3T3-L1 adipocytes at different time of starvation. (d) RT-qPCR analysis of relative ATGL mRNA level in 3T3-L1 at different times of starvation. (e) Western blotting analysis of ATGL, HSL and MGL in total protein extracts from young and old mice visceral AT. (f) After 8 h from starvation (Stv), 3T3-L1 adipocytes were cultured in the complete cell culture medium (CM) up to 24 h. Western blotting (upper panel) and RT-qPCR (bottom panel) analysis of ATGL protein and mRNA. (g) Upper left panel: Histological sections of H&E-stained visceral AT from young, old and old mice subjected to CR (Old-CR). Black arrows indicate blood vessels. Bar: 100 μm. Bottom left panel: Western blotting analysis of PECAM-1 and ATGL in total protein extracts. β-actin was used as loading control. Upper right panel: Weight of visceral AT from young, old and old mice subjected to CR (Old-CR) was expressed as the percentage of body weight. Bottom right panel: Blood vessel density was expressed as the number of vessels per 1 mm2 (n=5–6 mice per group). All values are given as mean±S.D. *P<0.05, **P<0.01 versus controls; °P<0.05, °°P<0.01 versus starvation treatment. In vitro data are representative of at least three independent experiments
Figure 2
Figure 2
FoxO1 induces ATGL expression in a ROS-dependent manner. (a) Western blotting analysis of FoxO1 in total, nuclear and cytoplasmic protein extracts from 3T3-L1 adipocytes at different time of starvation. (b, c) ChIP assay was carried out on crosslinked nuclei from 3T3-L1 6 h starved adipocytes and visceral AT from young and old mice by using FoxO1 antibody followed by qPCR analysis of FoxO1RE on pnpla2 promoter (−1101). Dashed line indicates the value of IgG control. NAC (5 mM) was added 1 h prior starvation and maintained throughout the experiment. See also Supplementary Figure S3. (d) RT-qPCR analysis of relative ATGL mRNA level in visceral AT from young and old mice (n=5 mice per group). (e, f) Western blotting analysis of FoxO1 and ATGL in total (e) and nuclear protein extracts (f) from 6 h starved adipocytes. NAC (5 mM) or Trolox (0.5 mM) was added 1 h prior starvation and maintained throughout the experiment. (g) RT-qPCR analysis of relative ATGL mRNA level in 6 h starved 3T3-L1 adipocytes. (h, i) 3T3-L1 adipocytes were transfected with small interfering RNA (siRNA) against FoxO1 (FoxO1(−)) or with a scramble siRNA (Scr). RT-qPCR analysis of relative ATGL mRNA level and western blotting analysis of FoxO1 and ATGL in 6 h starved 3T3-L1 adipocytes. LDH, Sp1 and β-actin were used as loading controls. All values are given as mean±S.D. *P<0.05, **P<0.01 versus controls. In vitro data are representative of at least three independent experiments
Figure 3
Figure 3
Mitochondrial ROS activate FoxO1-mediated ATGL induction in 3T3-L1 adipocytes. (a) Cytofluorimetric analysis of 6 h starved 3T3-L1 adipocytes incubated with the mitochondrial ROS-sensitive probe (MitoSox). NAC (5 mM) was added 1 h prior starvation and maintained throughout the experiment. (b–e) Western blotting of FoxO1 and ATGL (b, d), and RT-qPCR of relative ATGL mRNA level (c, e) in 3T3-L1 adipocytes treated with Rotenone (1 μM) or cccp (10 μM). (f) Western blotting analysis of FoxO1 in total, nuclear and cytoplasmic protein extracts from Rotenone-treated 3T3-L1 adipocytes. (g, h) Western blotting analysis of FoxO1 and ATGL in total (g) and nuclear (h) protein extracts from 3T3-L1 adipocytes treated for 16 h with Rotenone or cccp. NAC (5 mM) was added 1 h prior Rotenone or cccp treatment and maintained throughout the experiment. (i) After Rotenone treatment (16 h), ChIP assay was carried out on crosslinked nuclei from 3T3-L1 adipocytes cells by using FoxO1 antibody followed by qPCR analysis of FoxO1RE on pnpla2 promoter (−1101). Dashed line indicates the value of IgG control. NAC (5 mM) was added 1 h prior starvation and maintained throughout the experiment. (j) RT-qPCR analysis of relative ATGL mRNA level in 3T3-L1 adipocytes treated for 16 h with Rotenone or cccp. NAC (5 mM) was added 1 h prior Rotenone or cccp treatment and maintained throughout the experiment. (k, l) 3T3-L1 adipocytes were transfected with small interfering RNA (siRNA) against FoxO1 (FoxO1(−)) or with a scramble siRNA (Scr). RT-qPCR analysis of relative ATGL mRNA level (k) and western blotting analysis of FoxO1 and ATGL (l) in 3T3-L1 adipocytes treated for 16 h with Rotenone or cccp. β-Actin, LDH, H2B and Sp1 were used as loading controls. All values are given as mean±S.D. *P<0.05, **P<0.01 versus controls; °P<0.05, °°P<0.01 versus Rotenone and cccp treatment, respectively. In vitro data are representative of at least three independent experiments
Figure 4
Figure 4
POX activity is increased during starvation and triggers the ROS-mediated FoxO1-ATGL axis in 3T3-L1 adipocytes. (a) Enzymatic activity of POX in 3T3-L1 adipocytes at different time of starvation. (b) Western blotting analysis of POX in protein extracts of 3T3-L1 adipocytes at different time of starvation. Relative density of immunoreactive bands is reported as POX/β-actin (bottom panel). (c, d) Western blotting analysis (c) and enzymatic activity (d) of POX in visceral AT from young, old and old mice subjected to CR (Old-CR). POX activity was expressed as the percentage of increase with respect to young (n=5–6 mice per group). (e) 3T3-L1 adipocytes were transfected with small interfering RNA (siRNA) against POX (POX(−)) or with a scramble siRNA (Scr) (upper panel). Cytofluorimetric analysis of 6 h starved 3T3-L1 adipocytes incubated with the mitochondrial ROS sensitive probe (MitoSox) (bottom panel). (f) Western blotting analysis of FoxO1 and ATGL in total protein extracts from 6 h starved 3T3-L1 adipocytes. (g) Western blotting analysis of FoxO1 in cytoplasmic (Cyt) and nuclear (Nuc) protein extracts from 6 h starved 3T3-L1 adipocytes. β-Actin, Sp1 and LDH were used as loading control. All values are given as mean±S.D. *P<0.05, **P<0.01 versus controls. In vitro data are representative of at least three independent experiments
Figure 5
Figure 5
ATGL upregulation is associated with increased mitochondrial oxidative metabolism in adipocytes. (a) Determination of TG content by Nile Red (left panel) or Oil Red O (right panel) staining in 6 h starved 3T3-L1 adipocytes. Nuclei were stained with Hoechst 33342 (blue). Oil Red O absorbance was detected after eluition. Means of Oil Red O absorbance values were indicated. (b) Assay of extracellular FA concentration in 3T3-L1 adipocytes at different times of starvation. Data are reported as the percentage of increase with respect to control. (c, d) RT-qPCR analysis of relative PPARα mRNA level (c) and western blotting analysis of Aco2 and PGC-1α (d) in 3T3-L1 adipocytes at different times of starvation. (e) RT-qPCR analysis of relative PPARα, PGC-1α, Aco2 and CPT-1b mRNA level in visceral AT of young and old mice (n=5 mice per group). (f) Enzymatic activity of citrate synthase in young and old mice visceral AT. Citrate synthase activity was expressed as the percentage of increase with respect to young (n=5 mice per group). (g) 3T3-L1 adipocytes were transfected with small interfering RNA (siRNA) against ATGL [ATGL(-)] or with a scramble siRNA (Scr). RT-qPCR analysis of relative PPARα, PGC-1α, Aco2 and CPT-1b mRNA level in 8 h starved 3T3-L1 adipocytes. (h) Western blotting analysis of ATGL and FoxO1 in 8 h starved 3T3-L1 adipocytes. β-Actin was used as loading control. All values are given as mean±S.D. *P<0.05, **P<0.01, °P<0.05 versus ctr. In vitro data are representative of at least 3 independent experiments
Figure 6
Figure 6
ATGL buffers starvation-induced energetic stress, prevents adipocytes death and AT inflammation. (a) Western blotting analysis of PARP-1, cleaved caspase-9 and TNFα in total protein extracts of visceral AT from young, old and old mice subjected to CR). (b) Western blotting analysis of ATGL, PARP-1, cleaved caspase-9 and TNFα in total protein extracts of visceral AT from young (2 months) wild-type (y-WT) and ATGL KO (y-ATGL KO) mice. (c) RT-qPCR analysis of relative TNFα, IL-6 and IL-1β mRNA level in visceral AT from young (2 months) wild type (y-WT) and ATGL KO (y-ATGL KO) mice (n=5 mice per group). (d) Western blotting analysis of ATGL, PARP-1 and cleaved caspase-9 in total protein extracts of mouse primary preadipocytes from 2-months wild-type (y-WT) and ATGL KO (y-ATGL KO) mice. (e) Western blotting analysis of PARP-1 and cleaved caspase-9 in total protein extracts from 3T3-L1 adipocytes at different times of starvation. (f) 3T3-L1 adipocytes were transfected with small interfering RNA (siRNA) against ATGL (ATGL(−)) or with a scramble siRNA (Scr). Western blotting analysis of PARP-1 and cleaved caspase-9 in total protein extracts from 8 h starved 3T3-L1 adipocytes. (g) Enzymatic activity of LDH in culture medium from 8 and 16 h starved ATGL(−) and Scr 3T3-L1 adipocytes. LDH activity was expressed as the percentage of increase with respect to Scr. (h, i) Cheminoluminescent assay of ATP level in 16 h starved ATGL(−) and Scr 3T3-L1 adipocytes (h), and young and old mice visceral AT (i). ATP level was expressed as pmol ATP/mg prot. (i) (N=5 mice per group). β-Actin was used as loading control. All values are given as mean±S.D. *P<0.05, **P<0.01 versus controls. In vitro data are representative of at least three independent experiments
Figure 7
Figure 7
Schematic diagram of the molecular pathways activated in adipocytes upon limited nutrient delivery. Ageing is associated with reduced vascularization of visceral AT. Resident adipocytes suffer from limited nutrient delivery and metabolically adapt to this condition to prevent energetic catastrophe. Upon nutrient starvation ATGL upregulation is crucial in preventing adipocytes death and AT inflammation via the increase of mitochondrial lipid oxidation. ROS produced by mitochondrial proline oxidase are the upstream mediators of the FoxO1-dependent ATGL expression. ATGL represents a stress resistance mediator in adipocytes, restraining AT dysfunction typical of age-related metabolic disorders. AT, visceral adipose tissue; ATGL, adipose triglyceride lipase; CPT1b, carnitine palmitoyltransferase 1b; FoxO1, forkhead box protein O1; FoxO1RE, FoxO1-responsive element; OXPHOS, oxidative phosphorylation; pnpla2, patatin-like phospholipase domain containing 2; POX, proline oxidase; PRO, proline; P5C, pyrroline 5 carboxylate; ROS, reactive oxygen species; TG, triglycerides

References

    1. Flegal KM, Kit BK, Orpana H, Graubard BI. Association of all-cause mortality with overweight and obesity using standard body mass index categories: a systematic review and meta-analysis. JAMA. 2013;309:71–82. - PMC - PubMed
    1. Tchkonia T, Morbeck DE, Von Zglinicki T, Van Deursen J, Lustgarten J, Scrable H, et al. Fat tissue, aging, and cellular senescence. Aging Cell. 2010;9:667–684. - PMC - PubMed
    1. Sun K, Kusminski CM, Scherer PE. Adipose tissue remodeling and obesity. J Clin Invest. 2011;121:2094–2101. - PMC - PubMed
    1. Halberg N, Khan T, Trujillo ME, Wernstedt-Asterholm I, Attie AD, Sherwani S, et al. Hypoxia-inducible factor 1alpha induces fibrosis and insulin resistance in white adipose tissue. Mol Cell Biol. 2009;29:4467–4483. - PMC - PubMed
    1. Wood IS, de Heredia FP, Wang B, Trayhurn P. Cellular hypoxia and adipose tissue dysfunction in obesity. Proc Nutr Soc. 2009;68:370–377. - PubMed

Publication types

MeSH terms