. 2013 Dec;20(12):1742-52.
doi: 10.1038/cdd.2013.134. Epub 2013 Oct 4.

Connexin36 contributes to INS-1E cells survival through modulation of cytokine-induced oxidative stress, ER stress and AMPK activity

Affiliations

Connexin36 contributes to INS-1E cells survival through modulation of cytokine-induced oxidative stress, ER stress and AMPK activity

F Allagnat et al. Cell Death Differ. 2013 Dec.

Abstract

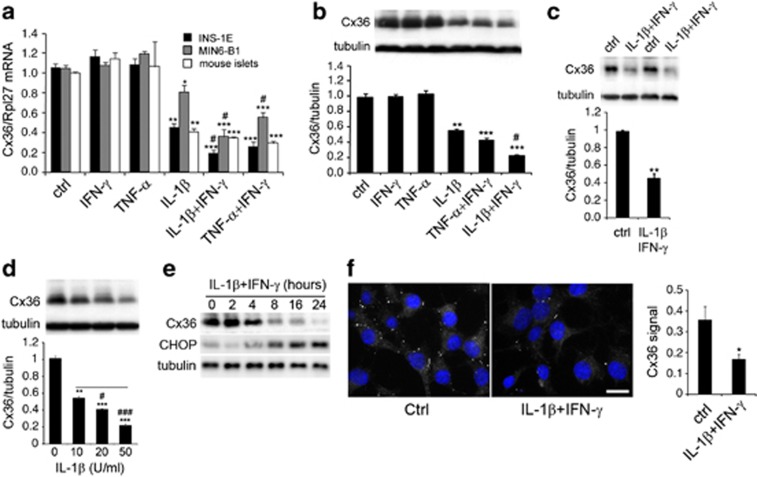
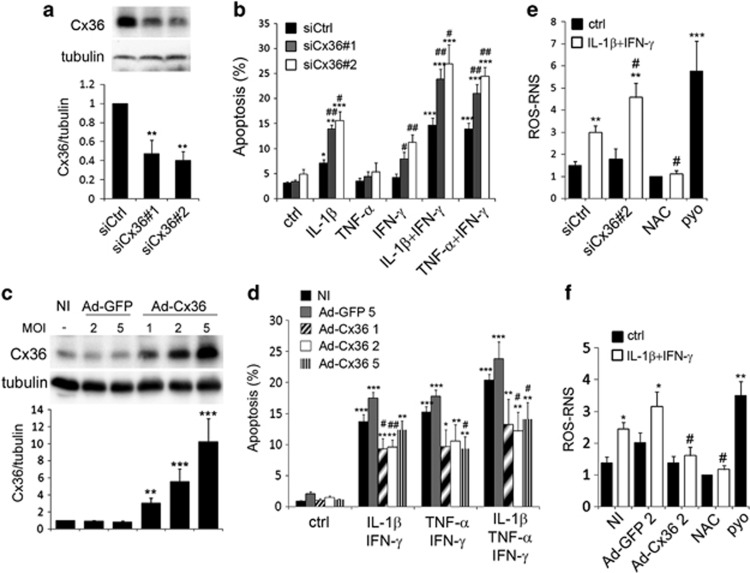
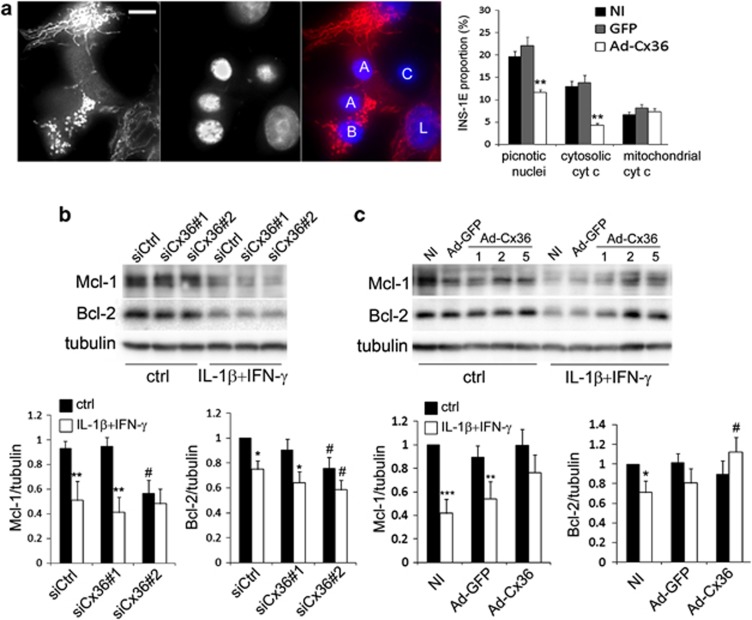
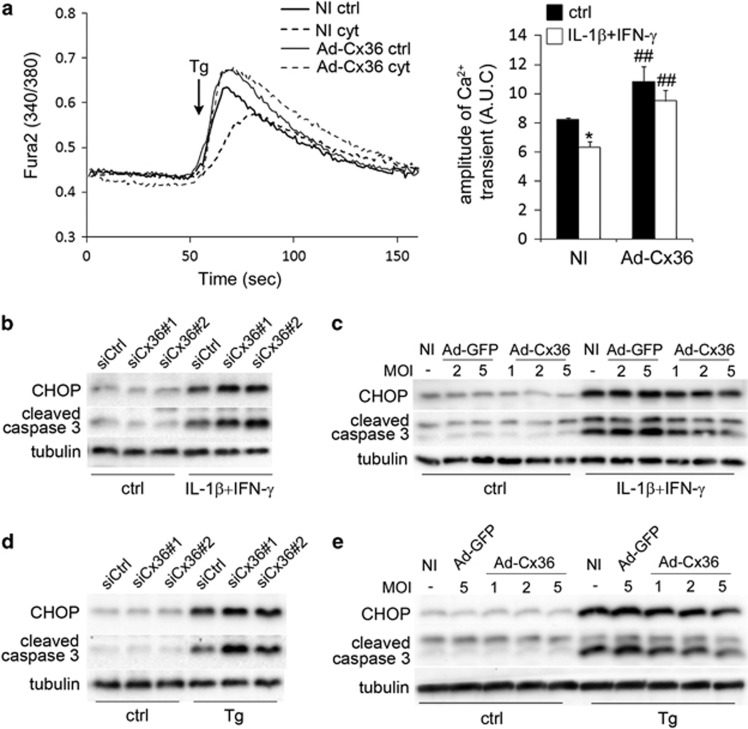
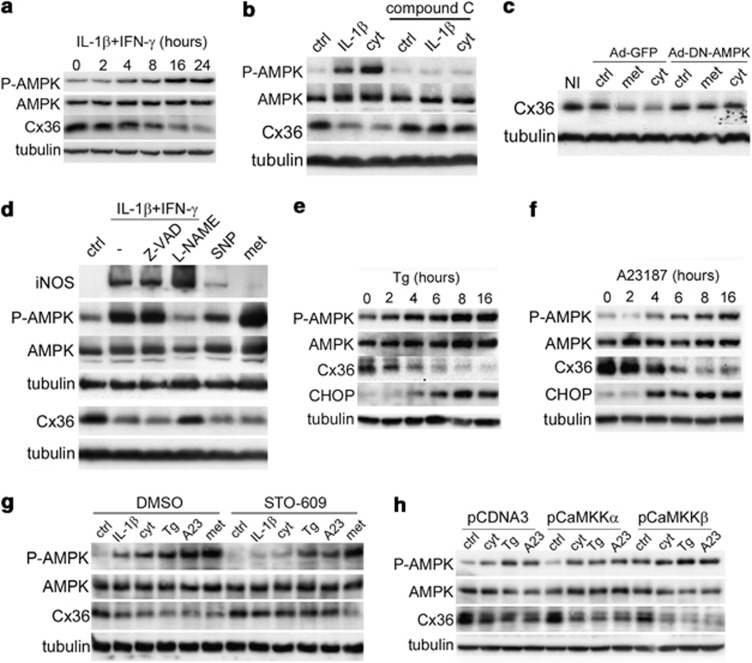
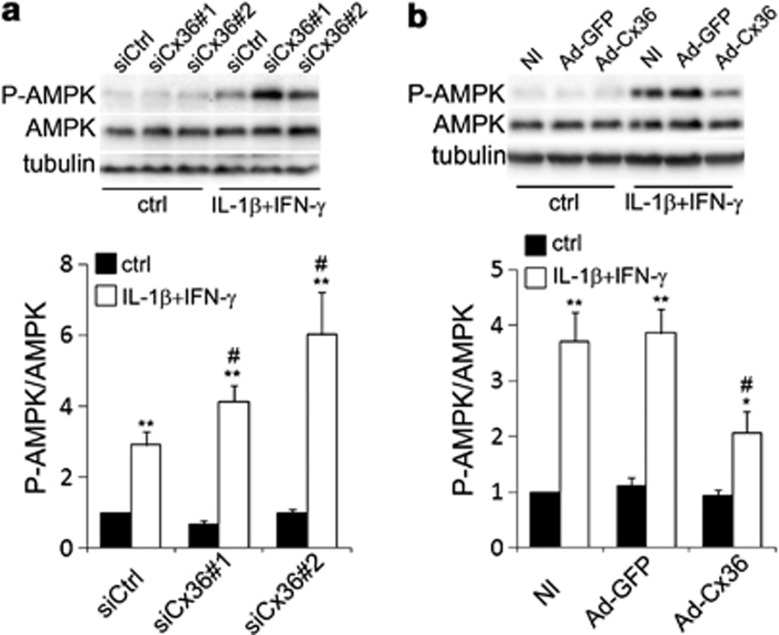
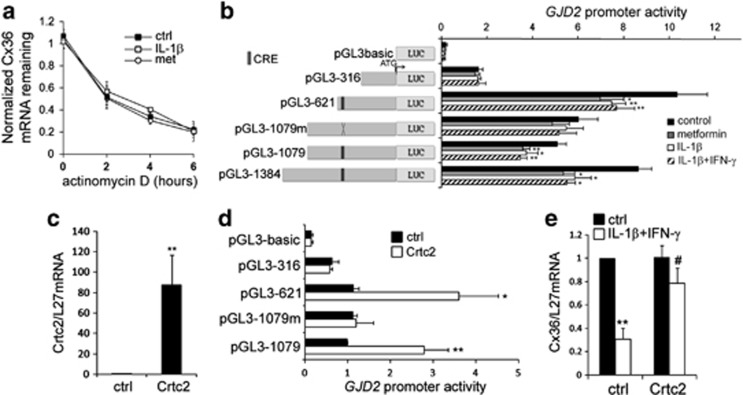
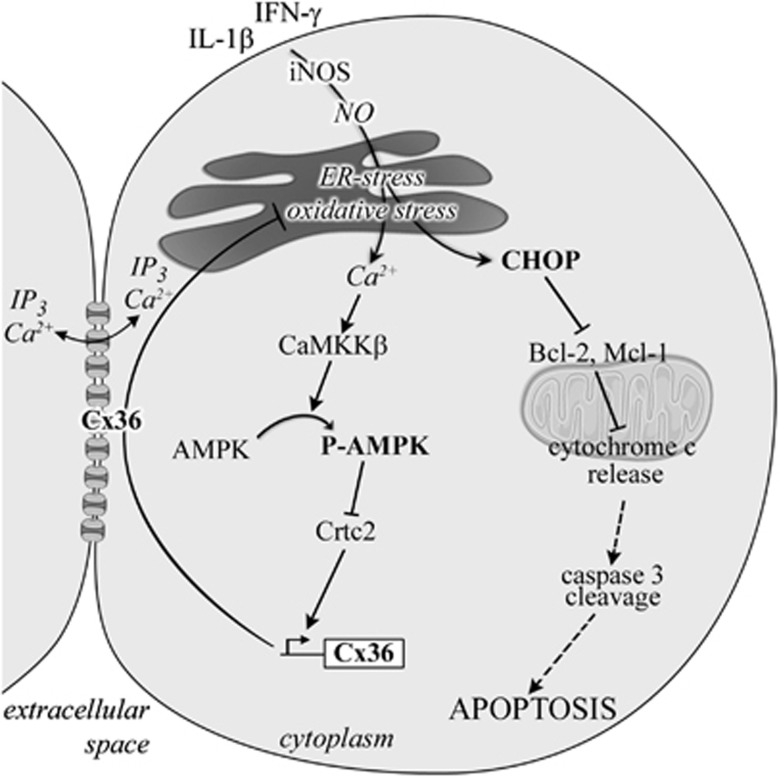
Cell-to-cell communication mediated by gap junctions made of Connexin36 (Cx36) contributes to pancreatic β-cell function. We have recently demonstrated that Cx36 also supports β-cell survival by a still unclear mechanism. Using specific Cx36 siRNAs or adenoviral vectors, we now show that Cx36 downregulation promotes apoptosis in INS-1E cells exposed to the pro-inflammatory cytokines (IL-1β, TNF-α and IFN-γ) involved at the onset of type 1 diabetes, whereas Cx36 overexpression protects against this effect. Cx36 overexpression also protects INS-1E cells against endoplasmic reticulum (ER) stress-mediated apoptosis, and alleviates the cytokine-induced production of reactive oxygen species, the depletion of the ER Ca(2+) stores, the CHOP overexpression and the degradation of the anti-apoptotic protein Bcl-2 and Mcl-1. We further show that cytokines activate the AMP-dependent protein kinase (AMPK) in a NO-dependent and ER-stress-dependent manner and that AMPK inhibits Cx36 expression. Altogether, the data suggest that Cx36 is involved in Ca(2+) homeostasis within the ER and that Cx36 expression is downregulated following ER stress and subsequent AMPK activation. As a result, cytokine-induced Cx36 downregulation elicits a positive feedback loop that amplifies ER stress and AMPK activation, leading to further Cx36 downregulation. The data reveal that Cx36 plays a central role in the oxidative stress and ER stress induced by cytokines and the subsequent regulation of AMPK activity, which in turn controls Cx36 expression and mitochondria-dependent apoptosis of insulin-producing cells.


Figures

Figure 1
Figure 1
Pro-inflammatory cytokines downregulate Cx36 in β-cells. (a) Cx36 over Rpl27 transcript levels in INS-1E cells, MIN6-B1 cells and primary mouse islets cultured for 24 h in the presence or absence (ctrl) of IL-1β (10 U/ml), TNF-α (1000 U/ml) and/or IFN-γ (100 U/ml), alone or in combination as indicated. Data are mean±S.E.M. of 4–6 independent experiments. (b) Upper panel: representative western blot analysis of Cx36 and tubulin in INS-1E cells cultured for 24 h in the presence or absence (ctrl) of IL-1β, TNF-α and/or IFN-γ, alone or in combinations. Lower panel: quantitative assessment of five independent experiments. (c) Western blot analysis and quantitative assessment of Cx36 over tubulin in primary rat islets cultured for 24 h in the presence of IL-1β+IFN-γ. n=4. (d) Western blot analyses and quantitative assessment of Cx36 over tubulin in INS-1E cells cultured for 24 h in the presence of increasing concentrations of IL-1β as indicated. (e) Time-course analysis of Cx36, CHOP and tubulin in INS-1E cells cultured in the presence of IL-1β+IFN-γ (representative of three independent experiments). (f) Cx36 immunolabeling dots (white dots) and DAPI (nuclear staining in blue) of INS-1E cells cultured in the presence of IL-1β+IFN-γ for 24 h. White bar: 10 μm. *P<0.05; **P<0.01; ***P<0.001 versus ctrl #P<0.05; ###P<0.0001 versus IL-1β or TNF-α alone
Figure 2
Figure 2
Changes in Cx36 expression modulate the cytokine-induced ROS–RNS production and apoptosis of INS-1E cells. (a, b and e) INS-1E cells were transfected with a control siRNA (siCtrl) or two different Cx36 siRNAs (siCx36#1 and #2). (c, d and f) INS-1E cells were infected or not (NI) with a control adenovirus (Ad-GFP) or a rat Cx36 adenovirus (Ad-Cx36) at various multiplicity of infection (MOI), as indicated. (a and c) Western blot analysis of Cx36 over tubulin levels. (b and d) Prevalence of apoptosis was evaluated by Hoechst–PI staining in cells treated or not (ctrl) for 24 h with IL-1β, TNF-α and/or IFN-γ, alone or in combination, as indicated. (e and f) ROS–RNS production was evaluated in live cells treated for 15 h with IL-1β+IFN-γ, together or not with 1mM N-acetyl cystein (NAC), or in cells treated for 30 min with 200 μM pyocyanin (pyo). *P<0.05, **P<0.01, ***P<0.001 versus ctrl. #P<0.05, ##P<0.01 versus siCtrl-transfected or NI condition
Figure 3
Figure 3
Changes in Cx36 expression modulate the mitochondrial pathway of apoptosis in INS-1E cells. (a) INS-1E cells were infected or not (NI) with Ad-Cx36 at MOI 2. Representative cytochrome c immunostaining (red) and DAPI (blue nuclear staining) upon IL-1β+IFN-γ-induced apoptosis (left panel) and quantitative assessment of picnotic nuclei and cytosolic or mitochondrial cytochrome c staining pattern (right panel). White bar: 5 μm. L: live cell; A: apoptotic cell with cytochrome c release; B: apoptotic cell without cytochrome c release; C: apoptotic cell without cytochrome c. (b) INS-1E cells were transfected with a control siRNA (siCtrl) or two different Cx36 siRNA (siCx36#1 and #2) and treated for 15 h with IL-1β+IFN-γ. Representative western blot for Bcl-2 and Mcl-1 over tubulin and quantitative assessment (means±S.E.M.) of Mcl-1/tubulin (left panel) and Bcl-2/tubulin (right panel) levels from five independent experiments. *P<0.05, **P<0.01 versus ctrl. #P<0.05 versus respective siCtrl condition. (c) INS-1E cells were infected or not (NI) with a control virus (Ad-GFP) or a Cx36 virus (Ad-Cx36) and treated for 15 h with IL-1β+IFN-γ. Representative western blot for Bcl-2 and Mcl-1 over tubulin and quantitative assessment (means±S.E.M.) of Mcl-1/tubulin (left panel) and Bcl-2/tubulin (right panel) levels from six independent experiments (Ad-GFP and Ad-Cx36 at MOI2). *P<0.05, **P<0.01, ***P<0.01 versus ctrl. #P<0.05 versus respective NI condition
Figure 4
Figure 4
Changes in Cx36 expression modulate ER stress, CHOP and activate caspase 3 levels in INS-1E cells. (a) INS-1E cells were infected or not (NI) with a control adenovirus (Ad-GFP) or a rat Cx36 adenovirus (Ad-Cx36) at various multiplicity of infection (MOI), as indicated. Cells were then treated or not (ctrl) for 15 h with IL-1β+IFN-γ (cyt), loaded with the cytosolic calcium-dye Fura-2 and monitored in Ca2+-free KRBH in presence of the SERCA inhibitor thapsigargin (Tg; 5 μM, arrow). Left panel: data are representative traces. Right panel: quantitative assessment of the cytosolic Ca2+ rise calculated by the area under the curve (A.U.C.) of four independent experiments. *P<0.05 versus ctrl condition; ##P<versus respective NI condition. (bd) Representative western blot for CHOP and cleaved caspase 3 over tubulin levels in INS-1E cells transfected with a control siRNA (siCtrl) or two different Cx36 siRNA (siCx36#1 and #2) and treated for 24 h with IL-1β+IFN-γ (b) or for 15 h with thapsigargin (Tg: 100 nM; (d)). (c–e) Representative western blot for CHOP and cleaved caspase 3 over tubulin levels in INS-1E cells infected or not (NI) with a control adenovirus (Ad-GFP) or a rat Cx36 adenovirus (Ad-Cx36) at various MOI and treated for 24 h with IL-1β+IFN-γ (c) or for 15 h with thapsigargin (Tg: 100 nM; (e))
Figure 5
Figure 5
Cytokine-induced Cx36 downregulation requires AMPK activation in INS-1E cells. (a) Time-course analyses of P-AMPK, AMPK, Cx36 and tubulin levels in INS-1E cells treated with IL-1β+IFNγ. (b) Western blot of P-AMPK, AMPK, Cx36 and tubulin levels in INS-1E cells cultured for 24 h in the presence or absence (ctrl) of IL-1β or IL-1β+IFNγ (cyt), alone or in combination with the AMPK inhibitor compound C (20 μM). (c) INS-1E cells were infected with a control Ad-GFP virus or a dominant-negative AMPK virus (Ad-DN-AMPK) and cultured for 24 h in the absence (ctrl) or presence of metformin (met; 1 mM) or IL-1β+IFNγ (cyt). (d) Representative western blot of iNOS, P-AMPK, AMPK, Cx36 and tubulin in INS-1E cells treated for 24 h with IL-1β+IFN-γ (cyt), alone or in combination with 1 mM L-NAME or 50 μM Z-VAD, or 100 μM SNP or 1 mM metformin (met). (e and f) Time-course or dose-response analyses of P-AMPK, AMPK, Cx36 and CHOP reveal that thapsigargin and A23187 stimulated AMPK phosphorylation and Cx36 reduction in INS-1E cells. (g) Representative western blot of P-AMPK, AMPK, Cx36 and tubulin levels in INS-1E cells treated with IL-1β, IL-1β+IFN-γ (cyt), thapsigargin (Tg), A23187 (A23) or metformin (met) for 16 h, together with DMSO or the CaMKKs inhibitor STO-609. (h) Representative western blot of P-AMPK, AMPK, Cx36 and tubulin in INS-1E cells transfected with an empty vector (ctrl) or vectors encoding either CaMKKα or CaMKKβ, and treated for 15 h with IL-1β+IFN-γ (cyt), thapsigargin (Tg) or A23187 (A23)
Figure 6
Figure 6
Changes in Cx36 expression modulate ER stress-induced phosphorylation of AMPK in INS-1E cells. (a) Representative western blot and quantification of P-AMPK over AMPK levels in INS-1E cells transfected with a control siRNA (siCtrl) or two different Cx36 siRNAs (siCx36#1 and #2) and treated for 24 h with IL-1β+IFN-γ. (b) Representative western blot and quantification of P-AMPK over AMPK levels in INS-1E cells infected or not (NI) with the Ad-GFP or the Ad-Cx36 at various multiplicity of infection (MOI), as indicated, and treated for 24 h with IL-1β+IFN-γ. *P<0.05, **P<0.01 versus ctrl. #P<0.05 versus respective siCtrl condition or NI condition
Figure 7
Figure 7
Crtc2 is involved in cytokine-induced inhibition of Cx36 transcriptional activity. (a) INS-1E cells were incubated for 2, 4 or 6 h in the absence (ctrl; black squares) or presence of IL-1β (white squares) or metformin (white circles), together or not (t0) with the transcription inhibitor actinomycin D. Data are means±S.E.M. of Cx36/L27 mRNA levels assessed by qPCR in three independent experiments. (b) INS-1E cells were cotransfected with a plasmid expressing the reporter gene luciferase under the control of progressive deletions of the human GJD2 promoter, including one construct with a mutated CRE (pGL3-1079m). After transfection, cells were incubated for 24 h in absence (control; black bars) or presence of metformin (gray bars), IL-1β (white bars) or IL-1β+IFN-γ (striped bars). Data are mean±S.E.M. of 4–7 independent experiments. *P<0.05; **P<0.01 versus ctrl. (c) Quantitative RT-PCR analyses of Crtc2 over L27 mRNA levels in INS-1E cells transfected with a Crtc2-coding plasmid or a control empty vector (ctrl). Data are mean±S.E.M. of four independent experiments. **P<0.01 versus respective empty vector transfection. (d) Luciferase activity in INS-1E cells cotransfected with various GJD2 promoter constructs and a control empty vector (ctrl; black bars) or the Crtc2-coding plasmid (Crtc2; white bars). Data are mean±S.E.M. of five independent experiments. *P<0.05; **P<0.01 versus empty vector transfection. (e) Quantitative RT-PCR analyses of Cx36 over L27 mRNA levels in INS-1E cells transfected with a control plasmid (ctrl) or the Crtc2-coding plasmid (Crtc2) and treated or not (black bars) for 24 h with IL-1β+IFN-γ (white bars). Data are mean±S.E.M. of four independent experiments. **P<0.01 versus untreated cells. #P<0.05 versus respective empty vector transfection
Figure 8
Figure 8
Cx36 has a central role in cytokine-induced ER stress, AMPK regulation and apoptosis. Pro-inflammatory cytokines stimulate NO production, leading to ER stress and increased CHOP expression. The ER stress-mediated [Ca2+]I increase promotes CaMKKβ activation, resulting in AMPK phosphorylation, inhibition of Crtc2 and the subsequent Cx36 downregulation. The decline in Cx36 levels aggravates ER stress, leading to increased CHOP overexpression, which in turn facilitates the degradation of the anti-apoptotic proteins Bcl-2 and Mcl-1, leading to cytochrome c release and, eventually, apoptosis. In a feedback loop, the reduced Cx36 levels facilitate AMPK phosphorylation, which further contributes to decrease in the levels of Cx36 and to worsening of the ER stress

References

    1. Bosco D, Haefliger JA, Meda P. Connexins: key mediators of endocrine function. Physiol Rev. 2011;91:1393–1445. - PubMed
    1. Cigliola V, Chellakudam V, Arabieter W, Meda P. Connexins and beta-cell functions. Diabetes Res Clin Pract. 2013;99:250–259. - PubMed
    1. Decrock E, Vinken M, De Vuyst E, Krysko DV, D'Herde K, Vanhaecke T, et al. Connexin-related signaling in cell death: to live or let die. Cell Death Differ. 2009;16:524–536. - PubMed
    1. Klee P, Allagnat F, Pontes H, Cederroth M, Charollais A, Caille D, et al. Connexins protect mouse pancreatic beta cells against apoptosis. J Clin Invest. 2011;121:4870–4879. - PMC - PubMed
    1. Eizirik DL, Colli ML, Ortis F. The role of inflammation in insulitis and beta-cell loss in type 1 diabetes. Nat Rev Endocrinol. 2009;5:219–226. - PubMed

Publication types

MeSH terms