. 2013 Nov;16(11):1692-700.
doi: 10.1038/nn.3534. Epub 2013 Oct 6.

Origin and effect of phototransduction noise in primate cone photoreceptors

Affiliations

Origin and effect of phototransduction noise in primate cone photoreceptors

Juan M Angueyra et al. Nat Neurosci. 2013 Nov.

Abstract

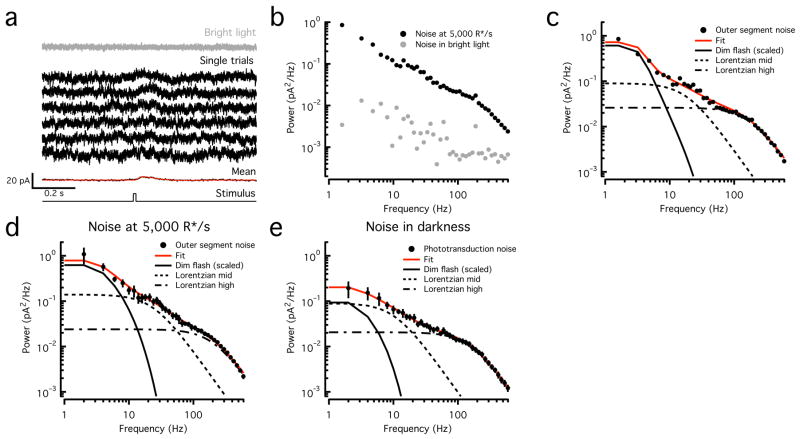
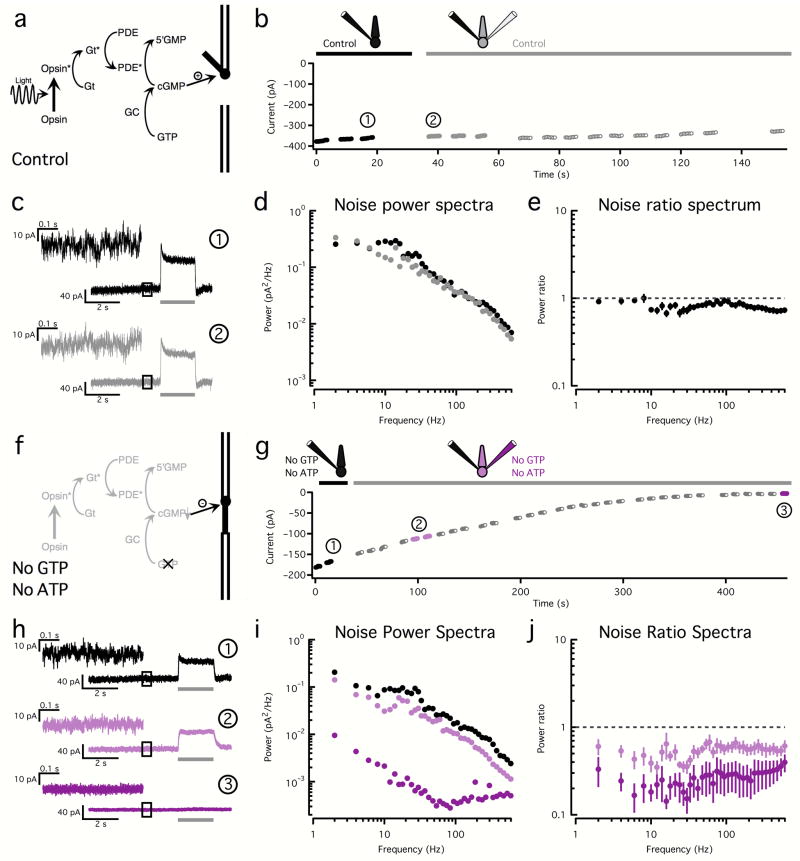
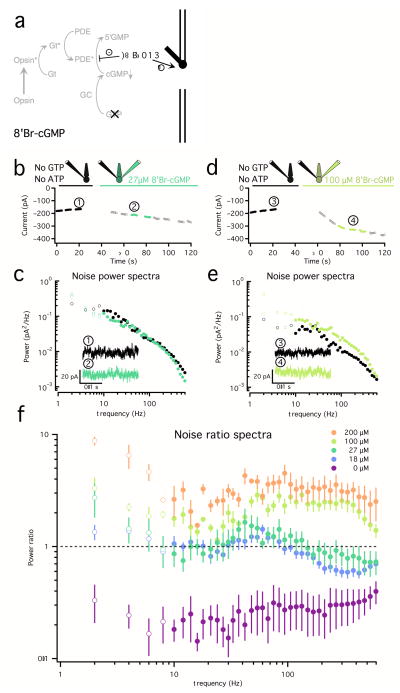
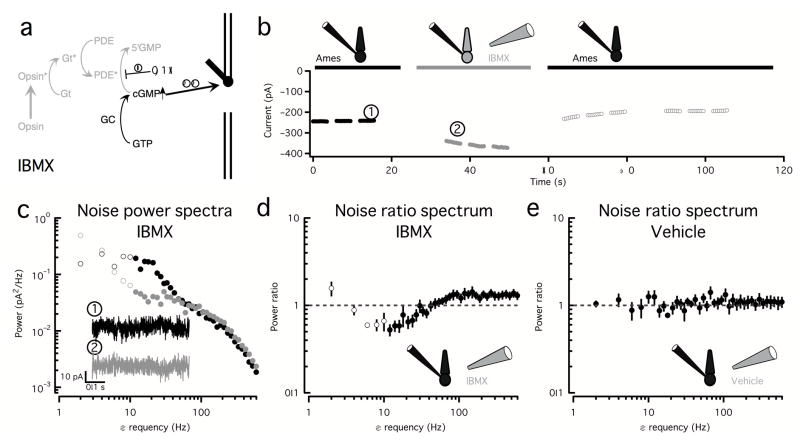
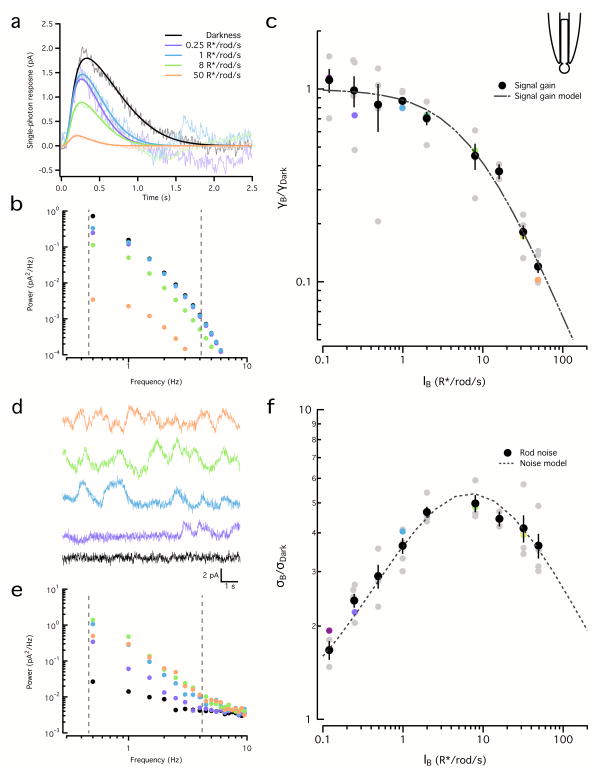
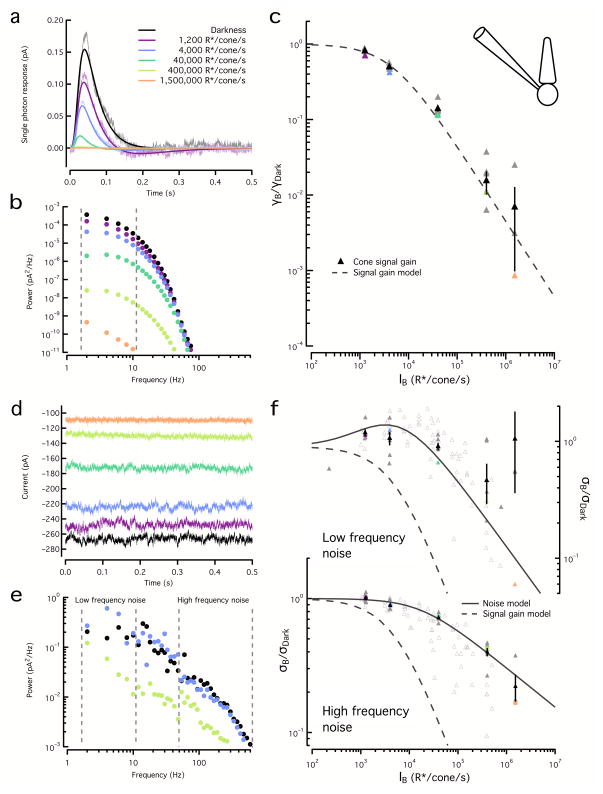
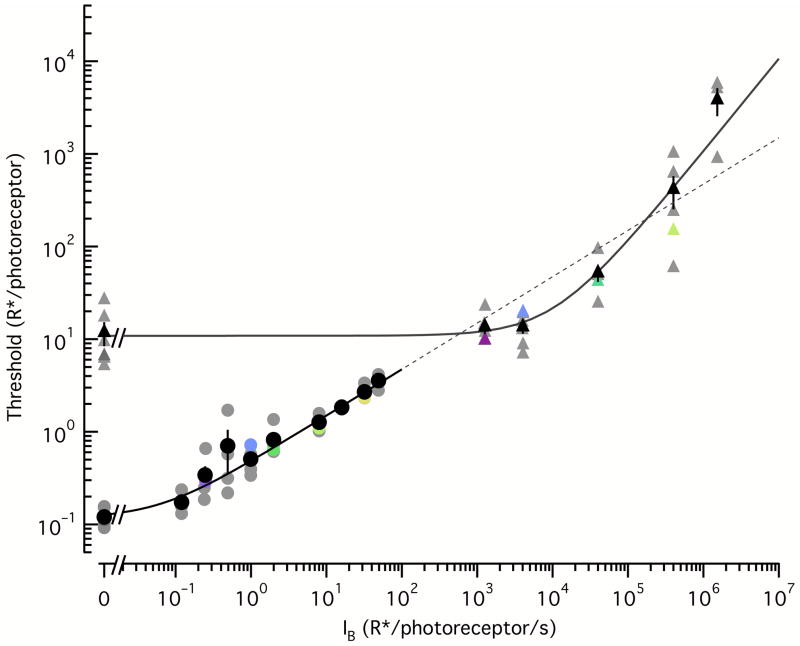
Noise in the responses of cone photoreceptors sets a fundamental limit on visual sensitivity, yet the origin of noise in mammalian cones and its relation to behavioral sensitivity are poorly understood. Our work here on primate cones improves understanding of these issues in three ways. First, we found that cone noise was not dominated by spontaneous photopigment activation or by quantal fluctuations in photon absorption, but was instead dominated by other sources, namely channel noise and fluctuations in cyclic GMP. Second, adaptation in cones, unlike that in rods, affected signal and noise differently. This difference helps to explain why thresholds for rod- and cone-mediated signals have different dependencies on background light level. Third, past estimates of noise in mammalian cones are too high to explain behavioral sensitivity. Our measurements indicate a lower level of cone noise and therefore help to reconcile physiological and behavioral estimates of cone noise and sensitivity.


Figures

Figure 1
Figure 1. Temporal components of cone outer segment noise
a. Cone current responses to 10 ms flashes producing ~50 opsin activations (R*) delivered on a 5000 R*/s background (black traces). The mean of ~50 responses is at the bottom, fitted (red) with Equation 6 with the following parameters: α = 0.1993, τrise = 20.2 ms, τdecay = 75.6 ms, τosc = 397.1 ms and ϕ = −79.5 degrees. Current recorded in bright light is at the top (gray trace). b. Power spectra of noise in constant and bright light from cone in (a). c. Power spectrum of the outer segment cone noise (black circles, noise in background minus that in saturating light from b) and fit (red trace) obtained by summing a scaled version of the power spectrum of the fitted average dim flash response and two Lorentzian functions (Equation 5) with distinct corner frequencies (18 Hz and 170 Hz) (black lines). d. Average outer segment cone noise measured at 5000 R*/s (n=6, black circles, mean ± SEM) and fit as in (c) (red trace). Corner frequencies of Lorentzian functions are 24 Hz and 200 Hz. e. Average outer segment cone noise measured in darkness from foveal cones (n = 7, black circles, mean ± SEM) and fit as in (c) (red trace). Corner frequencies of Lorentzian functions are 10 Hz and 150 Hz.
Figure 2
Figure 2. Two-electrode recordings allow pharmacological manipulation of cone phototransduction
a. Phototransduction cascade. Light-activated Opsin activates transducin (Gt), which then activates phosphodiesterase (PDE). Active PDE reduces the cyclic-GMP (cGMP) concentration, closing membrane channels. Cyclic-GMP is restored by guanylate cyclase (GC). b. Changes in holding current before (black) and after (gray) introduction of a second electrode; both electrodes contained control internal solution. Filled black and gray circles represent 500 ms stretches of noise used to calculate the spectra in (d). c. Light responses and noise before (black) and after (gray) introduction of the second electrode (time points noted in (b)). Upper left shows expanded examples of noise used to calculate the power spectra in (d). d. Power spectra before (black circles) and after (gray circles) the introduction of the second electrode. e. Average (± SEM, n=16) ratio between power spectra calculated before and after introduction of the second electrode. f. Omission of both ATP and GTP from the internal solution shuts down the phototransduction cascade, causing cGMP-gated channels to close. g. Changes in holding current during a two-electrode recording in which both electrodes contained a solution lacking ATP and GTP. Filled black and purple circles represent 500 ms stretches of noise used to calculate the spectra in (i). h. Examples of light responses and noise recorded before (black) and after (purple) the introduction of a second electrode (time points noted in (g)). i. Power spectra before (black) and after (purple) the introduction of the second electrode. j. Average (± SEM, n=6) ratio of power spectra before and after the introduction of the second electrode. Conditions as in (g).
Figure 3
Figure 3. High frequency noise arises from open/close transitions in the cGMP-gated channels
a. Channel noise was separated from sources causing fluctuations in [cGMP] by suppressing cGMP synthesis by omitting ATP and GTP from the internal solutions in a two-electrode recording. Different concentrations of the cGMP-channel agonist 8′Bromo-cyclic-GMP (8′Br-cGMP) were added to the second electrode. b. Changes in holding current before (black) and after (green) the introduction of a second electrode containing 27 μM 8′Br-cGMP. The filled black and green circles represent 500ms stretches of noise used to calculate the spectra in (c). c. Average noise power spectra for the cone in (B) before (black) and after (green) the introduction of a second electrode containing 27 μM 8′Br-cGMP. Insets show example noise traces in each condition corresponding to (1) and (2) in (b). d and e. Same as in (b) and (c) for an 8′Br-cGMP concentration of 100 μM. f. Average (± SEM) ratio of power spectra before and after introduction of 8′Br-cGMP. The color scale corresponds to the concentration of 8′Br-cGMP (18 μM: n = 10; 27 μM: n = 4; 100 μM: n = 3; 200 μM: n = 2). Changes in noise below 10Hz are unreliable due to slow drift in the measured current and are displayed as open circles. The increase at high frequencies (100 Hz–600Hz) is significant across all concentrations.
Figure 4
Figure 4. An additional noise source with power in the low to mid frequency range causes fluctuations in cGMP
a. The membrane-permeable and fast acting PDE inhibitor IBMX increases the cGMP concentration and therefore the number of open channels and inhibits any noise source upstream of (and including) PDE. b. Changes in holding current in the absence (black) and presence (gray) of IBMX. The filled black and gray circles represent 500 ms stretches of noise used to calculate the spectra in (c). Recordings were performed in complete darkness to avoid extrinsic noise. c. Corresponding power spectra in the absence (black circles) and presence (gray circles) of IBMX. Insets show example noise traces in each condition corresponding to (1) and (2) in (b). Changes in noise below 10Hz (open circles) are unreliable due to slow drift in the measured current. d. Average (± SEM) ratio of power spectra in the presence and in the absence of IBMX (n = 10) showing a decrease in noise in the 10 to 50 Hz range and an increase in noise at high frequencies (100 to 600Hz) e. Average (± SEM) ratio of power spectra before and after puffing a vehicle solution lacking IBMX (n=4). The increase in noise at the high frequencies (100–600Hz) and the decrease at low frequencies (10–30 Hz) seen with IBMX were significantly different than the changes with vehicle.
Figure 5
Figure 5. Adaptation similarly affects rod signal and noise
a. Linear estimates of the rod single photon responses for a range of backgrounds. Increasing backgrounds resulted in faster and smaller responses. Fits were obtained using Equation 6. Correspondence between light levels and color scale is maintained throughout the figure. b. Power spectra of the fitted single photon responses in (a). Dashed lines show integration limits. c. Square root of the integrated signal power (0.5 Hz–4 Hz) normalized by that in darkness for the example rod in (a) and (b) (colored circles) and for a population of rods (gray circles). The population data (black circles, mean ± SEM, n=5) was fit with Equation 1 with I0 = 7.1 R*/s. d. Examples of noise traces for the same rod and backgrounds as in (a). e. Power spectra of the noise traces in (d). Dashed lines show integration limits. f. Square root of the power spectrum integral (0.5 Hz–4 Hz) of the noise normalized by darkness for the example rod in (a) and (d) (colored circles) and for a population of rods (gray circles). The population (black circles, mean ± SEM, n=5) was fit with Equation 2 with ID = 0.062 R*/s.
Figure 6
Figure 6. Adaptation affects cone signal and noise differently
a. Estimated cone single photon responses for a range of backgrounds, fit with Equation 6. Color scale is maintained throughout the figure. b. Power spectra of the fitted single photon responses in (a). Dashed lines show integration limits. c. Square root of the integrated signal power (2–10 Hz) normalized by that in darkness for the example cone in (a) and (b) (colored triangles) and for a population of cones (gray triangles). Population data (black triangles, mean ± SEM, n=6) was fit with Equation 1 with I0 = 4500 R*/s. d. Example noise traces for the same cone and backgrounds as (a). e. Example noise power spectra for the same cone as (a). f. Top, Square root of the integrated noise power at low frequencies (2–10 Hz) normalized by that in darkness for the example cone in (a) (colored triangles) and for a population of cones (gray triangles). Dashed line shows signal gain curve from (c). Noise below 10Hz at the highest backgrounds (black open triangles) was unreliable and was excluded from fitting. Population (black triangles, mean ± SEM, n=6) was fit with Equation 3 with ID = 620 R*/s. Bottom, Square root of the integrated noise power at high frequencies (50 Hz to 600 Hz) as in top panel. The population data was fit with Equation 7 with Io=17500 R*/s and η=0.29. Open grey triangles show noise from cones in which signal adaptation was not assessed (n=6); fit to low frequency noise used ID=1200 R*/s and I0=9950*/s and fit to high frequency noise used Io=13 360 R*/s and η=0.34.
Figure 7
Figure 7. Background dependence of rod and cone detection thresholds
Detection thresholds were derived for both photoreceptor types from the data shown in Figures 5 and 6 (see Methods). Colored symbols correspond to thresholds for the example rods and cones from Figures 5 and 6, while gray symbols correspond to population data (5 rods, 6 cones). The rod thresholds (black circles show mean ± SEM) were well described by Equation 3, with a dark threshold < 1R*/rod. The cone thresholds (black triangles show mean ± SEM) were well described by a Weber-like function (Equation 4) with a dark threshold of 10.9 R*/cone, and a threshold-doubling background, Io = 11700 R*/s. The fit to the rod thresholds was extended to higher backgrounds to directly compare the slopes; in this log-log plot, the slope for rods is 0.5 corresponding to a “square root” behavior while the slope for cones is 1, corresponding to a Weber behavior.

References

    1. Baylor DA, Matthews G, Yau KW. Two components of electrical dark noise in toad retinal rod outer segments. J Physiol. 1980;309:591–621. - PMC - PubMed
    1. Baylor DA, Nunn BJ, Schnapf JL. The photocurrent, noise and spectral sensitivity of rods of the monkey Macaca fascicularis. J Physiol. 1984;357:575–607. - PMC - PubMed
    1. Rieke F, Baylor DA. Molecular origin of continuous dark noise in rod photoreceptors. Biophys J. 1996;71:2553–2572. - PMC - PubMed
    1. Fu Y, Yau KW. Phototransduction in mouse rods and cones. Pflugers Arch. 2007;454:805–819. - PMC - PubMed
    1. Donner K. Noise and the absolute thresholds of cone and rod vision. Vision Res. 1992;32:853–866. - PubMed

Publication types

MeSH terms

Substances

LinkOut - more resources