. 2014 Jan;31(1):184-200.
doi: 10.1093/molbev/mst170. Epub 2013 Oct 4.

Simulations of enhancer evolution provide mechanistic insights into gene regulation

Affiliations

Simulations of enhancer evolution provide mechanistic insights into gene regulation

Thyago Duque et al. Mol Biol Evol. 2014 Jan.

Abstract

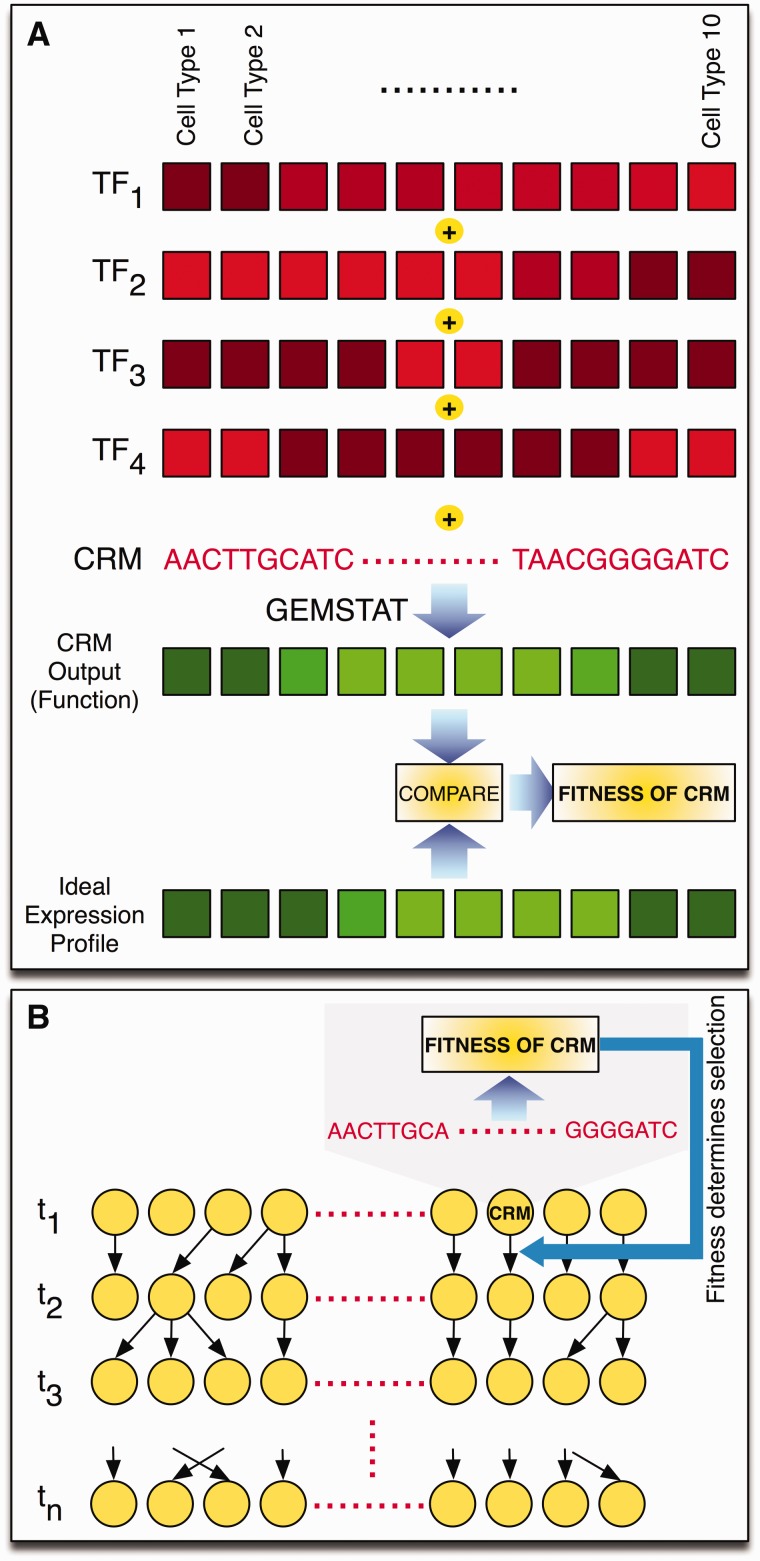
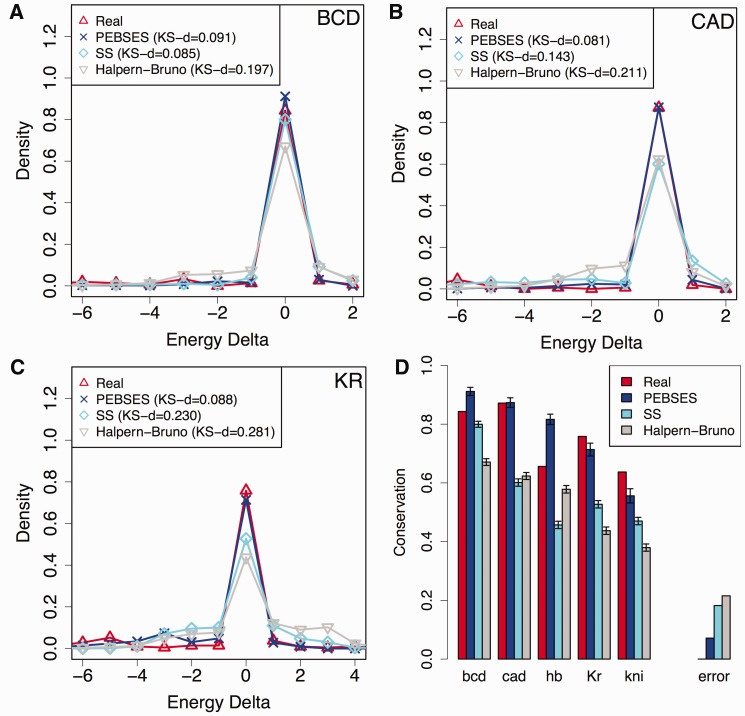
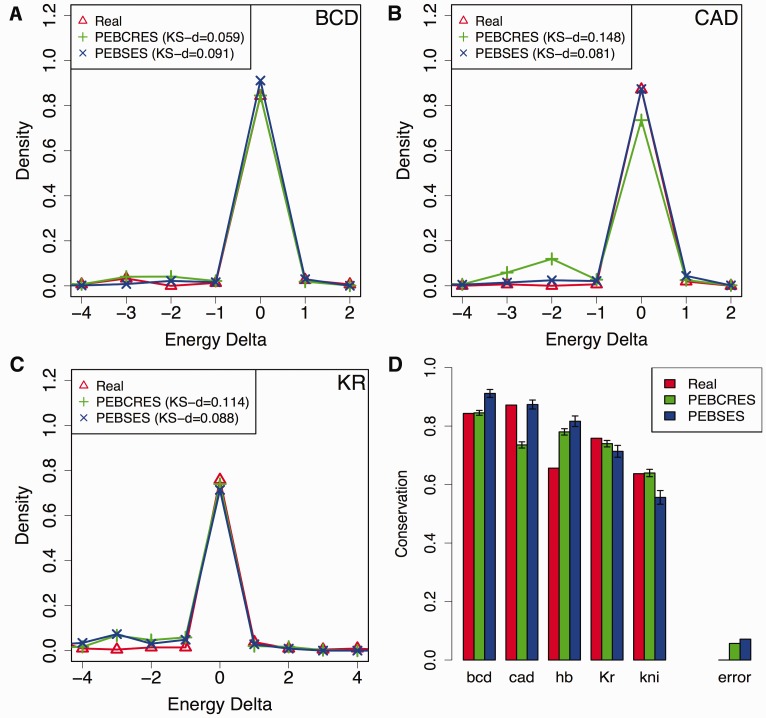
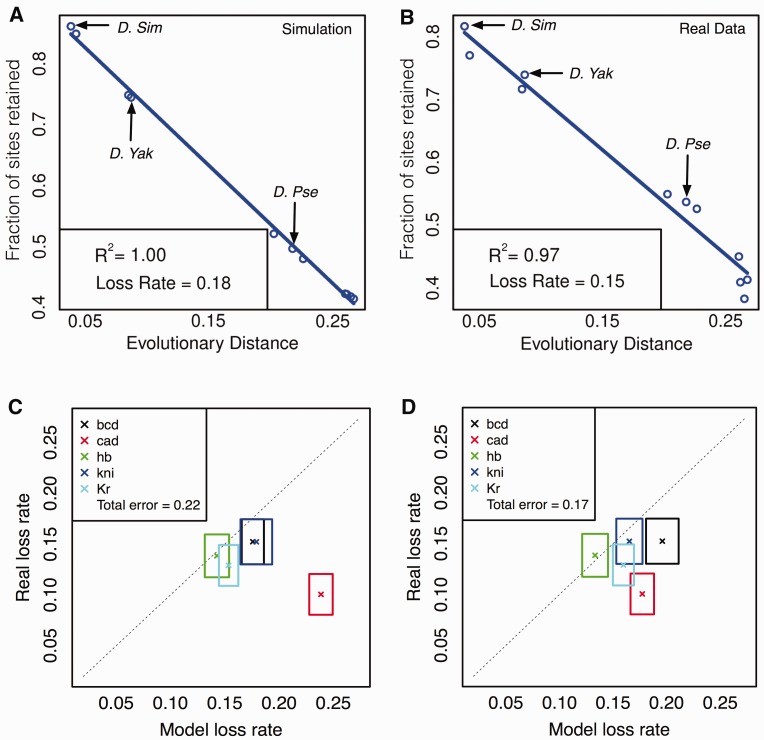
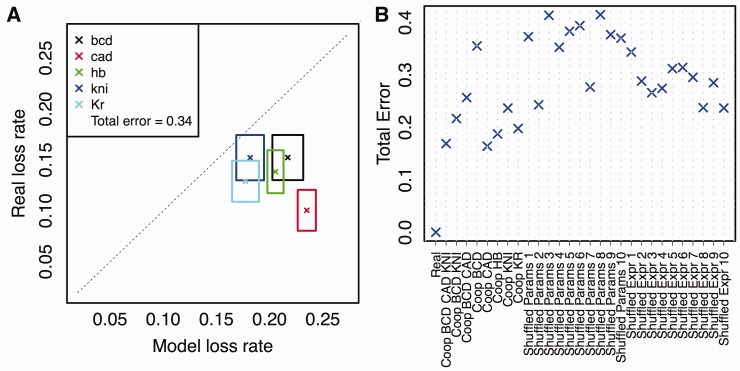
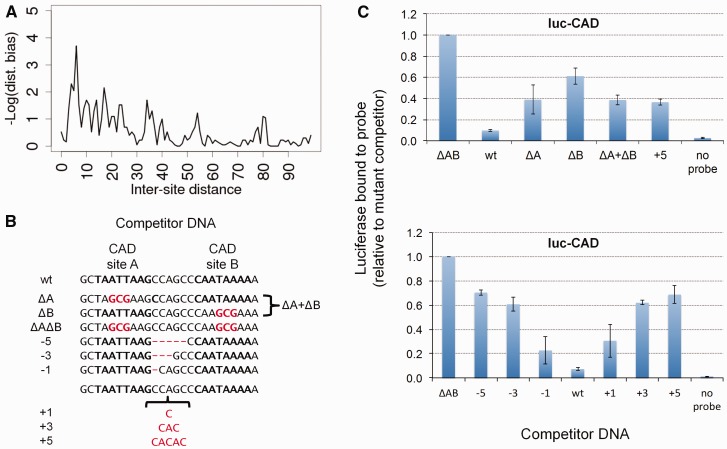
There is growing interest in models of regulatory sequence evolution. However, existing models specifically designed for regulatory sequences consider the independent evolution of individual transcription factor (TF)-binding sites, ignoring that the function and evolution of a binding site depends on its context, typically the cis-regulatory module (CRM) in which the site is located. Moreover, existing models do not account for the gene-specific roles of TF-binding sites, primarily because their roles often are not well understood. We introduce two models of regulatory sequence evolution that address some of the shortcomings of existing models and implement simulation frameworks based on them. One model simulates the evolution of an individual binding site in the context of a CRM, while the other evolves an entire CRM. Both models use a state-of-the art sequence-to-expression model to predict the effects of mutations on the regulatory output of the CRM and determine the strength of selection. We use the new framework to simulate the evolution of TF-binding sites in 37 well-studied CRMs belonging to the anterior-posterior patterning system in Drosophila embryos. We show that these simulations provide accurate fits to evolutionary data from 12 Drosophila genomes, which includes statistics of binding site conservation on relatively short evolutionary scales and site loss across larger divergence times. The new framework allows us, for the first time, to test hypotheses regarding the underlying cis-regulatory code by directly comparing the evolutionary implications of the hypothesis with the observed evolutionary dynamics of binding sites. Using this capability, we find that explicitly modeling self-cooperative DNA binding by the TF Caudal (CAD) provides significantly better fits than an otherwise identical evolutionary simulation that lacks this mechanistic aspect. This hypothesis is further supported by a statistical analysis of the distribution of intersite spacing between adjacent CAD sites. Experimental tests confirm direct homodimeric interaction between CAD molecules as well as self-cooperative DNA binding by CAD. We note that computational modeling of the D. melanogaster CRMs alone did not yield significant evidence to support CAD self-cooperativity. We thus demonstrate how specific mechanistic details encoded in CRMs can be revealed by modeling their evolution and fitting such models to multispecies data.

Keywords: cis-regulatory module; cooperativity; enhancer; evolution; simulation.


Figures

F<sc>ig</sc>. 1.
Fig. 1.
Methodology. (A) The regulatory function of a CRM is represented by an expression profile, that is, gene expression levels in well-defined cell types. An ideal expression profile (shown in green, with brighter shades representing higher expression) is designated and the fitness of a CRM sequence is computed by comparing this ideal expression profile to that predicted as being the CRM’s output (a more similar CRM output profile has greater fitness). The CRM’s output is computed based on its sequence and the concentration values of relevant TFs (shown in red) in the same set of cell types. This computation is done using the thermodynamics-based GEMSTAT model (He et al. 2010), which additionally uses the binding motifs of those TFs to predict CRM function from sequence. (B) Cartoon illustration of Wright–Fisher simulations underlying the PEBCRES model. A fixed-sized population of individuals (CRMs) is evolved for n generations (t1, t2, … tn). Random mutations are introduced in each generation using a predetermined mutation rate parameter. Each individual is sampled independently at random from the population in the previous generation, and this sampling probability is dependent on the fitness of the individual, which in turn is determined by the CRM’s output as shown in (A).
F<sc>ig</sc>. 2.
Fig. 2.
(A–C) Energy difference histograms from real data and from three evolutionary models—Halpern–Bruno (Halpern and Bruno 1998), SS (Kim et al. 2009), and PEBSES (this work)—for binding sites of TFs BCD (A), CAD (B), and KR (C). A binding site in a Drosophila melanogaster CRM was compared with its aligned site in D. yakuba (for real data histogram) or in a simulated descendent (for model-based histograms), and the difference in predicted binding energies (LLR scores) of the two sites was noted. This was repeated for each of 159, 171, and 239 binding sites of BCD, CAD, and KR. For model-based histograms, each site’s evolution was simulated on an average of 28 times. (D) The fraction of sites for which energy difference between D. melanogaster and D. yakuba orthologs is 0 (Conservation; y axis) is shown for real data and for the Halpern–Bruno, SS and PEBSES models, and for five different TFs. The difference between real data and a model’s prediction of this fraction is deemed the TF-specific error of that model, and the absolute value of error is averaged over the five TFs and shown as the error of each model.
F<sc>ig</sc>. 3.
Fig. 3.
(A–C) Energy difference histograms from real data and from the two evolutionary models—PEBSES and PEBCRES—presented in this work, for TFs BCD (A), CAD (B), and KR (C). (D) The fraction of sites for which energy difference between D. melanogaster and D. yakuba orthologs is 0 (Conservation; y axis), shown for real data and for the PEBSES and PEBCRES models. The error of either model, as defined in legend of figure 2, is also shown.
F<sc>ig</sc>. 4.
Fig. 4.
(A, B) Site conservation for BCD (y axis) as a function of evolutionary distance between Drosophila melanogaster and a second Drosophila species (x axis), based on PEBCRES simulations (A) and real data (B). Evolutionary distance is measured as the average number of substitutions in aligned positions in the pairwise alignment (see Materials and Methods). The inset shows the R2 value and the (negative of) the slope of the best fit straight line, called the loss rate. (C, D) Site loss rate from real data (y axis) and from PEBCRES simulations (x axis), shown by cross marks for each TF. Sides of the each rectangle indicate the standard deviation of loss rates observed from bootstrap samples. The two panels show this information with two different models of regulatory function—one with self-cooperative DNA binding by BCD and KNI (C) and one with self-cooperativity for BCD, KNI, and CAD (D). The total error of a model was calculated as the horizontal distance between each cross and the diagonal, summed over all TFs, and is shown in the inset.
F<sc>ig</sc>. 5.
Fig. 5.
(A) Real and simulation-based site loss rates (crosses) and their sampling variations (sides of rectangles), where simulations were performed with TF expression patterns randomly shuffled. (B) Total error, as defined above, for simulations performed with different configurations of the GEMSTAT model—self-cooperative DNA binding by each of BCD, CAD, and KNI (Coop BCD CAD KNI; the model of fig. 4D), by BCD and CAD only (Coop BCD CAD), by BCD and KNI only (Coop BCD KNI; the model of fig. 4D), by BCD only (Coop BCD), CAD only (Coop CAD), by HB only (Coop HB), by KNI only (Coop KNI), and by KR only (Coop KR)—and for different types of negative controls—with randomly reassigned TF parameters (Shuffled Params 1–10) and with randomly reassigned TF expression profiles (Shuffled Expr 1–10).
F<sc>ig</sc>. 6.
Fig. 6.
(A) Logarithm (base 10) of P value of CAD intersite spacing bias at different values of the spacing (x axis). (B) A schematic representation of competitor DNA used to experimentally assess cooperative DNA binding by CAD in vitro. The competitor DNA might include mutations that disrupt one (ΔA, ΔB) or both (ΔAB) of the CAD-binding sites as well as deletions (−1, −3, −5) or insertions (+1, +3, +5) that change the spacing between the two sites. ΔA + ΔB indicates the inclusion of both DNA with mutations to the first site (ΔA) and DNA with mutations to the second site (ΔB). (C) DNA-binding site measurements for CAD homotypic interaction. In experiments, the biotinylated DNA sequence is either wild type or not included (no probe). The competitor DNA used is indicated on the x axis. The luciferase activity recovered using a competitor in which both CAD binding sites are mutated is set to a value of one and used as a nonspecific DNA-binding control to normalize the remaining samples. Addition of a wild-type DNA sequences effectively competes for binding to the probe and reduces the recovery of Luc-CAD. Changes in either the individual CAD-binding sites or in the spacing between the binding sites results in reduced binding to the competitor DNA compared with wild type and an increased recovery of Luc-TF with the biotin-labeled DNA. Error bars indicate the standard deviation (see supplementary table S2 [Supplementary Material online] for individual measurements and more detailed sequence information).

Similar articles

Cited by

References

    1. Bakkali M. Microevolution of cis-regulatory elements: an example from the pair-rule segmentation gene fushi tarazu in the Drosophila melanogaster subgroup. PLoS One. 2011;6:e27376. - PMC - PubMed
    1. Balhoff JP, Wray GA. Evolutionary analysis of the well characterized endo16 promoter reveals substantial variation within functional sites. Proc Natl Acad Sci U S A. 2005;102:8591–8596. - PMC - PubMed
    1. Barolo S. Shadow enhancers: frequently asked questions about distributed cis-regulatory information and enhancer redundancy. Bioessays. 2012;34:135–141. - PMC - PubMed
    1. Barrios-Rodiles M, Brown KR, Ozdamar B, et al. (17 co-authors) High-throughput mapping of a dynamic signaling network in mammalian cells. Science. 2005;307:1621–1625. - PubMed
    1. Berg J, Willmann S, Lässig M. Adaptive evolution of transcription factor binding sites. BMC Evol Biol. 2004;4:42. - PMC - PubMed

Publication types

Substances

LinkOut - more resources