. 2013 Nov 15;288(46):32941-51.
doi: 10.1074/jbc.M113.496802. Epub 2013 Oct 4.

Inositol 1,4,5-trisphosphate (IP3) receptor up-regulation in hypertension is associated with sensitization of Ca2+ release and vascular smooth muscle contractility

Affiliations

Inositol 1,4,5-trisphosphate (IP3) receptor up-regulation in hypertension is associated with sensitization of Ca2+ release and vascular smooth muscle contractility

Haissam Abou-Saleh et al. J Biol Chem. .

Abstract

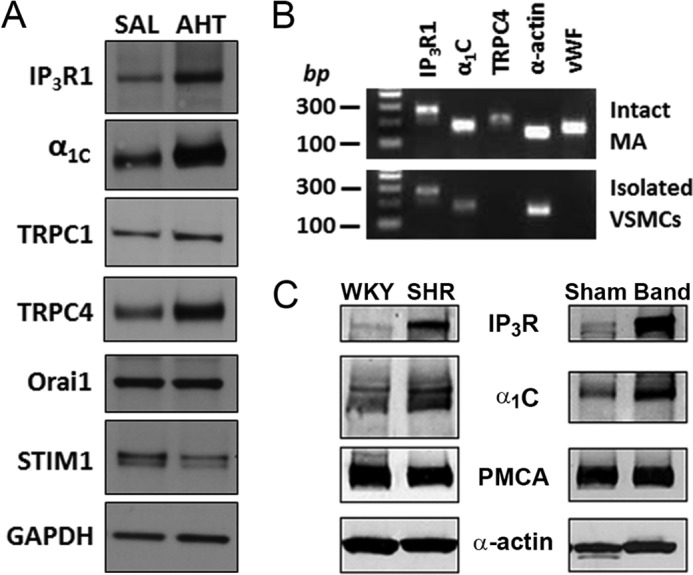
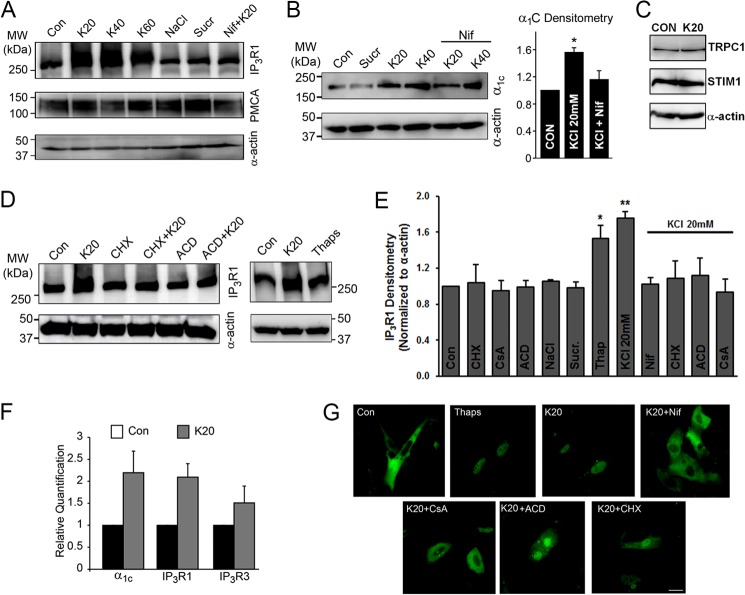
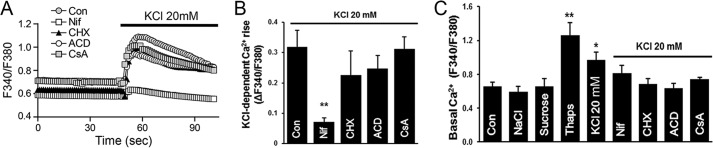
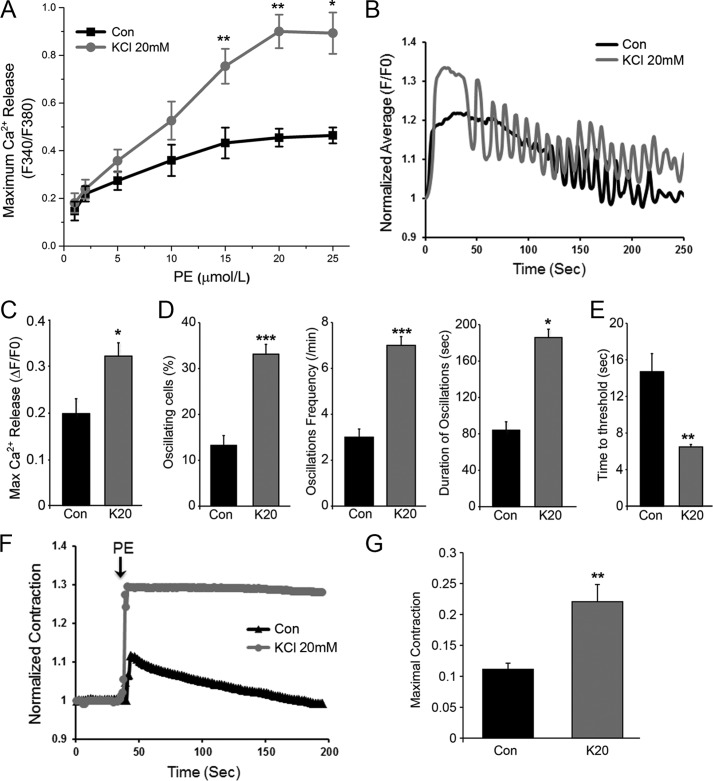
Resistance arteries show accentuated responsiveness to vasoconstrictor agonists in hypertension, and this abnormality relies partly on enhanced Ca(2+) signaling in vascular smooth muscle (VSM). Although inositol 1,4,5-triphosphate receptors (IP3Rs) are abundant in VSM, their role in the molecular remodeling of the Ca(2+) signaling machinery during hypertension has not been addressed. Therefore, we compared IP3R expression and function between mesenteric arteries of normotensive and hypertensive animals. Levels of IP3R transcript and protein were significantly increased in mesenteric arteries of hypertensive animals, and pharmacological inhibition of the IP3R revealed a higher contribution of IP3-dependent Ca(2+) release to vascular contraction in these arteries. Subsequently, we established cultured aortic VSM A7r5 cells as a cellular model that replicates IP3R up-regulation during hypertension by depolarizing the VSM cell membrane. IP3R up-regulation requires Ca(2+) influx through L-type Ca(2+) channels, followed by activation of the calcineurin-NFAT axis, resulting in IP3R transcription. Functionally, IP3R up-regulation in VSM is associated with enhancement and sensitization of IP3-dependent Ca(2+) release, resulting in increased VSM contraction in response to agonist stimulation.

Keywords: A7r5; Calcineurin; Calcium Signaling; Hypertension; IP3 Receptor; NFAT Transcription Factor; Vascular Smooth Muscle Cells.


Figures

FIGURE 1.
FIGURE 1.
Increased expression and functional contribution of vascular IP3Rs in experimental hypertension. A, measurement of SBP at base line and after infusion of SAL or Ang II to establish AHT. SBP was recorded by tail cuff plethysmography at base line (day 0) and at 7 and 14 days after infusion. SBP was significantly increased in AHT compared with SAL mice at 7 and 14 days (n = 12). B, immunoblot analysis of IP3R in lysates from mouse MA. Artery lysate from SAL (control) and AHT mice was added to each lane (3 animals/group). C, relative protein density after normalization to GAPDH shows that IP3R1 immunoreactivity was 2.4-fold higher in MA of AHT compared with SAL mice (n = 6). D, quantitative mRNA expression reveals a 1.8-fold increase of IP3R1 transcript in arteries of AHT compared with SAL mice (n = 4–6). Ct values were normalized to the Ct value of the amplification standard β-actin, which was similarly expressed between MA of SAL and AHT mice. E, representative traces showing changes in vessel diameter in response to increasing concentrations of PE (gray dots). Isolated second order MA from SAL and AHT mice were cannulated and pressurized to 60 mm Hg, and diameter was recorded on-line by edge detection. After washout (WO), PE-induced contractions were repeated in the presence of 2-APB (50 μm) (right). F, concentration-response curves to PE in MA from SAL and AHT mice in the presence (+2-APB) or absence of 2-APB. PE-induced contraction was enhanced in arteries of AHT mice (n = 8 and 6). PE-induced contraction was inhibited by 2-APB in MA from both SAL and AHT mice (n = 8 and 6). *, significant difference between SAL and AHT; @, significant difference between SAL and SAL+2-APB; #, significant difference between AHT and AHT+2-APB. G, arteries from AHT mice showed an increased 2-APB-sensitive component of PE-induced contraction compared with SAL mice (n = 6 and 8). The 2-APB-sensitive component was calculated by subtracting concentration-dependent contractions to PE obtained in the presence of 2-APB from those obtained in the absence of the blocker. Error bars, S.E. *, p ≤ 0.05.
FIGURE 2.
FIGURE 2.
Screening of Ca2+-handling proteins reveals coupled up-regulation of the vascular IP3R and LTCC in experimental models of hypertension. A, immunoblot analysis of IP3R1, α1C, TRPC1, TRPC4, Orai1, and STIM1 in lysates from mouse MA. MA lysate pooled from three SAL or AHT mice was added to each lane. Increased expression levels of IP3R1, α1C, and TRPC4 are detected in MA of AHT mice, whereas levels of TRPC1, Orai1, and STIM1 were similar. B, agarose gel analysis of products obtained after PCRs for IP3R1 (274 bp), α1C (185 bp), and TRPC4 (226 bp) using specific primers. α-Actin (152 bp) and vWF (178 bp) were used as VSM and endothelial cell markers, respectively. IP3R, α1C, and α-actin were detected both in intact MA and isolated VSM cells as expected. In contrast, TRPC4 and vWF were detected in arteries but not isolated VSM cells, implying expression only in endothelium. C, immunoblots comparing the expression of IP3R, α1C, PMCA, and α-actin (as a loading control) between MA from normotensive Wistar Kyoto rats (WKY) and SHR and between MA from sham-operated and aortic-banded (Band) hypertensive rats. In each case, lysates were pooled from arteries of three or four rats. Only the IP3R and α1C proteins are up-regulated in MA from hypertensive SHR and aortic-banded rats. Blots are representative of three experiments.
FIGURE 3.
FIGURE 3.
Depolarization of A7r5 cells for 24 h replicates the induction of IP3R and α1C observed in VSM cells of hypertensive animals in vivo. A–E, immunoblot analyses of IP3R, PMCA, and α1C. Proteins were isolated from A7r5 cells and separated on SDS-PAGE, and the blots were probed for the appropriate antigens as indicated. A, IP3R1 expression is increased in A7r5 cells exposed to K20, K40, or K60 for 24 h but not in cells treated with NaCl or sucrose (Sucr) as osmolar controls. Depolarization-induced IP3R up-regulation is lost in the presence of the LTCC blocker, Nif (10 μm). Expression levels of PMCA are unchanged. B, the expression level of α1C is significantly increased in A7r5 cells incubated with K20 or K40 for 24 h but not in cells exposed to sucrose or 10 μm Nif (n = 3). C, expression levels of TRPC1, STIM1, and α-actin are not altered in A7r5 cells depolarized for 24 h by 20K. D, right blot shows that IP3R1 up-regulates in A7r5 cells exposed to 20K or treated with Thaps (1 μm) for 24 h. The up-regulation of IP3R1 by K20 is blocked by 10 μg/ml CHX or 10 μm ACD. Blots are representative of at least three independent experiments. Smooth muscle-specific α-actin was used as a loading control. E, relative immunodensity of the IP3R1 after normalization to α-actin. Cell depolarization with K20 or treatment with Thaps (1 μm) for 24 h increases IP3R1 expression, and this response is lost in the presence Nif (10 μm), CHX (10 μg/ml), ACD (10 μm), or CsA (10 μm) (n = 3–21; *, p < 0.05; **, p < 0.01). F, transcriptional up-regulation of IP3R1, IP3R3, and α1C in A7r5 cells depolarized by K20 for 24 h. Real-time PCR plots represent relative quantification. G, nuclear translocation of NFATc1 in A7r5 cells. Cells were transfected with plasmids expressing EGFP-NFATc1 and imaged using a confocal laser-scanning microscopy. At rest (Con), NFATc1 showed a basal cytoplasmic localization, but treatment with Thaps (1 μm) or K20 alone or in the presence of CHX (10 μg/ml), ACD (10 μm), or CsA (10 μm) promotes its nuclear translocation. In contrast, incubation of cells with 10 μm Nif or CsA prevents K20-induced nuclear translocation of NFATc1. Data are representative of four independent experiments. Scale bar, 20 μm. Error bars, S.E.
FIGURE 4.
FIGURE 4.
Ca2+ dynamics in response to acute KCl depolarization of A7r5 cells. Cells were loaded with Fura 2-AM and bathed in Ca2+-containing HBS. Imaging was performed as described under “Experimental Procedures.” A, acute membrane depolarization by K20 results in a global rise in intracellular Ca2+, which is inhibited by Nif (10 μm) but not by ACD (10 μm), CHX (10 μg/liter), or CsA (10 μm). Traces represent average fluorescence intensity of 15–20 individual cells. B, quantitation of the K20-induced Ca2+ rise as maximal Fura-2 ratio from base line (ΔF340/F380, n = 4–6; **, p < 0.01). C, basal intracellular Ca2+ levels were significantly increased in A7r5 cells after 24 h exposure to K20 or 1 μm Thaps. The osmolarity controls NaCl and sucrose did not alter resting Ca2+ levels in A7r5 cells. The addition of Nif (10 μm), CHX (10 μg/liter), ACD (10 μm), or CsA (10 μm) before depolarization by K20 prevents the elevation of basal Ca2+ level (n = 3–12; *, p < 0.05; **, p < 0.01). Error bars, S.E.
FIGURE 5.
FIGURE 5.
IP3R up-regulation sensitizes IP3-dependent Ca2+ release and VSM contraction. A, PE concentration-response curve for Ca2+ release in control (Con) A7r5 cells or similar cells depolarized by K20 for 24 h to up-regulate IP3R. Cells were loaded with Fura2-AM and bathed in Ca2+-containing HBS, and images were acquired using an epifluorescence microscope. At low PE concentrations, the two groups of cells had similar fluorescence amplitudes. At PE concentrations above 5 μm, K20-pretreated cells showed higher fluorescence amplitude than control. Values are the mean of fluorescence intensity of 15–20 individual cells for each group given as the relative change in Fura2 fluorescence ratio (ΔF340/F380) (n = 3–5, mean ± S.E.; *, p < 0.05; **, p < 0.01). B–E, kinetics of IP3-dependent Ca2+ release evoked by UV photorelease of ciIP3 in A7r5 cells bathed in Ca2+-containing HBS and loaded with ciIP3 and Ca-Green-1. ciIP3 was uncaged by repeated exposure of cells to UV illumination (100 ms every 1.5 s), and the fluorescence of Ca-Green was recorded in real time. B, in a subset of cells, ciIP3 uncaging caused an initial global sustained Ca2+ transient followed by Ca2+ oscillations in both control and 20K-pretreated cells. Cells in both groups also responded to ciIP3 uncaging by a monotonic Ca2+ rise without Ca2+ oscillations. C, the maximal IP3-dependent Ca2+ release was increased in K20-pretreated cells exhibiting enriched IP3R (n = 8; *, p < 0.05). D, the percentage of oscillating cells (n = 8–10; ***, p < 0.0001), oscillation frequency/min (n = 5–8; ***, p < 0.0001), and duration of oscillations (n = 5–7; *, p = 0.05) were enhanced in K20-pretreated cells. E, the time to threshold Ca2+ signal was shortened in K20-pretreated cells compared with control (n = 8; **, p < 0.001). F, contractile responses of A7r5 cells to PE (20 μm) in Ca2+-containing HBS were evaluated by imaging of contractile fiber formation. PE results in a transient contractile response in control cells, whereas the contractile response in 20K-pretreated cells is more pronounced and sustained. G, statistical analysis of the maximal contractile response to PE of control and K20-pretreated A7r5 cells (n = 4; **, p < 0.05). Error bars, S.E.

References

    1. Chockalingam A. (2008) World Hypertension Day and global awareness. Can. J. Cardiol. 24, 441–444 - PMC - PubMed
    1. Oparil S., Zaman M. A., Calhoun D. A. (2003) Pathogenesis of hypertension. Ann. Intern. Med. 139, 761–776 - PubMed
    1. Rizzoni D., Agabiti-Rosei E. (2012) Structural abnormalities of small resistance arteries in essential hypertension. Intern. Emerg. Med. 7, 205–212 - PubMed
    1. Lemarié C. A., Tharaux P. L., Lehoux S. (2010) Extracellular matrix alterations in hypertensive vascular remodeling. J. Mol. Cell Cardiol. 48, 433–439 - PubMed
    1. House S. J., Potier M., Bisaillon J., Singer H. A., Trebak M. (2008) The non-excitable smooth muscle. Calcium signaling and phenotypic switching during vascular disease. Pflugers Arch. 456, 769–785 - PMC - PubMed

Publication types

MeSH terms