. 2013 Nov 22;288(47):33760-33771.
doi: 10.1074/jbc.M113.513804. Epub 2013 Oct 4.

Analysis of hyperekplexia mutations identifies transmembrane domain rearrangements that mediate glycine receptor activation

Affiliations

Analysis of hyperekplexia mutations identifies transmembrane domain rearrangements that mediate glycine receptor activation

Anna Bode et al. J Biol Chem. .

Abstract

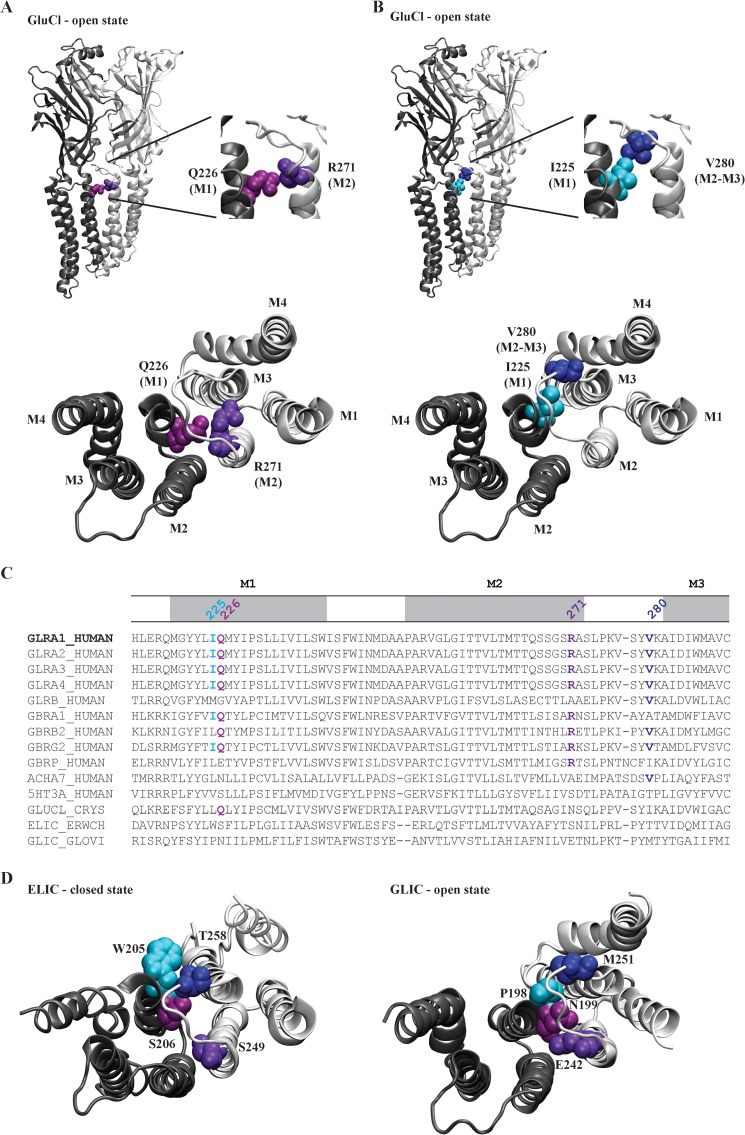
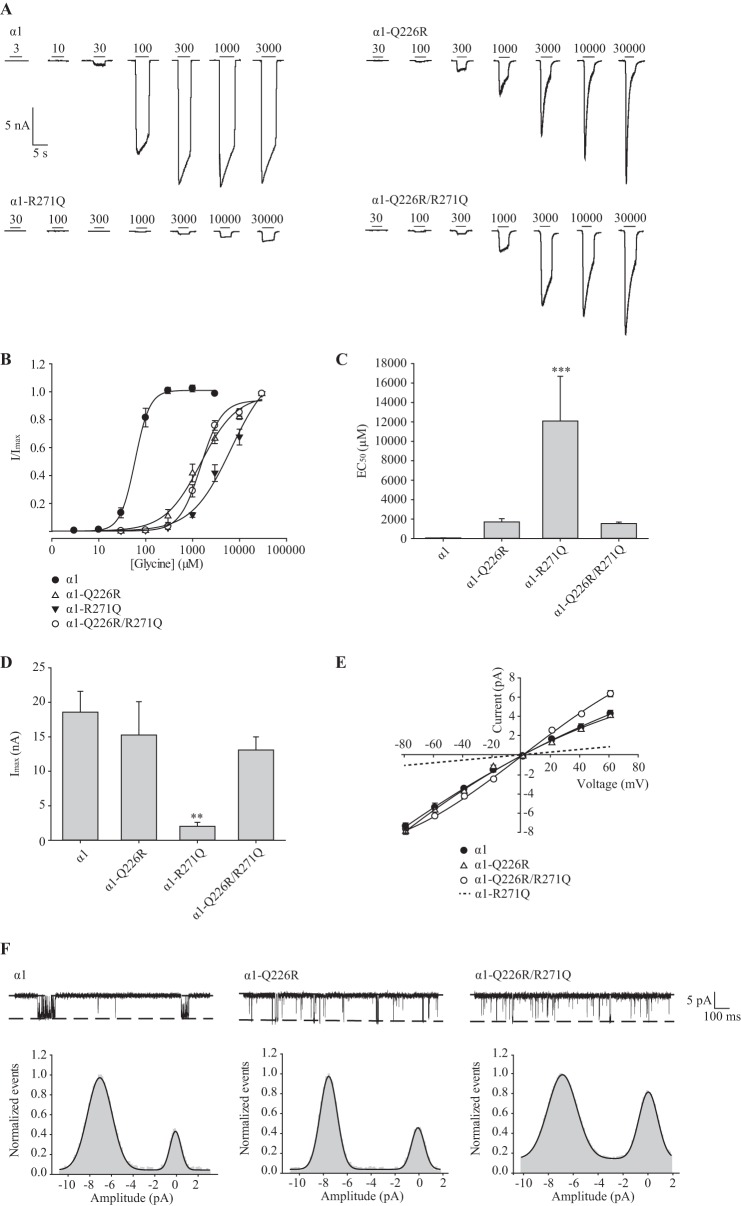
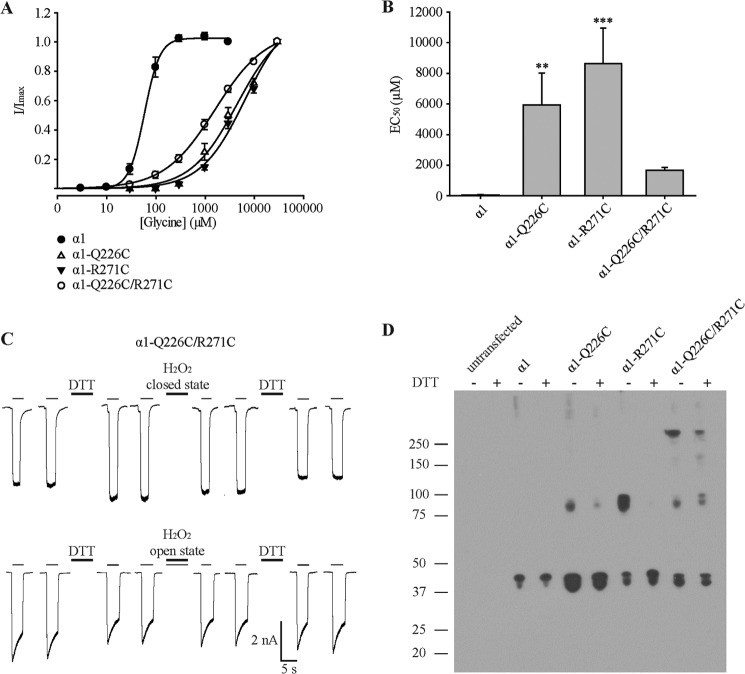
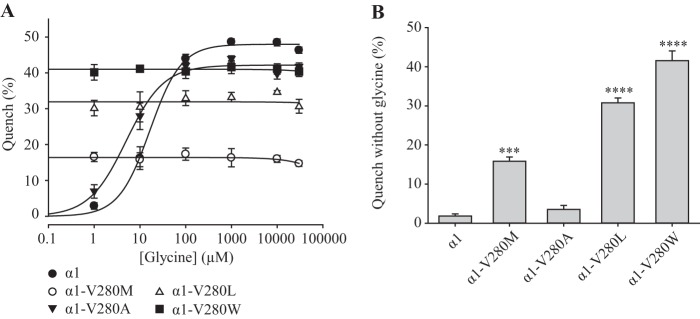
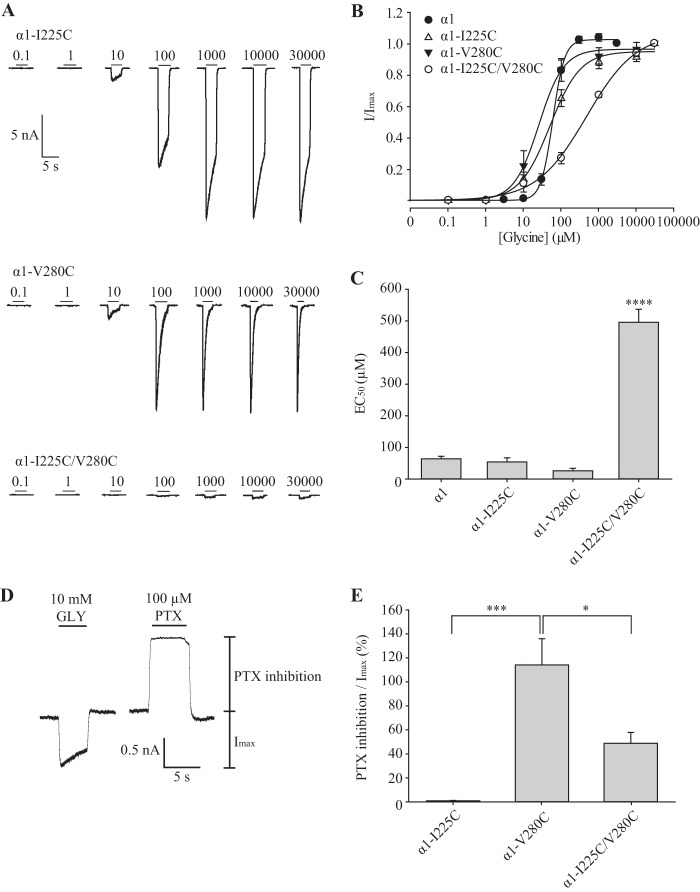
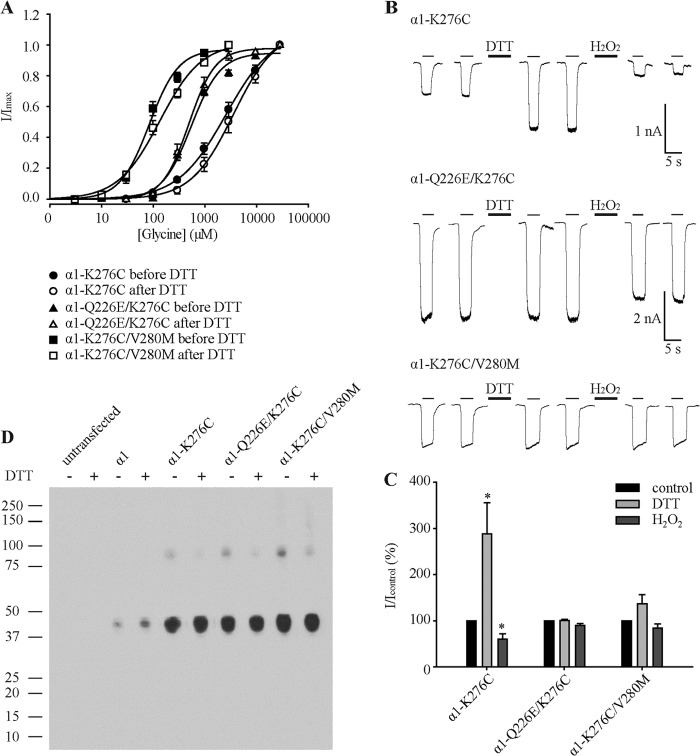
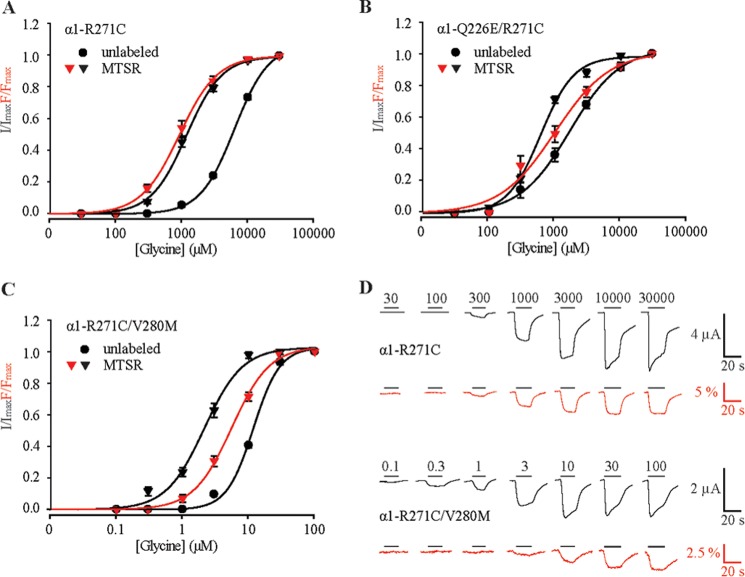
Pentameric ligand-gated ion channels (pLGICs) mediate numerous physiological processes and are therapeutic targets for a wide range of clinical indications. Elucidating the structural differences between their closed and open states may help in designing improved drugs that bias receptors toward the desired conformational state. We recently showed that two new hyperekplexia mutations, Q226E and V280M, induced spontaneous activity in α1 glycine receptors. Gln-226, located near the top of transmembrane (TM) 1, is closely apposed to Arg-271 at the top of TM2 in the neighboring subunit. Using mutant cycle analysis, we inferred that Q226E induces activation via an enhanced electrostatic attraction to Arg-271. This would tilt the top of TM2 toward TM1 and hence away from the pore axis to open the channel. We also concluded that the increased side chain volume of V280M, in the TM2-TM3 loop, exerts a steric repulsion against Ile-225 at the top of TM1 in the neighboring subunit. We infer that this steric repulsion would tilt the top of TM3 radially outwards against the stationary TM1 and thus provide space for TM2 to relax away from the pore axis to create an open channel. Because the transmembrane domain movements inferred from this functional analysis are consistent with the structural differences evident in the x-ray atomic structures of closed and open state bacterial pLGICs, we propyose that the model of pLGIC activation as outlined here may be broadly applicable across the eukaryotic pLGIC receptor family.

Keywords: Cys Loop Receptors; Glycine Receptors; Patch Clamp; Receptor Structure-Function; Site-directed Mutagenesis.


Figures

FIGURE 1.
FIGURE 1.
Location of residues hypothesized to interact with the α1 GlyR residues, Gln-226 and Val-280. A, model of the C. elegans α GluClR (Protein Data Bank code 3RIF) showing two neighboring subunits (colored light and dark gray, respectively), with residues homologous to α1 GlyR Gln-226 and Arg-271 colored light and dark purple, respectively. The lower panel shows the view toward the membrane from the extracellular space with the ECD removed. B, same structure and orientations as in A, but with residues homologous to α1 GlyR Ile-225 and Val-280 colored light and dark blue, respectively. C, multiple sequence alignment of the TMD regions indicated pLGIC receptors with Gln-226 and Val-280 and their interacting residues colored as in A and B. D, model structures of ELIC (left; Protein Data Bank code 2VLO) and GLIC (right; Protein Data Bank code 3EAM) showing two neighboring subunits (colored light and dark gray, respectively) viewed toward the membrane from the extracellular space with the ECD removed. As in A and B, residues homologous to α1 GlyR Gln-226, Arg-271, Ile-225, and Val-280 are colored light and dark purple and light and dark blue, respectively.
FIGURE 2.
FIGURE 2.
Electrophysiological characterization of Q226R, R271Q, and Q226R/R271Q mutant α1 GlyRs. A, examples of currents activated by the indicated glycine concentrations for each receptor type. In this and subsequent figures, thin horizontal bars indicate the duration of glycine applications and numbers represent glycine concentration in μm. B, averaged normalized glycine dose-response relationships for the four receptors. C, mean glycine EC50 values. ***, p < 0.001 relative to α1 GlyR via one-way ANOVA followed by Dunnett's post hoc test. D, mean maximal glycine-mediated current amplitudes. **, p < 0.01 relative to α1 GlyR via one-way ANOVA followed by Dunnett's post hoc test. E, averaged single-channel current-voltage relationships for the indicated receptors recorded in outside-out patches. The wild type, Q226R, and Q226R/R271Q GlyRs exhibited mean single-channel conductance values of 92 ± 4 pS (n = 3), 99 ± 4 pS (n = 6), and 98 ± 3 pS (n = 6), respectively. These values were not significantly different from each other using one-way ANOVA followed by Tukey's post hoc test. The R271Q current-voltage relationship, shown previously to be 15 pS (26, 28), is indicated as a dashed line. F, sample single-channel activations in wild type, Q226R, and Q226R/R271Q GlyRs recorded at −80 mV. Channel openings are downward, with dashed lines denoting the main open conductance level. Channel amplitude histograms are also displayed. In this analysis we only included sections of recording in which the channel exhibited a stable transition from one conductance level to another. We did not include sections of record containing unresolved channel openings. Because the histograms reveal an absence of stable openings at subconductance levels, we infer that the brief openings of reduced magnitude were mostly unresolved larger amplitude events curtailed by filtering.
FIGURE 3.
FIGURE 3.
Electrophysiological and biochemical characterization of Q226C, R271C, and Q226C/R271C mutant α1 GlyRs. A, averaged normalized glycine dose-response relationships for the four receptors. B, mean glycine EC50 values. **, p < 0.01; ***, p < 0.001 relative to α1 GlyR via one-way ANOVA followed by Dunnett's post hoc test. C, examples of current traces activated by EC50 glycine (1.5 mm) in Q226C/R271C GlyRs. The first two traces in each row were recorded from a naïve cell. Subsequent traces were recorded following 1-min applications of 2 mm DTT or 0.3% H2O2 (together with EC50 glycine for the lower trace) as indicated. Averaged results are presented in the text. D, Western blot of wild type, Q226C, R271C, and Q226C/R271C mutant α1 GlyRs in the absence and presence of 100 mm DTT as indicated. A protein preparation from untransfected cells is included as a control. The numbers on the left represent size in kDa. Similar results were obtained in blots performed on three separate protein preparations.
FIGURE 4.
FIGURE 4.
Functional characterization of α1 GlyRs incorporating mutations at Val-280. A, glycine dependence of fluorescent quench for the wild type, V280M, V280A, V280L, and V280W mutant GlyRs using the YFP-I152L anion influx assay. The percentage quench is equal to (1 − final fluorescence/control fluorescence) × 100%. All displayed data points represent the average quench from three experiments with three wells each and >200 cells/well. B, mean percentage quench in the absence of glycine for the indicated receptors. ***, p < 0.001; ****, p < 0.0001 relative to α1 GlyR via one-way ANOVA followed by Dunnett's post hoc test.
FIGURE 5.
FIGURE 5.
Electrophysiological characterization of I225C, V280C and I225C/V280C mutant α1 GlyRs. A, examples of currents activated by indicated glycine concentrations for each receptor type. B, averaged normalized glycine dose-response relationships for wild type and indicated mutant receptors. C, mean glycine EC50 values. ****, p < 0.0001 relative to α1 GlyR via one-way ANOVA followed by Dunnett's post hoc test. D, sample trace for V280C mutant α1 GlyRs showing the maximal glycine-induced current amplitude and the inhibition of the leak current by 100 μm picrotoxin. E, magnitude of picrotoxin-inhibited current expressed as a percentage to the maximal glycine-gated current amplitude. *, p < 0.05; ***, p < 0.001 relative to α1 GlyR via one-way ANOVA followed by Dunnett's post hoc test. PTX, picrotoxin.
FIGURE 6.
FIGURE 6.
Effects of Q226E and V280M on GlyR dimerization via K276C cross-links. A, averaged normalized glycine dose-response relationships for wild type and indicated mutant receptors before and after the application of 2 mm DTT. B, sample current recordings of K276C, Q226E/K276C, and K276C/V280M GlyRs activated by EC50 glycine (3,000, 500, and 90 μm, respectively). The first two traces were recorded from a naïve cell. Subsequent traces were recorded following 1-min applications of 2 mm DTT or 0.3% H2O2 as indicated. C, normalized glycine EC50 current amplitudes of K276C, Q226E/K276C, and K276C/V280M GlyRs before and after the application of DTT and H2O2. The normalized currents are represented as percentages. p values were calculated relative to the control current with a paired t test. *, p < 0.05. D, Western blot of wild type, Q226C, R271C, and Q226C/R271C mutant α1 GlyRs in the absence and presence of 100 mm DTT as indicated. A protein preparation from untransfected cells is included as a control. The numbers on the left represent size in kDa. Similar results were obtained in blots performed on three separate protein preparations.
FIGURE 7.
FIGURE 7.
Effects of Q226E and V280M on conformational changes near TM2 as determined by voltage clamp fluorometry. A–C, averaged normalized glycine dose-response relationships for both current (black triangles) and fluorescence (red triangles) at MTSR-labeled R271C, Q226E/R271C, and R271C/V280M GlyRs using voltage clamp fluorometry. Current dose-response relationships for unlabeled receptors are also shown (black circles). Mean parameters of best fit to individual dose-response relations are presented in Table 2. D, examples of simultaneous current (black) and fluorescence (red) recordings from oocytes expressing labeled R271C GlyRs (upper traces) and R271C/V280M GlyRs (lower traces).

References

    1. Dutertre S., Becker C. M., Betz H. (2012) Inhibitory glycine receptors. An update. J. Biol. Chem. 287, 40216–40223 - PMC - PubMed
    1. Lynch J. W. (2004) Molecular structure and function of the glycine receptor chloride channel. Physiol. Rev. 84, 1051–1095 - PubMed
    1. Lynch J. W. (2009) Native glycine receptor subtypes and their physiological roles. Neuropharmacology 56, 303–309 - PubMed
    1. Fritschy J. M., Harvey R. J., Schwarz G. (2008) Gephyrin. Where do we stand, where do we go? Trend. Neurosci. 31, 257–264 - PubMed
    1. Specht C. G., Izeddin I., Rodriguez P. C., El Beheiry M., Rostaing P., Darzacq X., Dahan M., Triller A. (2013) Quantitative nanoscopy of inhibitory synapses. Counting gephyrin molecules and receptor binding sites. Neuron 79, 308–321 - PubMed

Publication types

Substances

LinkOut - more resources