. 2013;9(10):e1003683.
doi: 10.1371/journal.ppat.1003683. Epub 2013 Oct 3.

Contribution of host intracellular transport machineries to intercellular movement of turnip mosaic virus

Affiliations

Contribution of host intracellular transport machineries to intercellular movement of turnip mosaic virus

Maxime Agbeci et al. PLoS Pathog. 2013.

Abstract

The contribution of different host cell transport systems in the intercellular movement of turnip mosaic virus (TuMV) was investigated. To discriminate between primary infections and secondary infections associated with the virus intercellular movement, a gene cassette expressing GFP-HDEL was inserted adjacent to a TuMV infectious cassette expressing 6K₂:mCherry, both within the T-DNA borders of the binary vector pCambia. In this system, both gene cassettes were delivered to the same cell by a single binary vector and primary infection foci emitted green and red fluorescence while secondarily infected cells emitted only red fluorescence. Intercellular movement was measured at 72 hours post infiltration and was estimated to proceed at an average rate of one cell being infected every three hours over an observation period of 17 hours. To determine if the secretory pathway were important for TuMV intercellular movement, chemical and protein inhibitors that blocked both early and late secretory pathways were used. Treatment with Brefeldin A or Concanamycin A or expression of ARF1 or RAB-E1d dominant negative mutants, all of which inhibit pre- or post-Golgi transport, reduced intercellular movement by the virus. These treatments, however, did not inhibit virus replication in primary infected cells. Pharmacological interference assays using Tyrphostin A23 or Wortmannin showed that endocytosis was not important for TuMV intercellular movement. Lack of co-localization by endocytosed FM4-64 and Ara7 (AtRabF2b) with TuMV-induced 6K₂-tagged vesicles further supported this conclusion. Microfilament depolymerizing drugs and silencing expression of myosin XI-2 gene, but not myosin VIII genes, also inhibited TuMV intercellular movement. Expression of dominant negative myosin mutants confirmed the role played by myosin XI-2 as well as by myosin XI-K in TuMV intercellular movement. Using this dual gene cassette expression system and transport inhibitors, components of the secretory and actomyosin machinery were shown to be important for TuMV intercellular spread.


Conflict of interest statement

The Samuel Roberts Noble Foundation is an independent, nonprofit institute headquartered in Ardmore, Oklahoma. Founded in 1945, the Noble Foundation conducts direct operations, including assisting farmers and ranchers, and conducting plant science research and agricultural programs, to enhance agricultural productivity regionally, nationally and internationally. The Foundation has no competing interests influencing the other authors (i.e. they support only work of RSN as an employee). The funder, Noble Foundation, did not influence the study design, collection, analysis and interpretation of data, writing of the paper or the decision to submit the manuscript for publication. This does not alter our adherence to all PLoS Pathogens policies on sharing data and materials.

Figures

Figure 1
Figure 1. TuMV intercellular movement time course.
(A) Schematic representation of the plasmid pCambiaTuMV/6K2:mCherry//GFP-HDEL used to discriminate primary infected cells from secondary infected cells after agroinfiltration. cDNA coding for 6K2:mCherry was inserted between P1 and HCPro cistrons. (B) Image of a leaf under uv illumination. Green fluorescing zone shows agroinfiltrated area. (C) Three-dimensional rendering of 35 1 µm thick confocal image sections that overlap by 0.5 µm showing the distribution of TuMV-induced 6K2:mCherry-tagged structures and GFP-HDEL labeled at 72 hpinf. The TuMV-induced 6K2:mCherry-tagged structures represent the viral factories, and the circular green structure in the center of the cell is the nucleus. Scale bar = 20 µm. (D) Three-dimensional Tile imaging rendering of N. benthamiana leaf agroinfiltrated 60 hrs before with A. tumefaciens strain Agl1 containing the above plasmid. The confocal image tiles was formed using the 10× objective by assembly 12×12 images in xy and the three-dimensional rendering was created by 5 z stacks of 90 µm thick confocal images that overlap by 45 µm. Left panel, red fluorescence channel imaging TuMV producing 6K2:mCherry; middle panel, green fluorescence channel imaging GFP-HDEL; and right panel, merged images. (E–G) Same infiltrated area as in D but confocal images were taken at 4, 5 and 6 dpinf. Scale bar = 2.5 mm.
Figure 2
Figure 2. The secretory pathway is required for intercellular movement.
N. benthamiana leaves were infiltrated with DMSO (A), 10 µg/ml BFA (B) and 0.5 µM CMA (C) 4 hours before agroinfiltration with A. tumefaciens containing pCambiaTuMV/6K2:mCherry//GFP-HDEL. All images were taken at 4 dpinf. Left panel, red fluorescence channel imaging TuMV producing 6K2:mCherry; middle panel, green fluorescence channel imaging GFP-HDEL; and right panel, merged images. Scale bar = 200 µm. (D) Surface area of red-only fluorescent foci was calculated and expressed in fluorescence units. (E) Fluorescence intensity ratio of red over green foci was calculated and expressed in fluorescence units. Bars represent means and standard errors for 20 replicates per treatment. One-way analysis of variance calculation followed by Tukey's Multiple Comparison Test allowed analysis of differences between means: **, 0.001<P value<0.01.
Figure 3
Figure 3. Inhibition of TuMV intercellular movement by dominant negative mutants of secretory pathway factors.
N. benthamiana leaves were agroinfiltrated with A. tumefaciens containing plasmids pCambiaTuMV/6K2:mCherry//GFP-HDEL alone (A) or with dominant negative mutant ARF1(NI) (B) or with RAB-E1d (NI) (C). All images were taken at 4 dpinf. Left panel, red fluorescence channel imaging TuMV producing 6K2:mCherry; middle panel, green fluorescence channel imaging GFP-HDEL; and right panel, merged images. Scale bar = 200 µm. (D) Surface area of red-only fluorescent foci was calculated and expressed in fluorescence units. (E) Fluorescence intensity ratio of red over green foci was calculated and expressed in fluorescence units. Bars represent means and standard errors for 20 replicates per treatment. One-way analysis of variance calculation followed by Tukey's Multiple Comparison Test allowed analysis of differences between means: ***, P value<0.0001.
Figure 4
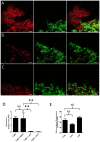
Figure 4. TuMV intercellular movement does not depend on the endocytic pathway.
N. benthamiana leaves were infiltrated with DMSO (A), 20 µM Wortmannin (B), 30 µM Tyrphostin A51 (C) and 30 µM Tyrphostin A23 (D) 4 hours before agroinfiltration with A. tumefaciens containing pCambiaTuMV/6K2:mCherry//GFP-HDEL. Images were taken at 4 dpinf. Left panel, red fluorescence channel imaging TuMV producing 6K2:mCherry; middle panel, green fluorescence channel imaging GFP-HDEL; and right panel, merged images. Scale bar = 200 µm. (E) Surface area of red-only fluorescent foci was calculated and expressed in fluorescence units. Bars represent means and standard errors for 15 replicates per treatment. One-way analysis of variance calculation followed by Tukey's Multiple Comparison Test allowed analysis of differences between means: NS, not significant.
Figure 5
Figure 5. TuMV 6K2-tagged vesicles do not colocalize with endocytic markers.
Three-dimensional rendering of 22 1 µm thick confocal images that overlap by 0.5 µm of N. benthamiana agroinfiltrated leaves. (A) shows the distribution of TuMV-induced 6K2:mCherry-tagged structures and YFP labeled Ara7 dots. Left panels; red fluorescence channel imaging TuMV producing 6K2:mCherry, middle panel; green fluorescence channel imaging YFP-RabF2b, and right panel; merged images. (B) shows the distribution of TuMV-induced 6K2:GFP-tagged structures and FM4-64 labeled vesicles. Left panel shows green fluorescence channel from TuMV producing 6K2:GFP, middle panel red fluorescence channel from FM4-64, and right panel merged images. Images were taken at 4 dpinf. Scale bar = 20 µm.
Figure 6
Figure 6. Microfilament network is required for TuMV intercellular movement.
N. benthamiana leaves were infiltrated with DMSO (A), 5 µM LatB (B), and 10 µM CytD (C) 4 hours before agroinfiltration with A. tumefaciens containing pCambiaTuMV/6K2:mCherry//GFP-HDEL. Images were taken at 4 dpinf. Left panel, red fluorescence channel imaging TuMV producing 6K2:mCherry; middle panel, green fluorescence channel imaging GFP-HDEL; and right panel, merged images. Scale bar = 200 µm. (D) Surface area of red-only fluorescent foci was calculated and expressed in fluorescence units. (E) Fluorescence intensity ratio of red over green foci was calculated and expressed in fluorescence units. Bars represent means and standard errors for 20 replicates per treatment. One-way analysis of variance calculation followed by Tukey's Multiple Comparison Test allowed analysis of differences between means: NS, not significant, **, 0.001<P value<0.01.
Figure 7
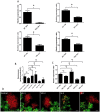
Figure 7. Myosin XI-2 is implicated in TuMV intercellular movement.
(A) Quantitative RT-PCR was used to determine the relative expression ratio of target genes (myosin VIII-1, myosin VIII-2, myosin XI-2, and myosin XI-F) in N. benthamiana infected with the indicated TRV silencing constructs versus a TRV control not expressing a myosin fragment. (B) N. benthamiana leaves silenced for individual myosin genes (myosin VIII-1, myosinVIII-2, myosin XI-2, and myosin XI-F) were agroinfiltrated with pCambiaTuMV/6K2:mCherry//GFP-HDEL and surface area of red-only fluorescent foci was calculated and expressed in fluorescence units at 4 dpinf. Wild-type TRV (TRV) or buffer (Mock) were used as controls. Bars represent means and standard errors for 10 replicates per treatment. One-way analysis of variance calculation followed by Tukey's Multiple Comparison Test allowed analysis of differences between means: NS, not significant; *, P<0.05. (C) Level of expression of non-target myosins in N. benthamiana leaves silenced for myosin XI-2. The internal loading control for each sample was actin-2. Expression analysis was performed on extracts from systemic leaves at 20 dpinf with TRV constructs. Bars represent means and standard errors for three replicates per treatment. One-way analysis of variance calculation followed by Tukey's Multiple Comparison Test allowed analysis of differences between means: = NS, not significant; *, P<0.05. The experiment was repeated twice for each TRV silencing construct. (D) images of pCambiaTuMV/6K2:mCherry//GFP-HDEL in N. benthamiana leaves silenced for individual myosin genes (VIII1, VIII-2, XI-2, XI-F). Scale bar = 200 µm.
Figure 8
Figure 8. Myosin XI-2 and XI-K are implicated in TuMV intercellular movement.
N. benthamiana leaves were agroinfiltrated with dominant negative myosin mutants and 24 h later with pCambiaTuMV/6K2:mCherry//GFP-HDEL. (A) Surface area of red-only fluorescent was calculated and expressed in fluorescence units at 4 dpinf. Bars represent means and standard errors for 21 replicates per treatment. (B) Fluorescence intensity ratio of red over green foci was calculated and expressed in fluorescence units. One-way analysis of variance calculation followed by Tukey's Multiple Comparison Test allowed analysis of differences between means: = NS, not significant, ***, 0.0001<P value<0.001. (C) Images of pCambiaTuMV/6K2:mCherry//GFP-HDEL in N. benthamiana leaves expressing dominant-negative myosin mutants (VIII1, XI-2, XI-F and XI-K). Scale bar = 200 µm.

References

    1. Maule AJ, Benitez-Alfonso Y, Faulkner C (2011) Plasmodesmata - membrane tunnels with attitude. Curr Opin Plant Biol 14: 683–690. - PubMed
    1. Niehl A, Heinlein M (2011) Cellular pathways for viral transport through plasmodesmata. Protoplasma 248: 75–99. - PubMed
    1. Benitez-Alfonso Y, Faulkner C, Ritzenthaler C, Maule AJ (2010) Plasmodesmata: gateways to local and systemic virus infection. Mol Plant Microbe Interact 23: 1403–1412. - PubMed
    1. Schoelz JE, Harries PA, Nelson RS (2011) Intracellular transport of plant viruses: finding the door out of the cell. Molecular Plant 4: 813–831. - PMC - PubMed
    1. Kawakami S, Watanabe Y, Beachy RN (2004) Tobacco mosaic virus infection spreads cell to cell as intact replication complexes. Proc Natl Acad Sci U S A 101: 6291–6296. - PMC - PubMed

Publication types

MeSH terms