

Integrated enrichment analysis of variants and pathways in genome-wide association studies indicates central role for IL-2 signaling genes in type 1 diabetes, and cytokine signaling genes in Crohn's disease
- PMID: 24098138
- PMCID: PMC3789883
- DOI: 10.1371/journal.pgen.1003770
Integrated enrichment analysis of variants and pathways in genome-wide association studies indicates central role for IL-2 signaling genes in type 1 diabetes, and cytokine signaling genes in Crohn's disease
Abstract
Pathway analyses of genome-wide association studies aggregate information over sets of related genes, such as genes in common pathways, to identify gene sets that are enriched for variants associated with disease. We develop a model-based approach to pathway analysis, and apply this approach to data from the Wellcome Trust Case Control Consortium (WTCCC) studies. Our method offers several benefits over existing approaches. First, our method not only interrogates pathways for enrichment of disease associations, but also estimates the level of enrichment, which yields a coherent way to promote variants in enriched pathways, enhancing discovery of genes underlying disease. Second, our approach allows for multiple enriched pathways, a feature that leads to novel findings in two diseases where the major histocompatibility complex (MHC) is a major determinant of disease susceptibility. Third, by modeling disease as the combined effect of multiple markers, our method automatically accounts for linkage disequilibrium among variants. Interrogation of pathways from eight pathway databases yields strong support for enriched pathways, indicating links between Crohn's disease (CD) and cytokine-driven networks that modulate immune responses; between rheumatoid arthritis (RA) and "Measles" pathway genes involved in immune responses triggered by measles infection; and between type 1 diabetes (T1D) and IL2-mediated signaling genes. Prioritizing variants in these enriched pathways yields many additional putative disease associations compared to analyses without enrichment. For CD and RA, 7 of 8 additional non-MHC associations are corroborated by other studies, providing validation for our approach. For T1D, prioritization of IL-2 signaling genes yields strong evidence for 7 additional non-MHC candidate disease loci, as well as suggestive evidence for several more. Of the 7 strongest associations, 4 are validated by other studies, and 3 (near IL-2 signaling genes RAF1, MAPK14, and FYN) constitute novel putative T1D loci for further study.
Conflict of interest statement
The authors have declared that no competing interests exist.
Figures
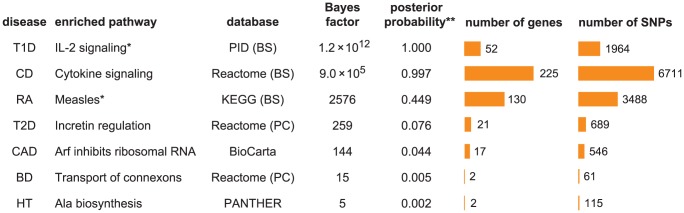
 and 4.6 for RA and T1D, respectively. Number of genes/SNPs for RA and T1D count only non-MHC genes assigned to pathway. **Illustrative posterior probability assuming a “conservative” prior (see text).
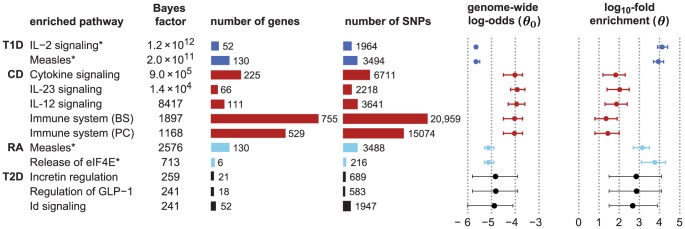
 ) and log-fold enrichment (
 ) given that pathway is enriched (
 ). Note that enrichment level is defined on log-scale (eq. 2), so
  indicates enrichment. Credible interval is smallest interval about mean that contains parameter with 95% posterior probability, calculated to nearest 0.1 using a numerical approximation. Database identifiers for pathways not previously mentioned: “IL23-mediated signaling events” (PID il23pathway, PC); “IL12-mediated signaling events” (PID il12_2pathway, PC); “Immune system” (Reactome 6900, BS 106386); “Release of eIF4E” (Reactome 6836, PC); “Synthesis, secretion, and inactivation of glucagon-like peptide-1” (Reactome 24019, PC); “Id signaling pathway” (WikiPathways WP53 , BS 198871). See Figure S1 for more gene set enrichment results.
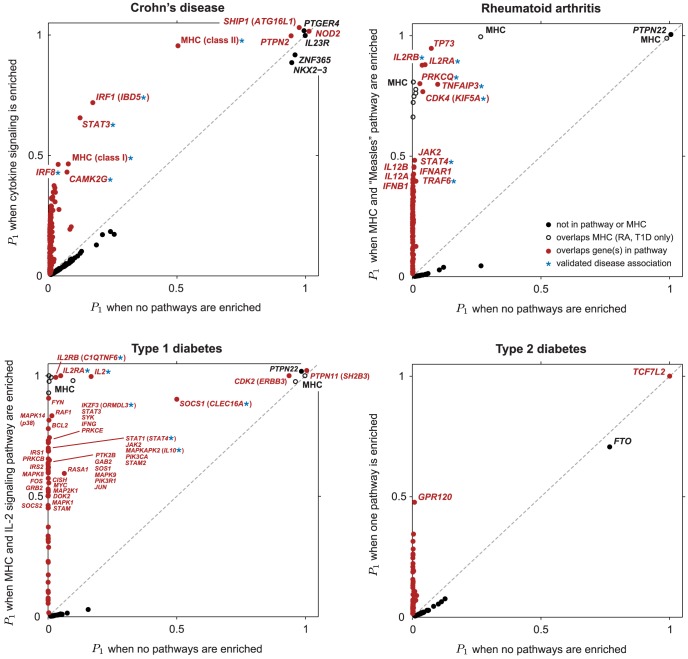
 along vertical axis is obtained by averaging over top 5 pathways (see Methods). Points highlighted in red correspond to segments overlapping SNPs assigned to the enriched pathway (for T2D, at least 1 out of 5 top pathways). In RA and T1D, 50-SNP segments overlapping the MHC are drawn as open circles (SNPs in these segments are not assigned to the pathway). Overlapping segments sharing the same association signal are not shown. Some segments are labeled by gene(s) in pathway and/or most credible gene of interest based on prior studies (most credible gene is shown in parentheses if different from pathway gene). Asterisk (*) indicates an appreciable increase in the probability of a disease association, and this association is validated by other GWAS for same disease (see Table 1).
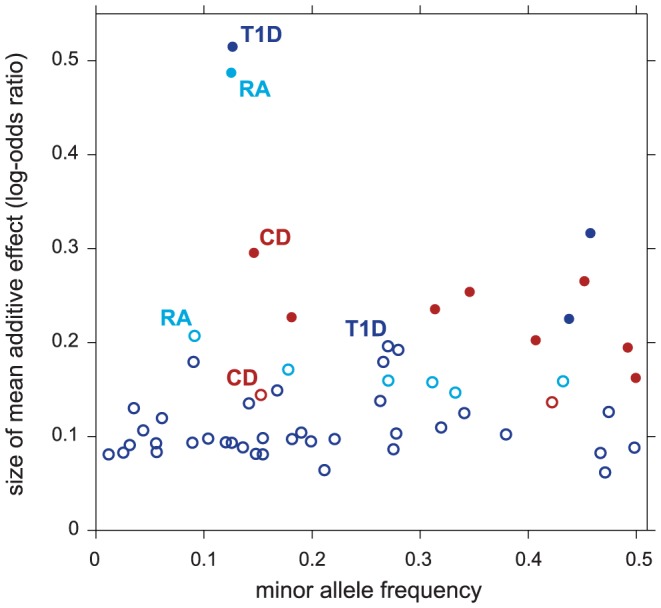
 . Filled circles correspond to selected regions containing disease risk factors without feedback from enriched pathways (
 ); open circles correspond to selected regions conditioned on enrichment (
 and
and  ). For each segment, minor allele frequency and posterior mean additive effect of minor allele count on log-odds of disease (“log-odds ratio”) are taken from SNP in segment with highest probability of being included in multi-marker model.
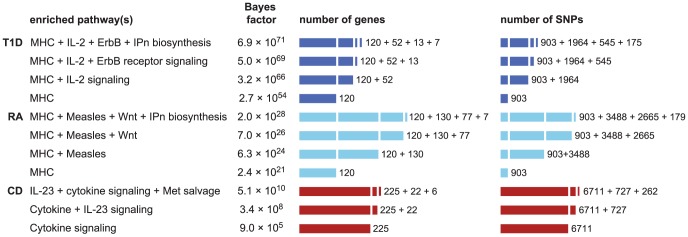
 .
.References
-
- Frazer KA, Murray SS, Schork NJ, Topol EJ (2009) Human genetic variation and its contribution to complex traits. Nature Reviews Genetics 10: 241–251. - PubMed
-
- McCarthy MI, Abecasis GR, Cardon LR, Goldstein DB, Little J, et al. (2008) Genome-wide association studies for complex traits: consensus, uncertainty and challenges. Nature Reviews Genetics 9: 356–369. - PubMed
-
- Pearson TA, Manolio TA (2008) How to interpret a genome-wide association study. Journal of the American Medical Association 299: 1335–1344. - PubMed
Publication types
MeSH terms
Substances
Grants and funding
LinkOut - more resources
Full Text Sources
Other Literature Sources
Medical
Research Materials
Miscellaneous
