. 2013;9(10):e1003804.
doi: 10.1371/journal.pgen.1003804. Epub 2013 Oct 3.

Identification of 526 conserved metazoan genetic innovations exposes a new role for cofactor E-like in neuronal microtubule homeostasis

Affiliations

Identification of 526 conserved metazoan genetic innovations exposes a new role for cofactor E-like in neuronal microtubule homeostasis

Melissa Y Frédéric et al. PLoS Genet. 2013.

Abstract

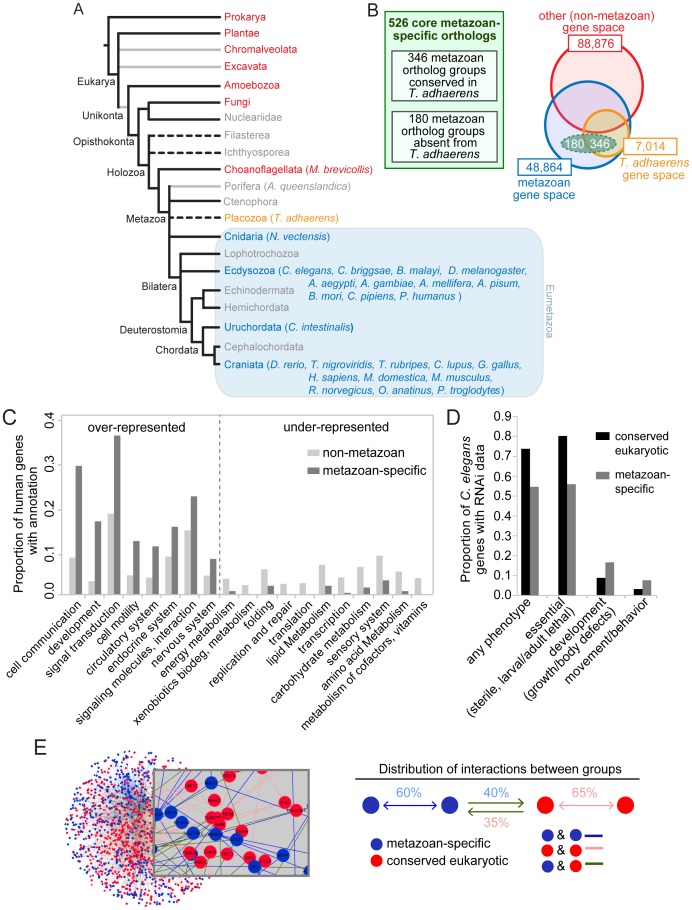
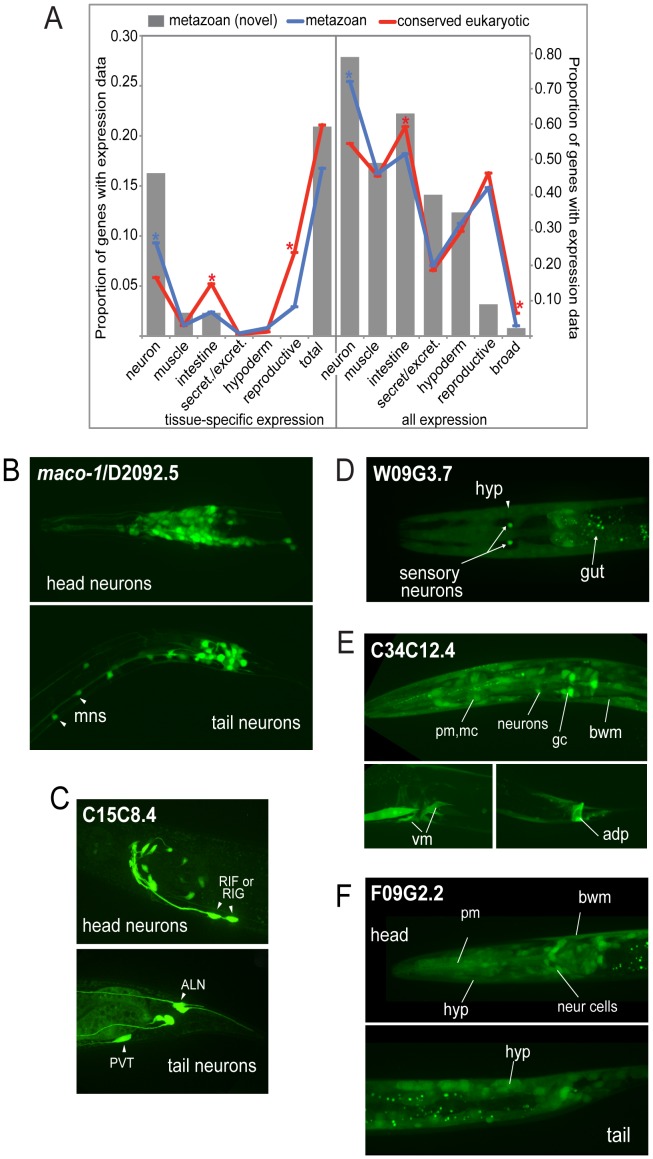
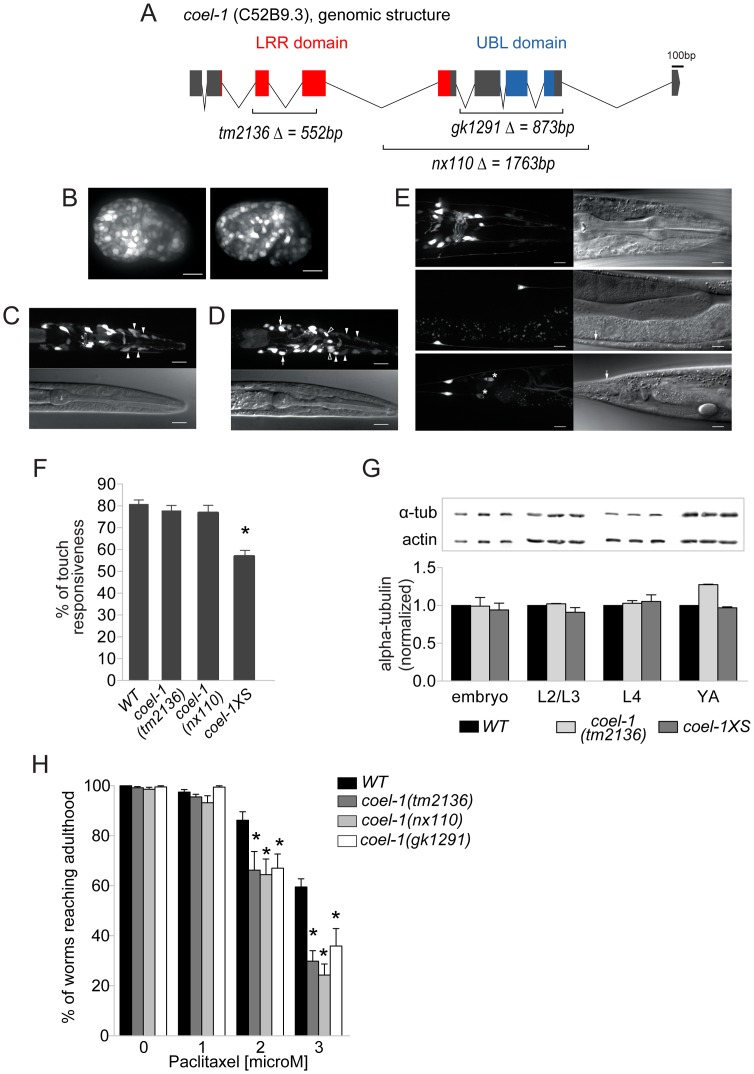
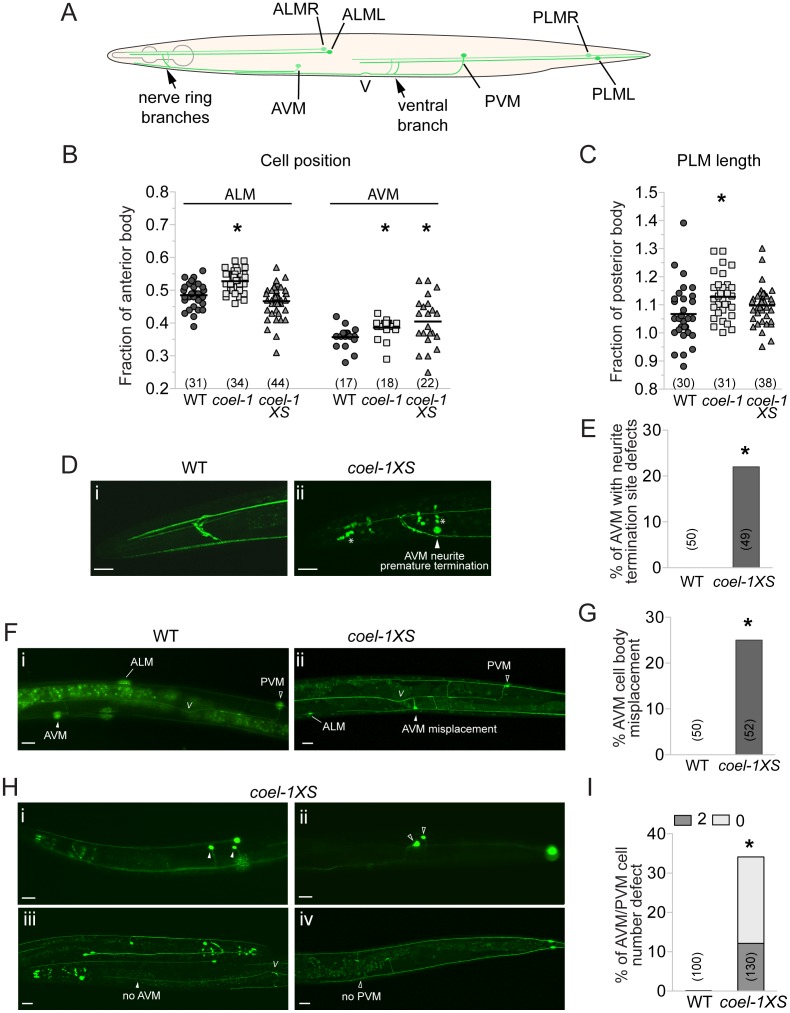
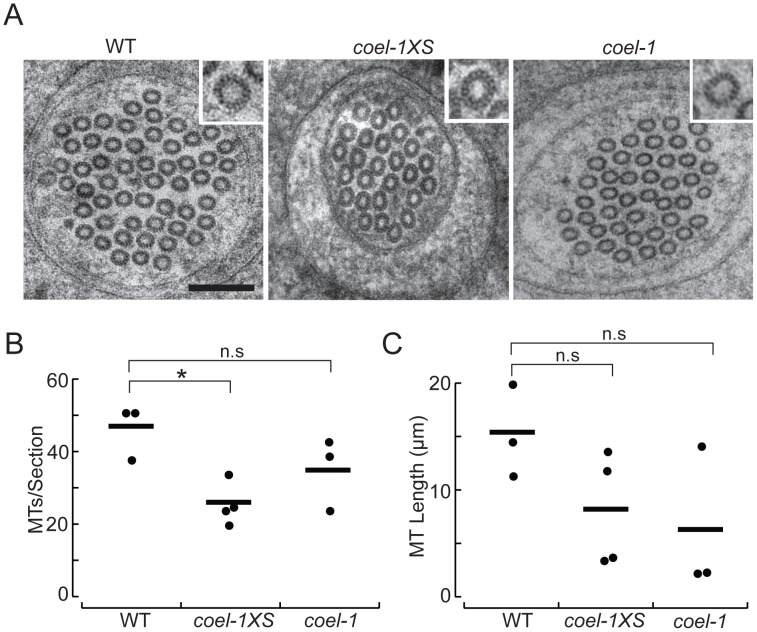
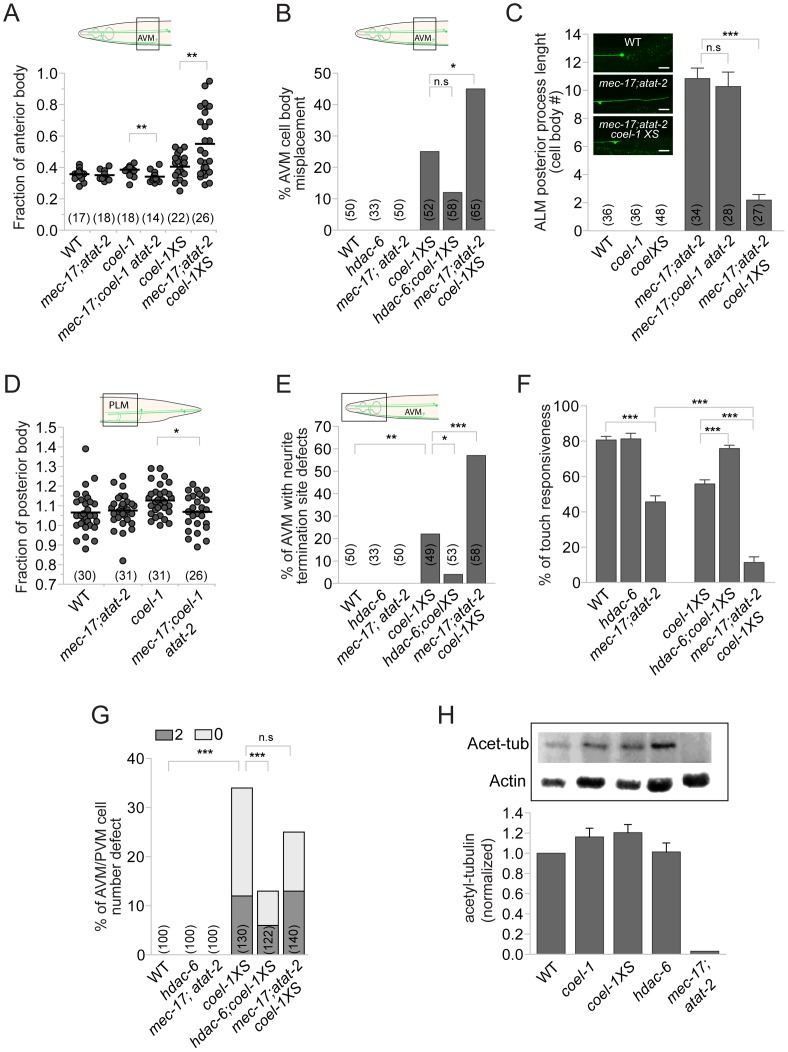
The evolution of metazoans from their choanoflagellate-like unicellular ancestor coincided with the acquisition of novel biological functions to support a multicellular lifestyle, and eventually, the unique cellular and physiological demands of differentiated cell types such as those forming the nervous, muscle and immune systems. In an effort to understand the molecular underpinnings of such metazoan innovations, we carried out a comparative genomics analysis for genes found exclusively in, and widely conserved across, metazoans. Using this approach, we identified a set of 526 core metazoan-specific genes (the 'metazoanome'), approximately 10% of which are largely uncharacterized, 16% of which are associated with known human disease, and 66% of which are conserved in Trichoplax adhaerens, a basal metazoan lacking neurons and other specialized cell types. Global analyses of previously-characterized core metazoan genes suggest a prevalent property, namely that they act as partially redundant modifiers of ancient eukaryotic pathways. Our data also highlights the importance of exaptation of pre-existing genetic tools during metazoan evolution. Expression studies in C. elegans revealed that many metazoan-specific genes, including tubulin folding cofactor E-like (TBCEL/coel-1), are expressed in neurons. We used C. elegans COEL-1 as a representative to experimentally validate the metazoan-specific character of our dataset. We show that coel-1 disruption results in developmental hypersensitivity to the microtubule drug paclitaxel/taxol, and that overexpression of coel-1 has broad effects during embryonic development and perturbs specialized microtubules in the touch receptor neurons (TRNs). In addition, coel-1 influences the migration, neurite outgrowth and mechanosensory function of the TRNs, and functionally interacts with components of the tubulin acetylation/deacetylation pathway. Together, our findings unveil a conserved molecular toolbox fundamental to metazoan biology that contains a number of neuronally expressed and disease-related genes, and reveal a key role for TBCEL/coel-1 in regulating microtubule function during metazoan development and neuronal differentiation.


Conflict of interest statement

The authors have declared that no competing interests exist.

Figures

Figure 1
Figure 1. Identification and established functions/interactions of a set of 526 ortholog groups strictly conserved in metazoans.
A. Phylogeny of species used to identify the metazoan-specific genes. Grey lines represent possible paraphyletic groups. Dotted lines represent groups of uncertain phylogenetic position. Metazoan groups are colored blue or orange, non-metazoan groups are colored red, and groups that were not included in the analysis are colored grey. All included metazoan species are shown in parentheses; for a complete list of non-metazoan genomes used see Ortho-MCL website. Tree not drawn to scale. B. Comparative genomics approach used to identify the metazoan-specific genes (the ‘metazoanome’). 526 ortholog groups (dashed green oval) were identified on the basis of being conserved in 24 well-sequenced metazoan genomes and absent from 112 well-sequenced non-metazoan genomes. Of these 526 ortholog groups, 346 contained a T. adhaerens ortholog (orange circle) and 180 did not. As a comparison to the small number of core metazoan-specific genes, the size of the gene space (total numbers of homologous protein families with at least two members, paralogs included) in metazoan (blue circle) and non-metazoan (red circle) organisms are indicated. Not drawn to scale. C. KEGG functional categories containing disproportionately high or low numbers of human metazoan-specific orthologs. The proportion of metazoan-specific genes belonging to each category is compared with the proportion of human genes in the KEGG database belonging to the same functional category. Categories for which there is a statistically significant difference within a functional category are shown (p<0.05 hypergeometric test with Bejamini-Hochburg multiple hypothesis correction). D. RNAi phenotypes of the metazoan-specific genes in C. elegans. Fractions of metazoan-specific genes and conserved eukaryotic genes associated with each RNAi phenotype group, are compared. Phenotypic groups are described in the Materials and Methods section. Any phenotype shown relative to the total number of genes with RNAi data. Other phenotypes shown as proportional to the number of genes that display any phenotype. For all four phenotypic groups there is a statistically significant difference between the two sets of genes (Fisher exact test, p<0.001). E. Functional interactions analysis. Network representing interactions between metazoan-specific genes, conserved eukaryotic genes and between those two groups. Nodes (representing genes) are colored according to their phylogenetic class: metazoan-specific (blue) and conserved core-eukaryotic (red); edges represent interactions. Distribution of the average proportion of interactions for the two sets of genes. Metazoan-specific and conserved eukaryotic genes interact approximately equally with each other.
Figure 2
Figure 2. Expression patterns of metazoan-specific genes in C. elegans.
A. Global analysis of expression patterns of metazoan and widely conserved eukaryotic genes. Expression patterns were categorized as neuronal, muscle, intestinal, secretory/excretory, hypodermal or reproductive, and quantified using GExplore . The left panel shows only tissue-specific expression and the right panel shows all expression. Grey bars show novel metazoan-specific expression patterns determined in this study, blue lines show expression patterns of metazoan-specific genes (previously characterized plus the 43 novel expression patterns collected in this study), and red lines show expression patterns of widely conserved eukaryotic genes. Asterisks indicate statistically-significant differences between metazoan (blue) and conserved eukaryotic (red) genes (p<0.05, Fischer's exact test). B–F. Sampling of novel expression patterns of genes investigated in this study. (B) Pan-neuronal expression of D2092.5 (maco-1), ortholog of macoilin, a transmembrane and coiled-coil domain-containing protein. Our data are consistent with studies published during the course of our investigation that showed neuronal-specific expression pattern for this protein and an involvement in neuronal functions in C. elegans , , motoneurons (mns) in the ventral nerve cord are indicated. (C) Neuronal-specific expression of C15C8.4, homolog of LRPAP1 a low-density lipoprotein receptor-related protein tentatively associated with degenerative dementia . Cells expressing C15C8.4 includes RIF or RIG, RIS, 8–10 additional head neurons, and PVT/ALN (a pair of tail neurons), (intestine staining here is unspecific). (D) W09G3.7, homolog of WBSCR16 a predicted RCC1-like nucleotide exchange factor is expressed in a few tissues, hypoderm, intestine and a pair of sensory neurons. (E) C34C12.4, homolog of human C4orf34, is expressed in a subset of neurons in the head, body wall muscle (bwm), intestinal cells, gland cells (gc), vulva muscle and anal depressor (adp). (F) Nearly ubiquitous expression of F09G2.2, a cyclin domain-containing protein homolog to human C2orf34; neuronal and non-neuronal cells in head and tail, pharyngeal muscle (pm), body wall muscle, hypoderm, intestinal cells. Except for D2092.5, the genes are functionally uncharacterized.
Figure 3
Figure 3. coel-1 is expressed ubiquitously in embryos but largely confined to neurons in adults, and plays a role in microtubule stability and touch responsiveness.
A. Gene structure of coel-1 (C52B9.3) and nature of the mutant alleles used in this study (tm2136, gk1291 and nx110). B–E. Expression of coel-1 across C. elegans development. Transgenic expression of coel-1 transcriptional GFP reporter in (B) elongating embryos (left panel: early elongation; right panel: comma stage), (C,D) young larvae (white arrows indicate probable expression in the AIZ interneurons, closed arrowheads indicate probable sheath cells, open arrowheads indicate unidentified cells) and (E) head (top panels), body (middle panels) and tail regions (bottom panels) of a mature adult worm. In panel E, note anterior projections from the neurons located laterally along the body wall (ALM) that continue into the head. White arrows indicate cell bodies of probable PLM cells, asterisks show crosstalk into the GFP channel from sra-6::dsRED2 in the PVQ neurons. The absence of fluorescence from the nucleus suggests that this signal is in fact derived from the sra-6::dsRED2 transgene rather than coel-1-driven GFP reporter gene, which contains a nuclear localization signal. In all images, anterior is to the right and ventral is down except for B where anterior is left. Top panels in B and C and right ones in D are GFP images, bottom panels in B and C and left ones in D are DIC images. Scale bar represents 10 µm. F. Worms overexpressing coel-1 (coel-1XS) but not coel-1(tm2136) or coel-1(nx110) mutant worms have a decreased response to gentle body touch. (n≥30 worms/genotype) *p≤0.001 versus wild-type (WT = N2) (Student's t-test). G. Quantitative western blot analyses of total α-tubulin using an antibody directed against all α-tubulins in C. elegans. Developmental stages of worms are indicated. Actin represents a loading control. Comparative western blots of coel-1(tm2136) mutant worms and coel-1XS worms vs. wild-type were carried out, and representative blots for each tested stage are shown. Bars are normalized to WT intensity (n≥3). No statistically significant difference is observed (Student's t-test p>0.05). H. coel-1 mutant animals are hypersensitive to taxol, a microtubule-stabilizing anticancer agent. Approximately 100 eggs wild-type (N2), coel-1(tm2136), (nx110) or gk1291 were incubated at room temperature on plate containing the indicated paclitaxel concentration for 4 days, and worms able to develop to gravid adults were counted. Each genotype was tested in three separate trials; *, p≤0.05 Two-way ANOVA followed by Bonferroni post-test. Bars in all panels represent mean ± SEM.
Figure 4
Figure 4. Touch receptor neuron (TRN) morphology, position and number defects in the coel-1 overexpression and deletion strains.
A. Schematic representation of wild-type morphology of the 6 mechanosensory neurons of C. elegans. B. ALM and AVM cell bodies are misplaced posteriorly in coel-1 mutants compared to wild-type animals. Only AVM cell bodies are misplaced in coel-1XS animals. Each data point represents the distance from each cell body to the back of the pharynx divided by the length of the anterior body, (i.e., from the tip of the nose to the vulva). C. PLM neurites in coel-1 mutants are statistically significantly longer than in wild-type. Values indicated represent the length of each PLM neurite divided by the length of the posterior body (i.e., from the vulva to the tail). In panels B and C, the horizontal bar corresponds to the mean of all data points. D. Typical anterior neurite termination site in wild-type worms expressing zdIs5 (mec-4::GFP), a TRN-specific reporter. (i) example of AVM neurite premature termination (arrowhead) at the nerve ring observed in coel-1XS animals; (ii) asterisks show crosstalk into the GFP channel from dpy-30::dsRED, a co-marker used for the coel-1 overexpression strain. E. Quantitative analysis of the AVM termination site defect in animals overexpressing coel-1. F. In wild-type animals, one AVM and one PVM are observed and AVM is localized anterior to ALM cell bodies. (i) example of AVM mispositioning in coel-1XS animals, where AVM is found posterior to the vulva; (ii) Quantification of AVM position defect is presented in G. H. AVM/PVM cell number defect in coel-1XS animals. Images shown are of animals with two cells or no cell in AVM (i, iii) and/or PVM (ii, iv); positions are shown and the quantification is reported in I. Scale bar represents 20 µm. V, vulva; WT, wild-type. Brackets indicate the number of neurons measured or scored. *, p≤0.05, Fisher exact test.
Figure 5
Figure 5. coel-1 activity influences microtubule number and length, but not protofilament count in PLM touch receptor neurons.
A. High-resolution electron micrographs of thin (50 nm) sections of PLM touch receptor neurons in wild-type (WT), coel-1XS and coel-1(tm2136) animals. Insets show a single microtubule profile, revealing the protofilaments. Scale bar, 100 nm. B. Number of MTs per section as a function of genotype. Bars are the mean values and filled circles are the average values in each dataset. C. Microtubule length as a function of genotype. Bars are the mean and filled circles are the number of serial section datasets tested. Microtubule (MT) length computed from: L = 2Na/T, where N = the average number of MTs/section, a = total length of serial reconstruction and T = number of MT endpoints observed . In panels B and C, a total of at least 7 µm was reconstructed for each genotype. *, p<0.05, Wilcoxon-Rank test compared to wild-type; n.s, not significantly different.
Figure 6
Figure 6. coel-1 interacts genetically with regulators of tubulin acetylation.
A–B. Loss of tubulin acetylation in the mec-17;atat-2 double mutant suppresses the effect of coel-1 deletion on AVM cell body positioning, and enhances the phenotype caused by overexpression of coel-1. C. Images showing that the normally small or non-existent ALM posterior process (top panel) extends abnormally in mec-17;atat-2 animals (middle panel), a phenotype that is rescued by the overexpression of coel-1 (bottom panel). The graph shows the quantitation of the average length of the process expressed in cell body equivalent +/− SEM. D. PLM length defect in coel-1 animals is suppressed when combined with mec-17;atat-2 mutations. E–F. hdac-6 and mec-17;atat-2 mutations respectively suppress, or enhance, the AVM neurite termination defect (E) and the touch sensitivity response (F) observed in coel-1XS animals. The mean of touch sensitivity responses ± SEM is represented (n≥30 worms/genotype). G. AVM/PVM cell number defect (extra = 2 or missing = 0) in the coel-1XS animals are reduced significantly by the hdac-6, but not the mec-17;atat-2 mutations. H. Quantitative western blot analyses of total acetylated α-tubulin (Acet-tub) using the 6-11B-1 antibody on lysates from young adults. Actin served as loading control and was used to normalize the amounts of protein loaded between samples. Data are normalized to WT (wild-type) intensity (n = 3) and error bars are SEM. No statistically significant difference is observed between coel-1, coel-1XS or hdac-6 compared to wild-type. The positive control strain, mec-17;atat-2, as expected lacks acetylated tubulin. Brackets indicate the total number of neurons scored. Statistical significances were determined using Student's t-test for all panels except B, E and G for which Fisher's exact test was used. *, p≤0.05, **; p≤0.005; ***, p≤0.0005; n.s = not significant.

References

    1. Michod RE, Viossat Y, Solari CA, Hurand M, Nedelcu AM (2006) Life-history evolution and the origin of multicellularity. J Theor Biol 239: 257–272. - PubMed
    1. Rokas A (2008) The origins of multicellularity and the early history of the genetic toolkit for animal development. Annu Rev Genet 42: 235–251. - PubMed
    1. Shalchian-Tabrizi K, Minge MA, Espelund M, Orr R, Ruden T, et al. (2008) Multigene phylogeny of choanozoa and the origin of animals. PLoS One 3: e2098. - PMC - PubMed
    1. Ruiz-Trillo I, Burger G, Holland PW, King N, Lang BF, et al. (2007) The origins of multicellularity: a multi-taxon genome initiative. Trends Genet 23: 113–118. - PubMed
    1. Putnam NH, Srivastava M, Hellsten U, Dirks B, Chapman J, et al. (2007) Sea anemone genome reveals ancestral eumetazoan gene repertoire and genomic organization. Science 317: 86–94. - PubMed

Publication types

Substances

LinkOut - more resources