

Mortality and life expectancy in homeless men and women in Rotterdam: 2001-2010
- PMID: 24098329
- PMCID: PMC3788767
- DOI: 10.1371/journal.pone.0073979
Mortality and life expectancy in homeless men and women in Rotterdam: 2001-2010
Abstract
Background: Data on mortality among homeless people are limited. Therefore, this study aimed to describe mortality patterns within a cohort of homeless adults in Rotterdam (the Netherlands) and to assess excess mortality as compared to the general population in that city.
Methods: Based on 10-year follow-up of homeless adults aged ≥ 20 years who visited services for homeless people in Rotterdam in 2001, and on vital statistics, we assessed the association of mortality with age, sex and type of service used (e.g. only day care, convalescence care, other) within the homeless cohort, and also compared mortality between the homeless and general population using Poisson regression. Life tables and decomposition methods were used to examine differences in life expectancy.
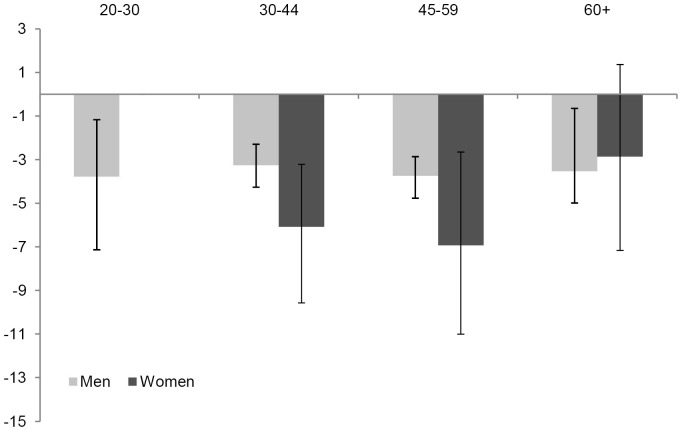
Results: During follow-up, of the 2096 adult homeless 265 died. Among the homeless, at age 30 years no significant sex differences were found in overall mortality rates and life expectancy. Compared with the general Rotterdam population, mortality rates were 3.5 times higher in the homeless cohort. Excess mortality was larger in women (rate ratio [RR] RR 5.56, 95% CI 3.95-7.82) as compared to men (RR 3.31, 95% CI 2.91-3.77), and decreased with age (RR 7.67, 95% CI 6.87-8.56 for the age group 20-44 and RR 1.63, 95% CI 1.41-1.88 for the age group 60+ years). Life expectancy at age 30 years was 11.0 (95% CI 9.1-12.9) and 15.9 (95% CI 10.3-21.5) years lower for homeless men and women compared to men and women in the general population respectively.
Conclusion: Homeless adults face excessive losses in life expectancy, with greatest disadvantages among homeless women and the younger age groups.
Conflict of interest statement
Figures
References
-
- Beijer U, Andreasson S, Agren G, Fugelstad A (2011) Mortality and causes of death among homeless women and men in Stockholm. Scand J Public Health 39: 121–127. - PubMed
-
- Hibbs JR, Benner L, Klugman L, Spencer R, Macchia I, et al. (1994) Mortality in a cohort of homeless adults in Philadelphia. N Engl J Med 331: 304–309. - PubMed
-
- Hwang SW (2000) Mortality among men using homeless shelters in Toronto, Ontario. JAMA 283: 2152–2157. - PubMed
Publication types
MeSH terms
LinkOut - more resources
Full Text Sources
Other Literature Sources
Medical
