. 2013 Oct 1;8(10):e75065.
doi: 10.1371/journal.pone.0075065. eCollection 2013.

Validation of DTI tractography-based measures of primary motor area connectivity in the squirrel monkey brain

Affiliations

Validation of DTI tractography-based measures of primary motor area connectivity in the squirrel monkey brain

Yurui Gao et al. PLoS One. .

Abstract

Diffusion tensor imaging (DTI) tractography provides noninvasive measures of structural cortico-cortical connectivity of the brain. However, the agreement between DTI-tractography-based measures and histological 'ground truth' has not been quantified. In this study, we reconstructed the 3D density distribution maps (DDM) of fibers labeled with an anatomical tracer, biotinylated dextran amine (BDA), as well as DTI tractography-derived streamlines connecting the primary motor (M1) cortex to other cortical regions in the squirrel monkey brain. We evaluated the agreement in M1-cortical connectivity between the fibers labeled in the brain tissue and DTI streamlines on a regional and voxel-by-voxel basis. We found that DTI tractography is capable of providing inter-regional connectivity comparable to the neuroanatomical connectivity, but is less reliable measuring voxel-to-voxel variations within regions.


Conflict of interest statement

Competing Interests: The authors have declared that no competing interests exist.

Figures

Figure 1
Figure 1. Functional map of the primary motor cortex (M1) used to guide BDA injections.
Cortical sites marked as white dots were stimulated by micro electrode, which evoked body movements of the anesthetized monkey. Letter(s) above each dot indicate the specific movement(s) corresponding to this stimulation site. The number below each dot represents the current threshold (in units of µA) needed to evoke the movement. Thick dashed lines indicate approximate borders of M1, which were identified by the magnitude of threshold (thresholds lower than approximately 40 µA were used to infer the M1 region). Thin dashed lines indicate approximate borders between M1 body representation areas. Black squares show the BDA injection sites covering the forearm movement representation area.
Figure 2
Figure 2. Pipeline for detecting and counting interface-crossing BDA-labeled fibers.
Grayscale 4× micrograph (B) covering a specific ROI (iPM in this example), aligned to the corresponding 0.5× micrograph (A) in standard micrograph space. (B) shows manually drawn markers (red dots) used to identify the WGM boundary. (C) shows the fit of the markers to a continuous curve (yellow). (D) shows segmented BDA-labeled fibers (those with color contours) that touch the WGM boundary along with their numerical index (red numbers beside the fibers).
Figure 3
Figure 3. Maps of color-coded primary diffusion direction (red = Right/Left, green = Anterior/Posterior, and blue = Superior/Inferior) and scalar FA value (CC-corpus callosum, IC-internal capsule and AC-anterior commissure).
Figure 4
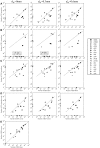
Figure 4. Relationship between tractography-histology variables as well as histology-histology variables.
(A–C) show streamline vs. BDA-labeled fiber data; (D) shows streamline terminals vs. soma data; and (E) shows BDA-labeled soma vs. fiber data. DS (A and D), FSL1 (B) and FSL2 (C) schemes were used to obtain tractography-derived streamlines when dw is 0, 0.3 and 0.6 mm. Proportional relationships were fit based on least squares regression. The correlation coefficients (with corresponding p values) of the regressions are listed in Table 1.
Figure 5
Figure 5. Dorsal view of the inter-regional connectivity backbones.
(A), (B) and (C) show the BDA-labeled fiber, DS and FSL2 derived (dw = 0.6 mm) connectivity backbones, respectively. Green and blue nodes indicate the center of mass of the injection and individual projection regions, respectively. The radius of each node is scaled by the square root of the volumes of the corresponding region. The thickness of each edge represents the logarithmic connection strength and the color of the edge is coded according to connection weight (strength divided by volume of the projection region).
Figure 6
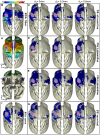
Figure 6. Dorsal view of 3D DDMs rendered on the WGM interface.
(A) shows the territories of all the ROIs and the BDA injection region (upper-dorsal view; bottom-ventral view). (B) shows the BDA fiber DDM and (C–E) show respectively the streamline DDMs using DS, FSL1 and FSL2 tractography schemes (in rows) with different dw (in columns). (F) shows BDA soma DDM and (G) shows streamline terminal DDMs with different dw (in columns). Note that some hot spots in (B) are obscured in this view. All data are presented in Fig. 4 and the Tables.
Figure 7
Figure 7. Three dimensional diffusion isosurfaces overlaid on BDA-labeled fibers in crossing fiber regions.
Background of (A) is the high resolution BDA micrograph (4×) of the white matter under the injection/seed region. Diffusion isosurfaces calculated from the tensors are color-coded according to anatomical orientation and scaled in size by the local FA. (B) and (C) show details immediately under the injection region (IR) and in deeper white matter, respectively.
Figure 8
Figure 8. FSL2 outputs overlaid on a FA map.
(A) Coronal slice showing the FSL2 density map (dw = 0.6 mm) superimposed on a grayscale FA map. The white curve labels the WGM interface. (B) and (C) show an enlarged region in the superior part of contralateral hemisphere. Blue and red lines in (C) represent dominant fiber orientations, estimated by the FSL bedpost tool.

References

    1. Basser PJ, Mattiello J, Lebihan D (1994) MR diffusion tensor spectroscopy and imaging. Biophysical Journal 66: 259–267. - PMC - PubMed
    1. Stejskal EO, Tanner JE (1965) Spin diffusion measurements: Spin echoes in the presence of a time-dependent field gradient. Journal of Chemical Physics 42: 288–292.
    1. Beaulieu C (2002) The basis of anisotropic water diffusion in the nervous system - a technical review. NMR in Biomedicine 15: 435–455. - PubMed
    1. Mori S, Zhang JY (2006) Principles of diffusion tensor imaging and its applications to basic neuroscience research. Neuron 51: 527–539. - PubMed
    1. Basser PJ, Pajevic S, Pierpaoli C, Duda J, Aldroubi A (2000) In vivo fiber tractography using DT-MRI data. Magnetic Resonance in Medicine 44: 625–632. - PubMed

Publication types

LinkOut - more resources