. 2013 Oct 2;8(10):e76299.
doi: 10.1371/journal.pone.0076299. eCollection 2013.

DNA methylation mediates persistent epileptiform activity in vitro and in vivo

Affiliations

DNA methylation mediates persistent epileptiform activity in vitro and in vivo

Ziv M Machnes et al. PLoS One. .

Abstract

Epilepsy is a chronic brain disorder involving recurring seizures often precipitated by an earlier neuronal insult. The mechanisms that link the transient neuronal insult to the lasting state of epilepsy are unknown. Here we tested the possible role of DNA methylation in mediating long-term induction of epileptiform activity by transient kainic acid exposure using in vitro and in vivo rodent models. We analyzed changes in the gria2 gene, which encodes for the GluA2 subunit of the ionotropic glutamate, alpha-amino-3-hydroxy-5-methyl-4-isoxazole proprionic acid receptor and is well documented to play a role in epilepsy. We show that kainic acid exposure for two hours to mouse hippocampal slices triggers methylation of a 5' regulatory region of the gria2 gene. Increase in methylation persists one week after removal of the drug, with concurrent suppression of gria2 mRNA expression levels. The degree of kainic acid-induced hypermethylation of gria2 5' region varies between individual slices and correlates with the changes in excitability induced by kainic acid. In a rat in vivo model of post kainic acid-induced epilepsy, we show similar hypermethylation of the 5' region of gria2. Inter-individual variations in gria2 methylation, correlate with the frequency and intensity of seizures among epileptic rats. Luciferase reporter assays support a regulatory role for methylation of gria2 5' region. Inhibition of DNA methylation by RG108 blocked kainic acid-induced hypermethylation of gria2 5' region in hippocampal slice cultures and bursting activity. Our results suggest that DNA methylation of such genes as gria2 mediates persistent epileptiform activity and inter-individual differences in the epileptic response to neuronal insult and that pharmacological agents that block DNA methylation inhibit epileptiform activity raising the prospect of DNA methylation inhibitors in epilepsy therapeutics.


Conflict of interest statement

Competing Interests: The authors have declared that no competing interests exist.

Figures

Figure 1
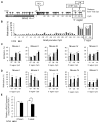
Figure 1. Methylation changes in gria2 5’ region in response to KA induced epileptiform activity.
(A) Physical map of the gria2 5’ regulatory region and promoter region. CpG sites are marked by balloons and transcription factor predictions in the analyzed 5’ region are indicated above the physical map. (B) State of methylation of CpG sites in the proximal promoter of the gria2 and the 5’ region in control and KA treated hippocampal slices (n=3 technical replicates); CpG 32 and 34 were not analyzed due to sequence restrictions. (C) Methylation differences between control and KA treated slices derived from the same mouse (n=4 technical replicates for each individual mouse) immediately after KA treatment for two hours, and (D) 1 week after removal of the drug (n=4 technical replicates, SD indicate technical errors). Inter-individual differences are apparent between littermate mice (Mouse I, II, III) and between mice from different litters (mouse IV, V) (E) Gria2 mRNA expression levels in control and KA treated slices as measured by qPCR immediately after KA treatment (2 hours, n=5) and 1 week after removal of the drug (1 week, n=9). Gria2 mRNA levels were normalized to TBP/GAPDH expression based on NormFinder. * p<0.05 ** p<0.01 *** p<0.005 as determined by Mann-Whitney U-test.
Figure 2
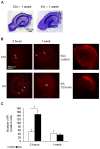
Figure 2. Cell death in hippocampus organotypic culture slices after KA treatment.
(A) Nissl staining of mature hippocampus slices displaying normal neuronal organization in both control and KA treated slices 1 week after removal of the drug. (B) Propidium Iodine (PI) staining of the cultures at 2 hours treatment with KA (KA 2h), control (Ctrl 2h) and 1 week after removal of KA (Ctrl 1 week, KA 1 week) to evaluate cell death. 12h KA (KA 12 hours) was used as a positive control for levels of cell death reported in other KA models and 15.7M KCl was used as PI staining positive control (KCl control). PI positive cells are labeled in red. White arrows point at sample PI positive cells (C) Quantification of total number of PI positive cells in the different conditions show a small but significant increase in the number of positive cells immediately after 2h KA treatment compared to control, and no significant change after 1 week recovery (n=4). * p<0.05.
Figure 3
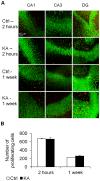
Figure 3. BrdU staining for visualization of proliferating cells after KA treatment.
(A) BrdU incorporation [30] in the different regions of hippocampus slice cultures (CA1, CA3 and dentate gyrus – DG) after 2 hour treatment (Ctrl 2h, KA 2h) and 1 week recovery (Ctrl -1 week, KA -1 week). Neuronal cells (NeuN positive) are stained green (B) Quantification of the total number of proliferating cells (BrdU positive) show no significant difference between KA treated slices and control immediately after 2 hour treatment, or after 1 week of recovery (n=5).
Figure 4
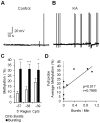
Figure 4. Correlation between epileptiform burst activity and gria2 5’ region CpG methylation levels 1 week after removal of drug.
(A) Sample neurons’ membrane potentials recording in current-clamp mode of Control hippocampal slices and (B) 2 hours KA treated slices 1 week after removal of the drug and incubation in drug free medium. Three or more spikes were grouped into bursts if the inter-spike interval was smaller than 600 ms. (C) Average methylation levels of gria2 5’ region CpGs in either slices that exhibit spontaneous bursting and those that don’t exhibit bursting 1 week after 2 hours exposure to KA (n=4). (D) Correlation between bursting frequency and average probe methylation levels (p=0.017, Pearson’s r=0.7995). *p<0.05 ***p<0.005.
Figure 5
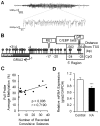
Figure 5. DNA Methylation changes in rat gria2 gene promoter 5
region in epileptic and control rats and their correlation with seizures. (A) Representative electrographic recording of a seizure with synchronous video using Compumedics software. (B) Physical map of the rat gria2 promoter (+320 - -664). CpG sites are marked by balloons and predicted transcription factors common to the mouse and rat 5’ region (-562--664) are indicated above the physical map. (C) Correlation between bursting frequency and average methylation levels of the gria2 5’ region (p=0.006, Pearson’s r=0.7190, n=13). (D) mRNA gria2 expression levels in control and KA treated rats measured by qPCR 10 weeks after initial SE. ***p<0.005.
Figure 6
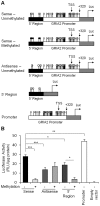
Figure 6. DNA methylation of the 5’ region silences the activity of the gria2 promoter as determined by a transient transfection Luciferase reporter assay.
(A) Physical map of the gria2-Luciferase reporter construct. The 5’ region CpGs in the probe were in-vitro methylated (black lollypop), or mock methylated (empty lollypop). The CpGs in the promoter region were left unmethylated (empty lollypop). Additional constructs were designed as controls; One containing the full promoter but with the 5’ region in a reverse direction (Antisense); second, containing only the 5’ region (5’ region); third containing only the unmethylated promoter (Promoter); forth containing plasmid without any promoter sequence (Empty vector). (B) The indicated constructs were transfected into SH-Sy5y (human neuronal cell line). 48h after transfection the cells were harvested, extracts were prepared and assayed for Luciferase activity and the values were normalized to total protein concentration. Results are average of (n=3) transfections +/- SEM. *p<0.05 **p<0.01 ***p<0.005 determined by a Student t test with Holm-Bonferroni correction.
Figure 7
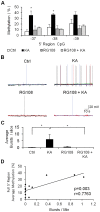
Figure 7. Effect of DNA methylation inhibitor RG108 on KA induced DNA methylation of the gria2 5’ region and epileptiform bursting 1 week following a transient 2 hour exposure.
(A) Methylation differences between control (Ctrl, n=4 technical replicates on 3 different mice of origin), KA treated (KA, n=4 technical replicates on 3 slices from different individual mice), RG108 (RG108 n=4 technical replicates on slices from 2 different mice) and RG108 and KA treated slices (RG108+KA n=4 technical replicates on 2 different mice of origin) 1 week after removal of the drug and incubation in drug free medium. (B) Sample neurons’ membrane potentials recording in current-clamp mode of Ctrl, KA, RG108 and RG108 + KA treated samples. (C) Average spontaneous bursting activity of hippocampus slices after treatment with the different drugs. Significant increase in bursting activity can be observed in KA treated slices (n=19) vs. control (n=16). RG108 combined with KA treatment (RG108+KA, n=14) blocks the spontaneous bursting induces by KA treatment (n=19). Treatment with RG108 alone (n=12) does not have any significant effect on bursting compared to control slices (n=16). Significance between the different conditions in multiple-comparisons was calculated using Student t-test with Holm-Bonferroni correction for multiple comparisons. (D) Correlation between bursting frequency and average probe methylation levels in all the treatments samples (n=12) (Ctrl, KA, RG108 and RG108 + KA) (p=0.003, Pearson’s r=0.7763). * p<0.05 ** p<0.01 *** p<0.005.

References

    1. Razin A (1998) CpG methylation, chromatin structure and gene silencing-a three-way connection. EMBO J 17: 4905-4908. doi:10.1093/emboj/17.17.4905. PubMed: 9724627. - DOI - PMC - PubMed
    1. Szyf M (2009) Epigenetics, DNA Methylation, and Chromatin Modifying Drugs. Annu Rev Pharmacol Toxicol 49: 243-263. doi:10.1146/annurev-pharmtox-061008-103102. PubMed: 18851683. - DOI - PubMed
    1. Zachariah RM, Rastegar M (2012) Linking epigenetics to human disease and Rett syndrome: the emerging novel and challenging concepts in MeCP2 research. Neural Plast, 2012: 415825 PubMed: 22474603 - PMC - PubMed
    1. Portela A, Liz J, Nogales V, Setién F, Villanueva A et al. (2013) DNA methylation determines nucleosome occupancy in the 5'-CpG islands of tumor suppressor genes. Oncogene. PubMed: 23686312 - PMC - PubMed
    1. Weaver IC, Cervoni N, Champagne FA, D’Alessio AC, Sharma S et al. (2004) Epigenetic programming by maternal behavior. Nat Neurosci 7: 847-854. doi:10.1038/nn1276. PubMed: 15220929. - DOI - PubMed

Publication types

MeSH terms