Comparative Study
. 2013 Sep 30;8(9):e74733.
doi: 10.1371/journal.pone.0074733. eCollection 2013.

Survival analysis of irish amyotrophic lateral sclerosis patients diagnosed from 1995-2010

Affiliations
Comparative Study

Survival analysis of irish amyotrophic lateral sclerosis patients diagnosed from 1995-2010

James Rooney et al. PLoS One. .

Abstract

Introduction: The Irish ALS register is a valuable resource for examining survival factors in Irish ALS patients. Cox regression has become the default tool for survival analysis, but recently new classes of flexible parametric survival analysis tools known as Royston-Parmar models have become available.

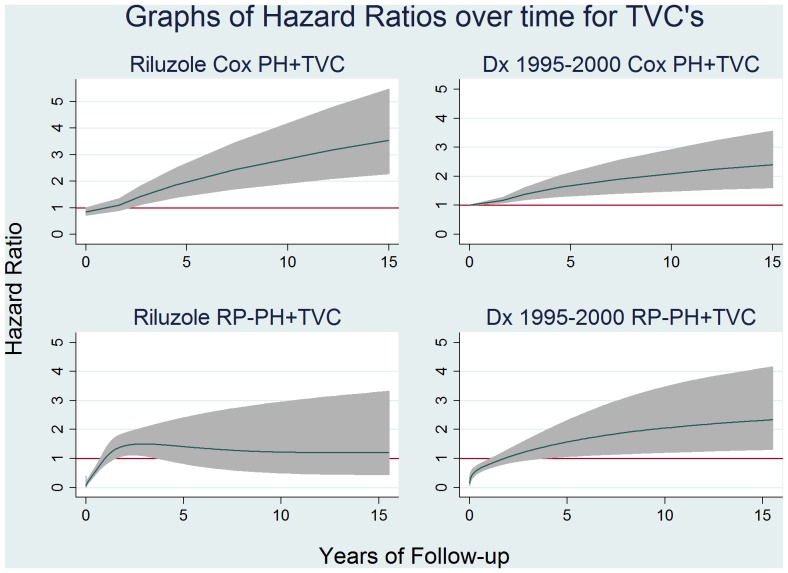
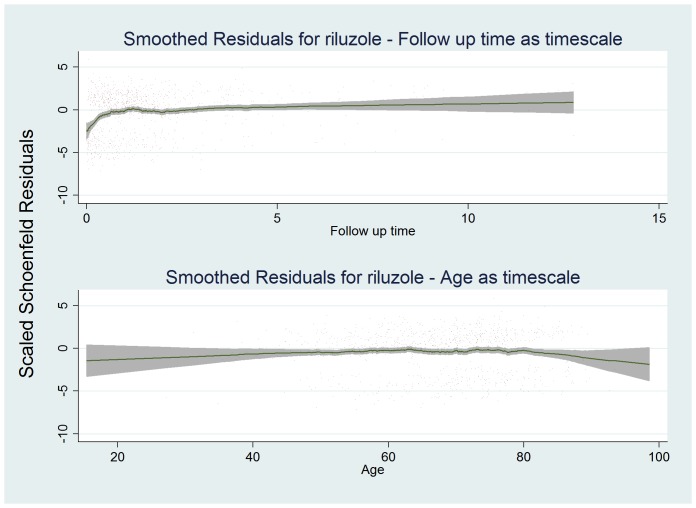
Methods: We employed Cox proportional hazards and Royston-Parmar flexible parametric modeling to examine factors affecting survival in Irish ALS patients. We further examined the effect of choice of timescale on Cox models and the proportional hazards assumption, and extended both Cox and Royston-Parmar models with time varying components.

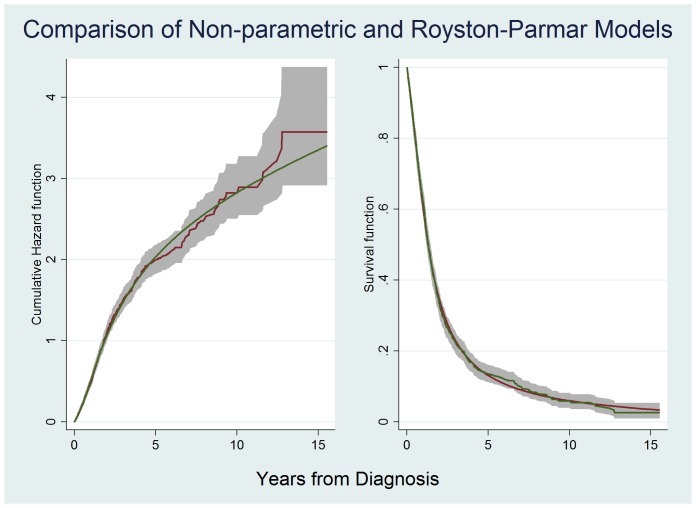
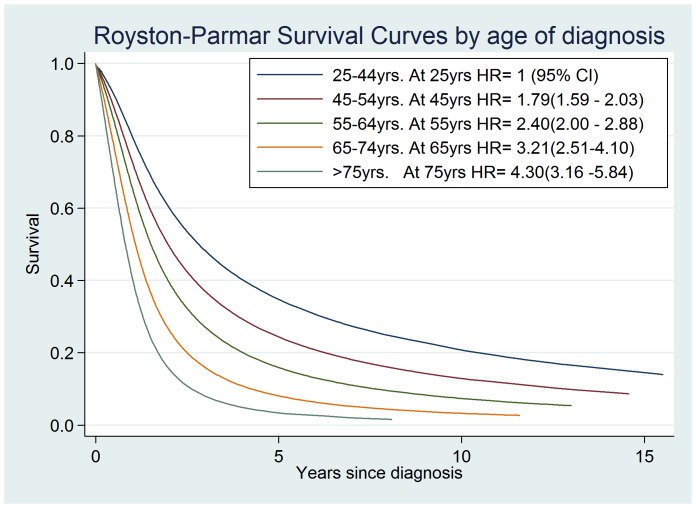
Results: On comparison of models we chose a Royston-Parmar proportional hazards model without time varying covariates as the best fit. Using this model we confirmed the association of known survival markers in ALS including age at diagnosis (Hazard Ratio (HR) 1.34 per 10 year increase; 95% CI 1.26-1.42), diagnostic delay (HR 0.96 per 12 weeks delay; 95% CI 0.94-0.97), Definite ALS (HR 1.47 95% CI 1.17-1.84), bulbar onset disease (HR 1.58 95% CI 1.33-1.87), riluzole use (HR 0.72 95% CI 0.61-0.85) and attendance at an ALS clinic (HR 0.74 95% CI 0.64-0.86).

Discussion: Our analysis explored the strengths and weaknesses of Cox proportional hazard and Royston-Parmar flexible parametric methods. By including time varying components we were able to gain deeper understanding of the dataset. Variation in survival between time periods appears to be due to missing data in the first time period. The use of age as timescale to account for confounding by age resolved breaches of the proportional hazards assumption, but in doing so may have obscured deficiencies in the data. Our study demonstrates the need to test for, and fully explore, breaches of the Cox proportional hazards assumption. Royston-Parmar flexible parametric modeling proved a powerful method for achieving this.


Conflict of interest statement

Competing Interests: The authors have read the journal’s policy and have the following conflicts: Professor Orla Hardiman: Prof. Orla Hardiman has received speaking honoraria from Janssen Cilag, Biogen Idec, Sanofi Aventis and Merck-Serono. She has been a member of advisory panels for Biogen Idec, Allergen, Ono Pharmaceuticals, Novartis, Cytokinetics and Sanofi Aventis. She serves as Editor-in-Chief of Amyotrophic Lateral Sclerosis and Frontotemporal Dementia. This does not alter the authors' adherence to all the PLOS ONE policies on sharing data and materials. The remaining authors have declared that no competing interests exist.

Figures

Figure 1
Figure 1. Cumulative Hazard function and Survival function of Non-parametric and Royston-Parmar models.
The graph on the left shows cumulative hazards estimated using the Nelson-Aalen method (red line) with 95% CI’s (grey area) and the cumulative hazard estimated by Royston-Parmar PH (df 3) modeling (green line). The graph on the right shows the survival function estimated using the Kaplan-Meier method with 95% CI’s (grey area) and the survival function estimated by Royston-Parmar PH (df 3) modeling (green line). These graphs were based on the full cohort minus those missing data for key variables (n = 1086). As can be seen the Royston-Parmar models provides excellent fit when compared to non-parametric methods.
Figure 2
Figure 2. Royston-Parmar Survival Curves by diagnostic age group.
Predicted cumulative survival curves based on model 3. Curves represent mean survival for each age group. The legend contains hazard ratios with 95% CI’s for specific ages determined from model parameters and taking 25 yrs to represent the baseline age risk.
Figure 3
Figure 3. Graphs of time varying covariates.
Note 1: The RP graph for riluzole is drawn with d.f. = 3 for time varying spline knots whilst the 1995–2000 graph is drawn with d.f. = 1 for time varying spline knots. These values were decided after comparison of AIC and BIC values of multiple possibilities. Note 2: While the group diagnosed between 2006–2010 also had P = 0.02 when modeled as a time varying covariate under Cox PH, the graph was unimpressive as it was limited to 5 years follow up and had 95% CI’s close to 1 at all points, and therefore has not been included.
Figure 4
Figure 4. Smoothed Schoenfeld residuals from Cox PH models for riluzole use by years of followup.
Nearest neighbour smoothed scaled Schoenfeld residuals for riluzole modeled with time of diagnosis as timescale origin (upper graph), and with age of diagnosis as timescale (lower graph). Deviation from linear trend can be seen in the first year on the upper graph. It is likely that this is caused by the greater power in detecting an effect of riluzole in older people due to the non-random distribution of riluzole use across age, combined with residual confounding by age - older people have poorer survival even if on riluzole. The combined effect leads to the appearance that riluzole is more effective in the first year (Figure 3), when in fact we have reduced power to detect the effect of riluzole in younger people (table 4), who are generally more likely to survive beyond one year (Figure 2). The lower graph using age as time scale origin does not show this trend and the PH assumption is not breached, however there is fluctuation dispersed over time. Note that a) the distribution of observations in time is altered as can be seen from the graph timescales and b) observations are reordered in time (not obvious from graph). Both features affect the evaluation of the proportional hazards assumption as Cox PH modeling is effectively a ranked method.

References

    1. Hardiman O, van den Berg LH, Kiernan MC (2011) Clinical diagnosis and management of amyotrophic lateral sclerosis. Nature reviews Neurology 7: 639–649. PMID: 21989247. - PubMed
    1. Traynor BJ, Codd MB, Corr B, Forde C, Frost E, et al... (1999) Incidence and prevalence of ALS in Ireland, 1995–1997: A population-based study. Neurology 52: 504–504. PMID: 10025778. - PubMed
    1. Chiò A, Logroscino G, Hardiman O, Swingler R, Mitchell D, et al... (2009) Prognostic factors in ALS: A critical review. Amyotrophic lateral sclerosis : official publication of the World Federation of Neurology Research Group on Motor Neuron Diseases 10: 310–323. PMID: 19922118. - PMC - PubMed
    1. Elamin M, Phukan J, Bede P, Jordan N, Byrne S, et al... (2011) Executive dysfunction is a negative prognostic indicator in patients with ALS without dementia. Neurology 76: 1263–1269. PMID: 21464431. - PubMed
    1. Miller RG, Mitchell JD, Moore DH (2012) Riluzole for amyotrophic lateral sclerosis (ALS)/motor neuron disease (MND). Cochrane database of systematic reviews (Online) 3: CD001447. PMID: 22419278. - PMC - PubMed