. 2013 Sep 30;8(9):e75485.
doi: 10.1371/journal.pone.0075485. eCollection 2013.

Genome aberrations in canine mammary carcinomas and their detection in cell-free plasma DNA

Affiliations

Genome aberrations in canine mammary carcinomas and their detection in cell-free plasma DNA

Julia Beck et al. PLoS One. .

Abstract

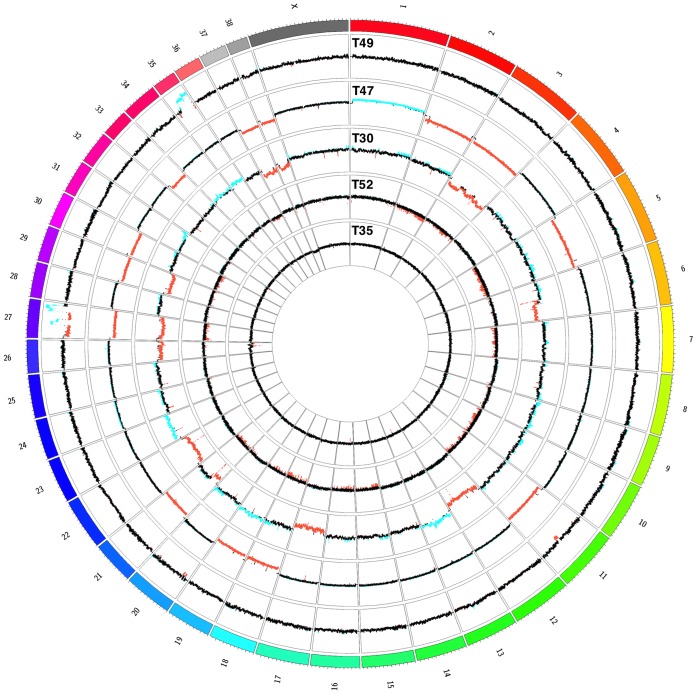
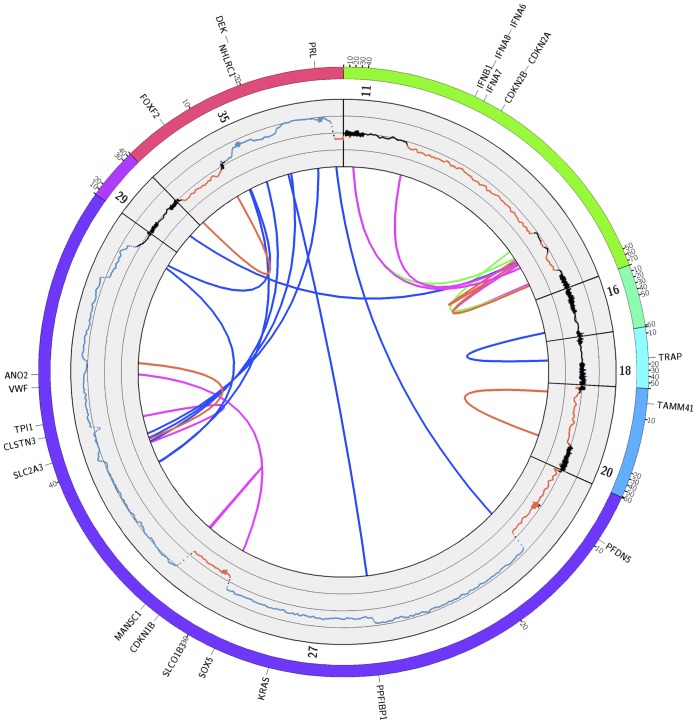
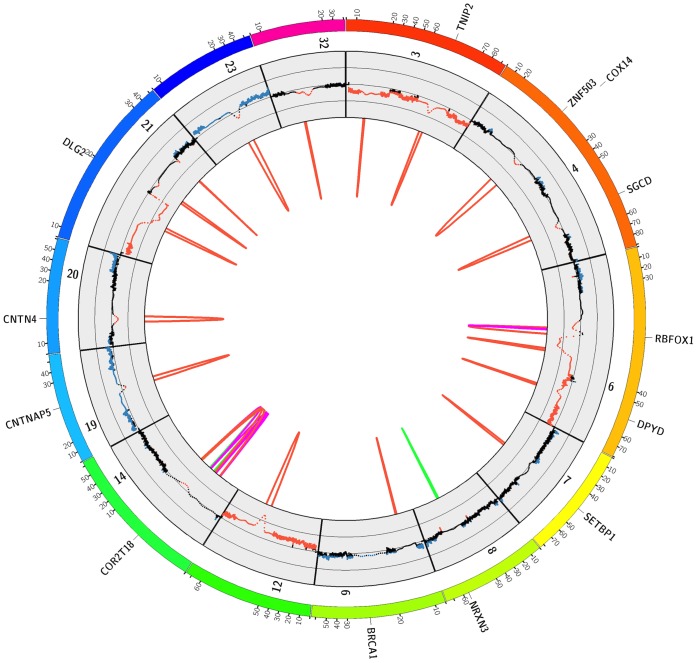
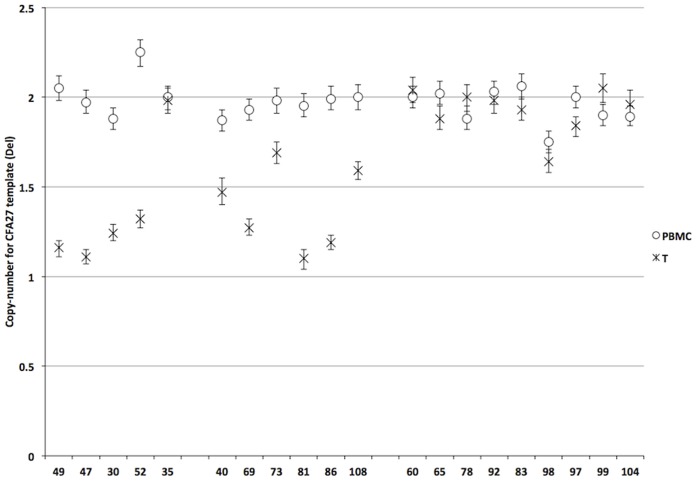
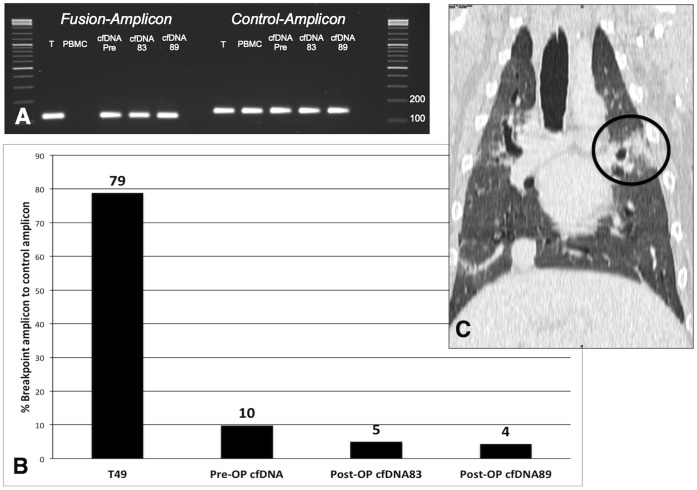
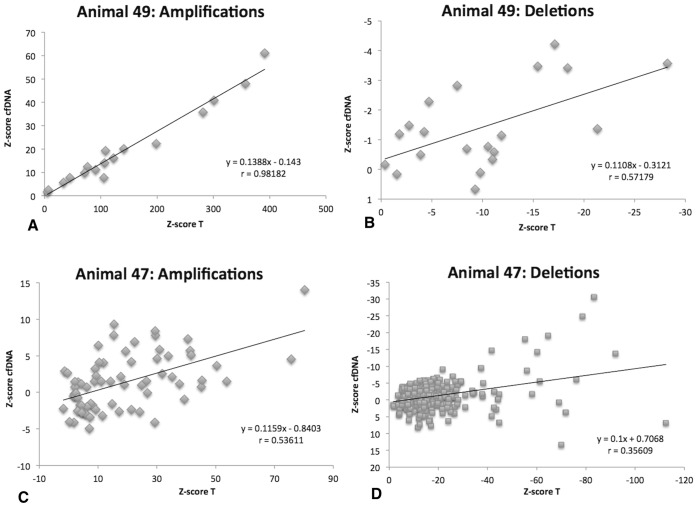
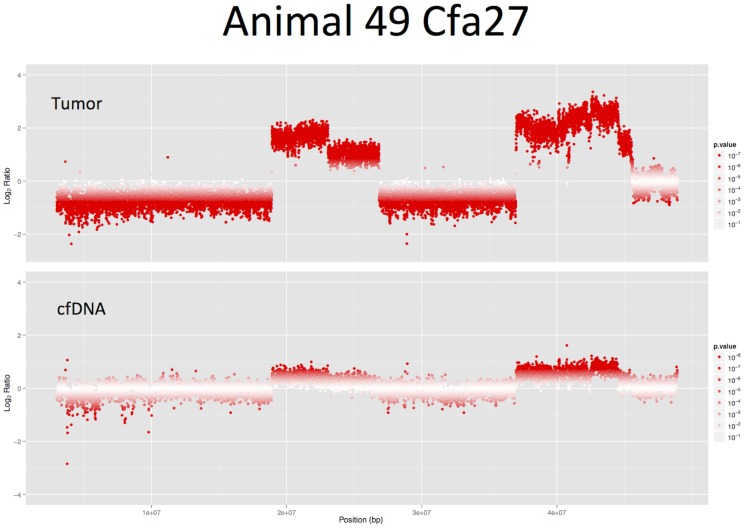
Mammary tumors are the most frequent cancers in female dogs exhibiting a variety of histopathological differences. There is lack of knowledge about the genomes of these common dog tumors. Five tumors of three different histological subtypes were evaluated. Massive parallel sequencing (MPS) was performed in comparison to the respective somatic genome of each animal. Copy number and structural aberrations were validated using droplet digital PCR (ddPCR). Using mate-pair sequencing chromosomal aneuploidies were found in two tumors, frequent smaller deletions were found in one, inter-chromosomal fusions in one other, whereas one tumor was almost normal. These aberrations affect several known cancer associated genes such as cMYC, and KIT. One common deletion of the proximal end of CFA27, harboring the tumor suppressor gene PFDN5 was detected in four tumors. Using ddPCR, this deletion was validated and detected in 50% of tumors (N = 20). Breakpoint specific dPCRs were established for four tumors and tumor specific cell-free DNA (cfDNA) was detected in the plasma. In one animal tumor-specific cfDNA was found >1 year after surgery, attributable to a lung metastasis. Paired-end sequencing proved that copy-number imbalances of the tumor are reflected by the cfDNA. This report on chromosomal instability of canine mammary cancers reveals similarities to human breast cancers as well as special canine alterations. This animal model provides a framework for using MPS for screening for individual cancer biomarkers with cost effective confirmation and monitoring using ddPCR. The possibility exists that ddPCR can be expanded to screening for common cancer related variants.


Conflict of interest statement

Competing Interests: Some authors (JB KBK HBU ES) are employed by the commercial company Chronix Biomedical GmbH. SH SN BB are employees of the Institute of Veterinary Medicine, Georg-August University Göttingen. This does not alter their adherence to all the PLOS ONE policies on sharing data and materials.

Figures

Figure 1
Figure 1. Circos Plot of detected copy number changes in the five sequenced tumor genomes.
The outer track represents the canine ideogram, with each tick indicating 5-number profile of the tumors. Displayed are the ratios (as log2) of each tumor/PBMC pair. Regions with significantly negative log2-ratios (deletions) are highlighted in red and regions with significantly positive log2-ratios (amplifications) are highlighted in blue. Each data track’s y-axis spans from −3 to 3.
Figure 2
Figure 2. Structural aberrations detected in the genome of tumor T49.
The outer track represents chromosomes with detected aberrations, with each tick indicating 10-number profile and the rearrangements identified by PEM analysis. The inner track displays log2 ratios as obtained by DOC analysis. The y-axis spans from −4 to 4 with sub-scales at −2 and 2. Arcs indicate the rearrangements detected by PEM analysis. Blue = translocations, red = deletions, green = duplications, magenta = inversions. For better visibility regions with rearrangements are expanded. Canine RefSeq genes affected by aberrations and/or copy-number imbalances are indicated.
Figure 3
Figure 3. Structural aberrations detected in the genome of tumor T30.
The outer track represents chromosomes with detected aberrations, with each tick indicating 10-number profile and the rearrangements identified by PEM analysis. The inner track displays log2 ratios as obtained by DOC analysis. The y-axis spans from −2 to 2 with sub-scales at −1 and 1. Arcs indicate the rearrangements detected by PEM analysis. Blue = translocations, red = deletions, green = duplications, magenta = inversions. For better visibility regions with rearrangements are expanded. Canine RefSeq genes affected by aberrations and/or copy-number imbalances are indicated.
Figure 4
Figure 4. CFA27 proximal region copy-number states as detected by ddPCR.
Left: Copy-number states of the five tumors sequenced. Four of the five tumors contain the CFA27 deletion. Middle: Copy-number states of additional six tumor genomes with the deletion detected by digital PCR. Right: ddPCR results for nine tumor genomes without deletion on CFA27. Errorbars indicate the 95% confidence limits as determined from the Poisson distribution.
Figure 5
Figure 5. Tumor-derived cfDNA detection in the plasma of animal 49.
Panel A: Agarose gel image of the breakpoint specific and control amplicon PCR for the various specimens obtained from animal 49. The breakpoint specific amplicon was not detected in the PBMC DNA. Panel B: Digital PCR results; mutated DNA content is displayed as breakpoint amplicon in percent of control amplicon. Panel C: Tomographic image of the lung of animal 49, the circle indicates the metastatic lesion.
Figure 6
Figure 6. Z-Score distribution derived from paired-end sequencing of tumor and cfDNA specimen of two animals.
Panel A: Z-Scores obtained for amplified regions in tumor 49 compared to the Z-scores obtained in the pre-surgery cfDNA. Panel B: Z-Scores obtained for deleted regions in tumor 49 compared to the Z-scores obtained in the pre-surgery cfDNA. Panel C: Z-Scores of amplified regions in tumor 47 compared to the Z-scores obtained in the pre-surgery cfDNA. Panel D: Z-Scores of deleted regions in tumor 47 compared to the Z-scores obtained in the pre-surgery cfDNA.
Figure 7
Figure 7. CFA27 CNV-seq results from paired-end sequencing of the tumor T49 and the pre-surgery cfDNA sample.
The high amplifications detected in the tumor are also visible in the animal’s plasma cfDNA.

References

    1. Dorn CR, Taylor DO, Schneider R, Hibbard HH, Klauber MR (1968) Survey of animal neoplasms in Alameda and Contra Costa Counties, California. II. Cancer morbidity in dogs and cats from Alameda County. J Natl Cancer Inst 40: 307–318. - PubMed
    1. Sleeckx N, de Rooster H, Veldhuis Kroeze EJ, Van Ginneken C, Van Brantegem L (2011) Canine mammary tumours, an overview. Reprod Domest Anim 46: 1112–1131. - PubMed
    1. Vascellari M, Baioni E, Ru G, Carminato A, Mutinelli F (2009) Animal tumour registry of two provinces in northern Italy: incidence of spontaneous tumours in dogs and cats. BMC Vet Res 5: 39. - PMC - PubMed
    1. Dobson JM, Samuel S, Milstein H, Rogers K, Wood JL (2002) Canine neoplasia in the UK: estimates of incidence rates from a population of insured dogs. J Small Anim Pract 43: 240–246. - PubMed
    1. Merlo DF, Rossi L, Pellegrino C, Ceppi M, Cardellino U, et al. (2008) Cancer incidence in pet dogs: findings of the Animal Tumor Registry of Genoa, Italy. J Vet Intern Med 22: 976–984. - PubMed

Publication types