. 2013 Sep 30;8(9):e76157.
doi: 10.1371/journal.pone.0076157. eCollection 2013.

Bone marrow mesenchymal stem cells stimulate proliferation and neuronal differentiation of retinal progenitor cells

Affiliations

Bone marrow mesenchymal stem cells stimulate proliferation and neuronal differentiation of retinal progenitor cells

Jing Xia et al. PLoS One. .

Abstract

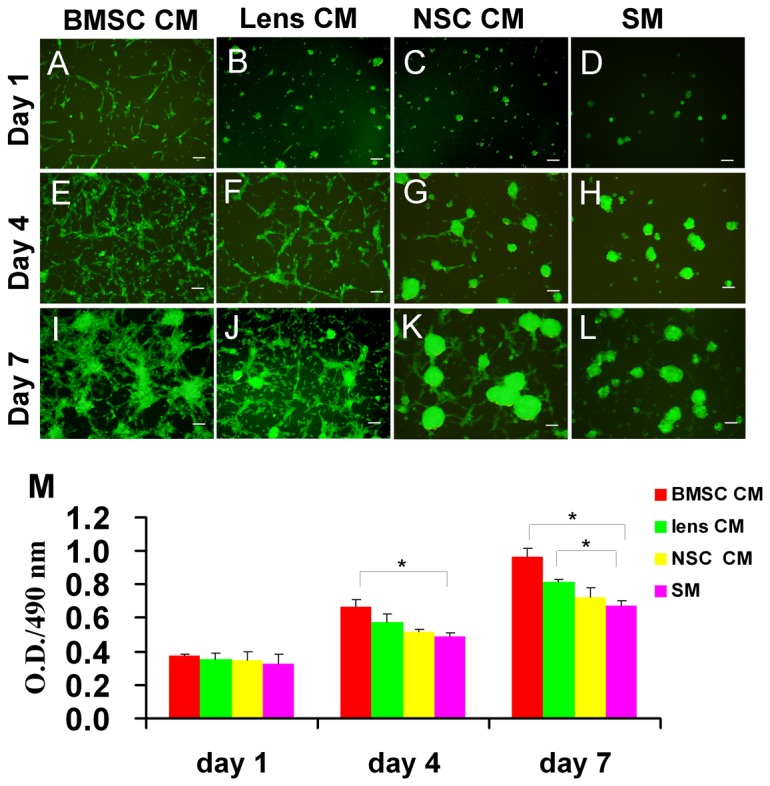
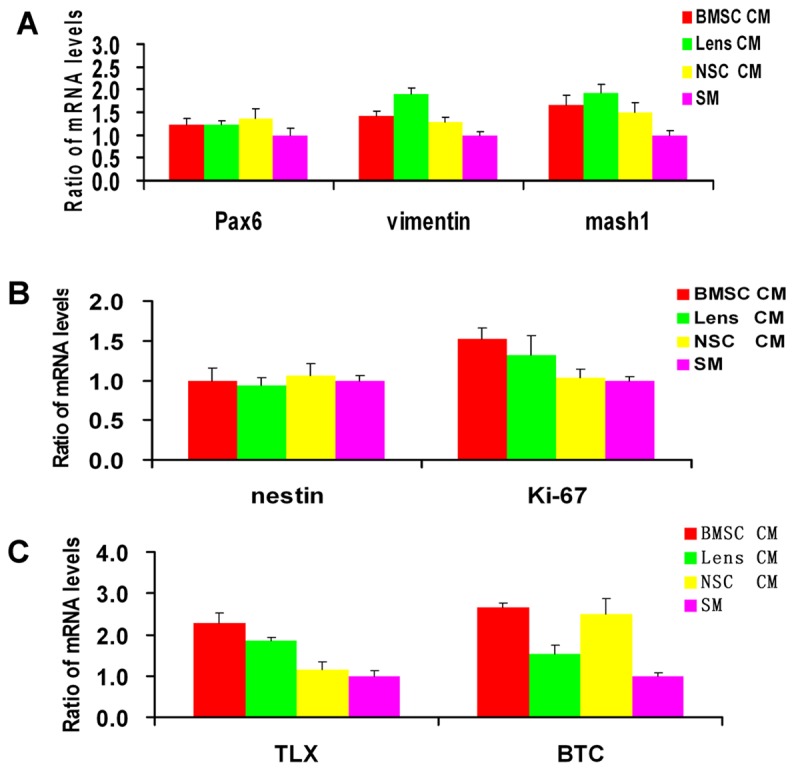
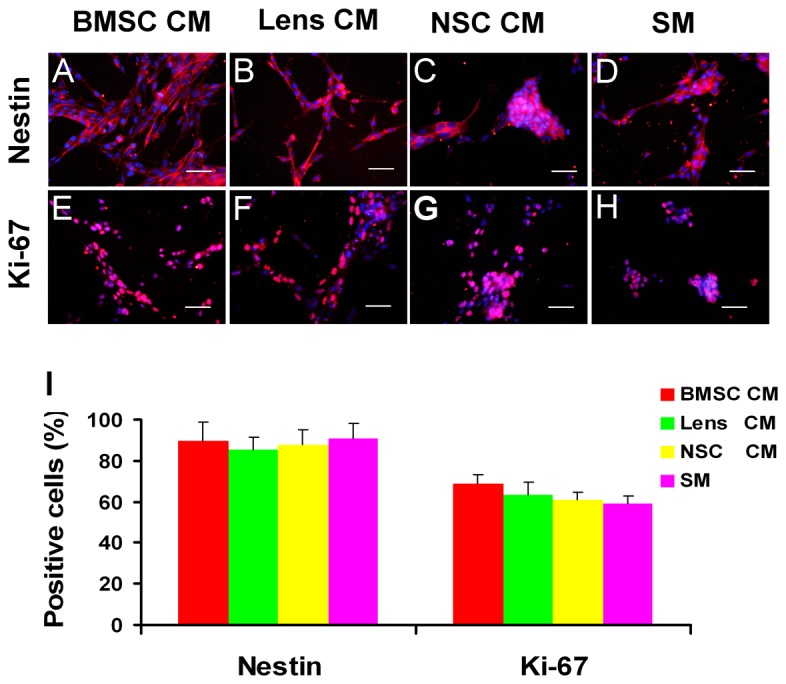
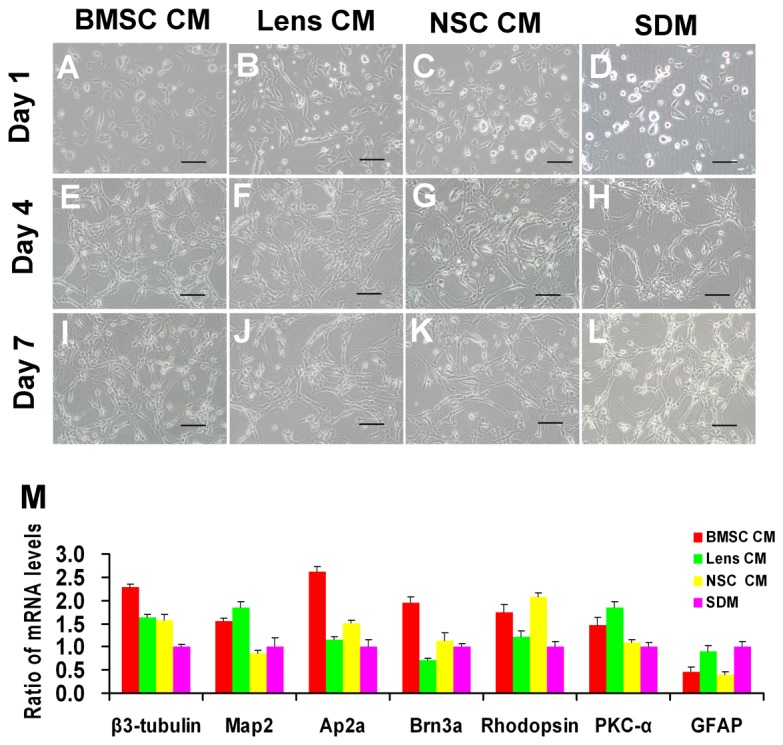
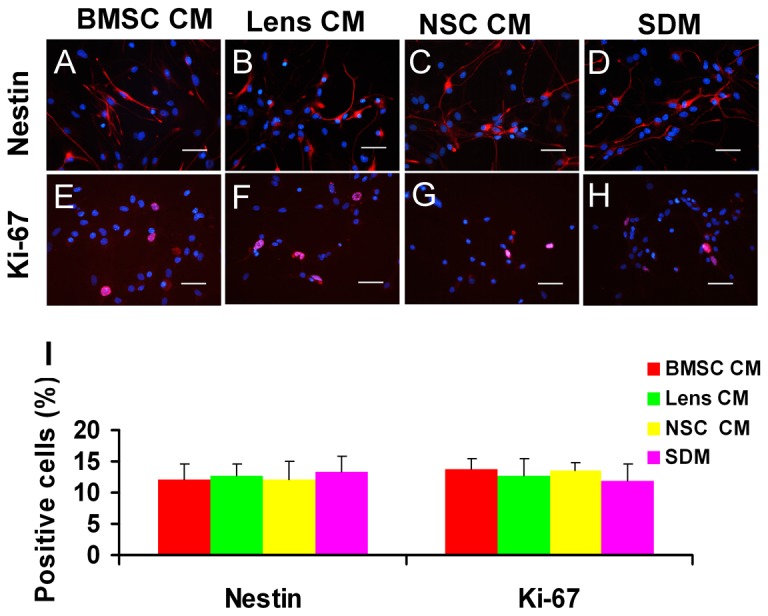
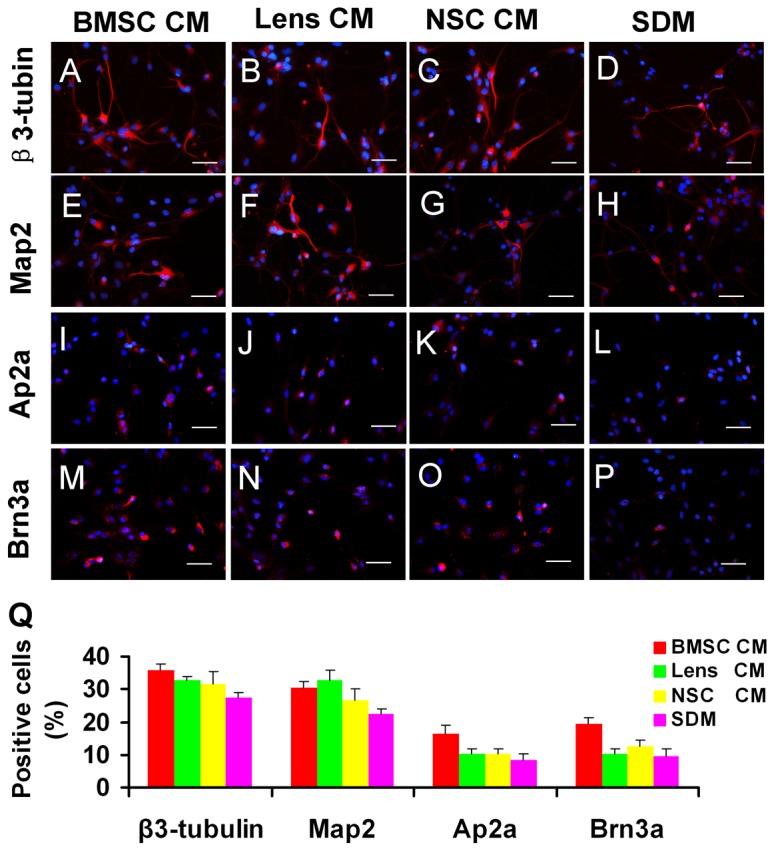
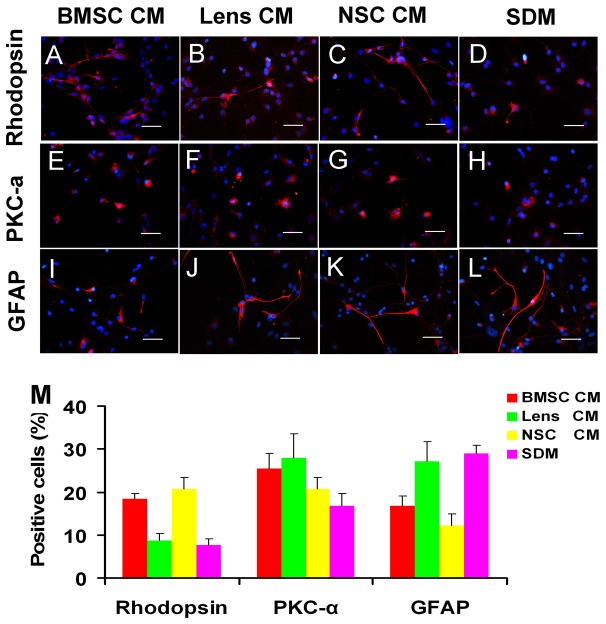
During retina development, retinal progenitor cell (RPC) proliferation and differentiation are regulated by complex inter- and intracellular interactions. Bone marrow mesenchymal stem cells (BMSCs) are reported to express a variety of cytokines and neurotrophic factors, which have powerful trophic and protective functions for neural tissue-derived cells. Here, we show that the expanded RPC cultures treated with BMSC-derived conditioned medium (CM) which was substantially enriched for bFGF and CNTF, expressed clearly increased levels of nuclear receptor TLX, an essential regulator of neural stem cell (NSC) self-renewal, as well as betacellulin (BTC), an EGF-like protein described as supporting NSC expansion. The BMSC CM- or bFGF-treated RPCs also displayed an obviously enhanced proliferation capability, while BMSC CM-derived bFGF knocked down by anti-bFGF, the effect of BMSC CM on enhancing RPC proliferation was partly reversed. Under differentiation conditions, treatment with BMSC CM or CNTF markedly favoured RPC differentiation towards retinal neurons, including Brn3a-positive retinal ganglion cells (RGCs) and rhodopsin-positive photoreceptors, and clearly diminished retinal glial cell differentiation. These findings demonstrate that BMSCs supported RPC proliferation and neuronal differentiation which may be partly mediated by BMSC CM-derived bFGF and CNTF, reveal potential limitations of RPC culture systems, and suggest a means for optimizing RPC cell fate determination in vitro.


Conflict of interest statement

Competing Interests: The authors have declared that no competing interests exist.

Figures

Figure 1
Figure 1. Morphology and proliferation capacity of CM-treated RPCs.
In the proliferation conditions, the RPCs were cultured in BMSC, lens and NSC CM, and morphology images were taken on days 1 (A, B, C, D), 4 (E, F, G, H) and 7 (I, J, K, L). In the presence of BMSC CM, the cells attached to the surface of the flask and extended short processes by the first day; with time, most cells exhibited two or more long processes and formed an intercellular network by day 7 (A, E, I). With lens CM, the cells were adherent, and short processes extending from a few cells were observed by day 1; with time, most cells extended processes, but there were fewer adherent cells than in the BMSC CM condition (B, F, J). In the presence of NSC CM (C, G, K) or SM, (D, H, L), most RPCs grew as spherical clusters which adhered to the flask or floated in the culture medium. The spherical cluster size in NSC CM was larger than that in SM. The expansion potential of the RPC cultures was assessed using CCK-8 analysis. The cells exhibited an obvious increase in expansion potential in CM cultures, especially in the BMSC CM, than in SM cultures (M). Scale bars: 100 µm.
Figure 2
Figure 2. qPCR analysis of progenitor and proliferation marker expression in RPCs under proliferation conditions.
The qPCR results showed that the expression levels of retinal progenitor markers, including Pax6, vimentin and Mash1 (A) were significantly or marginally higher in the RPCs treated with CM than in those cultured with SM. No obvious changes were detected in the expression of nestin (a retinal progenitor marker) between different groups; however, the expression levels of ki-67 (a cell proliferation marker) were slightly higher in the three CM-treated cultures (B). In addition, RPCs showed significantly higher expression levels of TLX (a nuclear receptor) and BTC (an EGF-like protein) in response to BMSC CM treatment than in the other groups (C).
Figure 3
Figure 3. Immunostaining analysis of the expression of progenitor- and proliferation-related markers.
After four days of culture in proliferation conditions, the cells were fixed and immunostained with antibodies against nestin (A-D) and ki-67 (E-H). The ratio of the nestin-positive is similar between different groups, while the percentages of ki-67-positive cells were high in the RPC cultures in BMSC CM, Lens CM and NSC CM, when compared with the cultures in SM condition (I). The percentage of positive cells was determined by dividing the number of immunopositive cells by the number of nuclei stained with DAPI. Five hundred to one thousand cells for each RPC subgroup and each culture were counted in random fields. Scale bars: 50 µm.
Figure 4
Figure 4. Morphology and gene expression levels of RPCs under differentiation conditions.
One day after the cells were cultured in the differentiation conditions, the cells in the differentiation medium without CM only occasionally extended short processes (D), whereas most of the cells extended short processes in the CM-treated cultures (A, B, C). Under differentiation conditions, RPCs treated with BMSC CM (A, E, I), lens CM (B, F, J), NSC CM (C, G, K) and SDM (D, H, L) typically exhibited increasing neurite-like cellular processes and formed a network among the cells with time. However, the cellular processes of RPC cultures treated with CM, especially with BMSC CM, were longer and appeared more numerous than in the control cultures (without CM treatment). In the qPCR analysis (M), a notable up-regulation in the expression of β3-tubulin, activator protein 2 alpha (Ap2α, an amacrine cell marker) and Brn3a (a ganglion cell marker) was detected in the BMSC CM-treated RPC cultures. The levels of the neuronal markers MAP2 and PKC-α (a marker for bipolar cells) were significantly higher in the BMSC CM- and lens CM-treated RPC cultures compared with the control. The expression levels of rhodopsin (a photoreceptor marker) were higher in RPC cultures treated with BMSC CM or NSC CM. In addition, low expression levels of the glial marker GFAP were found in the RPC cultures treated with CM. Scale bars: 100 µm.
Figure 5
Figure 5. Progenitor and proliferation marker expression of RPC cultures during differentiation.
After seven days in the differentiation medium, the cells were fixed and immunostained with antibodies against nestin (A-D) and ki-67 (E-H). The proportion of nestin- and ki-67-positive cells showed no significant difference between different groups and was less than 15% (I). The quantification of immunoreactive cells was performed as described in Figure 3-I. *P<0.05. Scale bars: 50 µm.
Figure 6
Figure 6. Potential of RPC differentiation towards neurons after exposure to CM.
After RPCs were cultured in the differentiation condition for 7 days, the cells were immunolabelled for anti-β3-tubulin (A-D), -Map2 (E-H), -AP2α (I-L) and -Brn3a (M-P). The proportion of β3-tubulin, AP2α and Brn3a-positive cells was highest in BMSC CM-treated RPCs (Q). The percentage of MAP2-immunoreactive cells was significantly higher in lens and BMSC CM cultures (Q). The quantification of immunoreactive cells was performed as described in Figure 3-I. *P<0.05. Scale bars: 50 µm.
Figure 7
Figure 7. Potential of RPC differentiation towards neuronal and glial cells after exposure to CM.
After RPCs were cultured in differentiation medium for seven days, the cells were fixed and immunostained with antibodies against rhodopsin (A-D), PKC-α (E-H) and GFAP (I-L). The percentages of rhodopsin-positive cells were higher in NSC and BMSC CM-treated RPC cultures than in other groups, and PKC-α immunoreactive cells were detected more in CM treated RPCs. However, the ratio of GFAP-positive cells was decreased in the BMSC and NSC CM-treated cultures compared with the controls (M). Quantification of immunoreactive cells was performed as described in Figure 3-I. *P<0.05. Scale bars: 50 µm.

References

    1. Lolley RN, Rong H, Craft CM (1994) Linkage of photoreceptor degeneration by apoptosis with inherited defect in phototransduction. Invest Ophthalmol Vis Sci 35: 358-362. PubMed: 8112981. - PubMed
    1. Rivolta C, Sharon D, DeAngelis MM, Dryja TP (2002) Retinitis pigmentosa and allied diseases: numerous diseases, genes, and inheritance patterns. Hum Mol Genet 11: 1219-1227. doi:10.1093/hmg/11.10.1219. PubMed: 12015282. - DOI - PubMed
    1. Coles BL, Angénieux B, Inoue T, Del Rio-Tsonis K, Spence JR et al. (2004) Facile isolation and the characterization of human retinal stem cells. Proc Natl Acad Sci U S A 101: 15772-15777. doi:10.1073/pnas.0401596101. PubMed: 15505221. - DOI - PMC - PubMed
    1. Gu P, Yang J, Wang J, Young MJ, Klassen H (2009) Sequential changes in the gene expression profile of murine retinal progenitor cells during the induction of differentiation. Mol Vis 15: 2111-2122. PubMed: 19862338. - PMC - PubMed
    1. Strassburg S, Richardson SM, Freemont AJ, Hoyland JA (2010) Co-culture induces mesenchymal stem cell differentiation and modulation of the degenerate human nucleus pulposus cell phenotype. Regen Med 5: 701-711. doi:10.2217/rme.10.59. PubMed: 20868326. - DOI - PubMed

Publication types

MeSH terms