. 2013 Sep 30;8(9):e76778.
doi: 10.1371/journal.pone.0076778. eCollection 2013.

The uremic toxin indoxyl sulphate enhances macrophage response to LPS

Affiliations

The uremic toxin indoxyl sulphate enhances macrophage response to LPS

Simona Adesso et al. PLoS One. .

Abstract

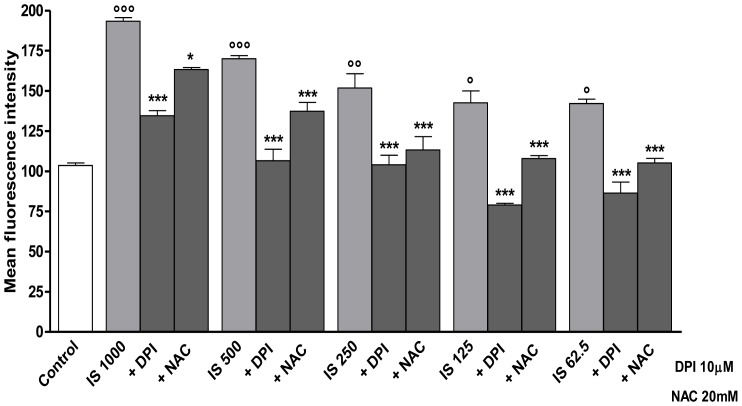
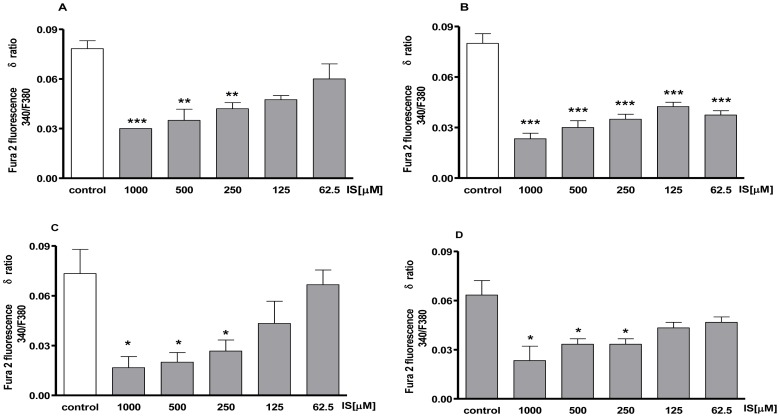
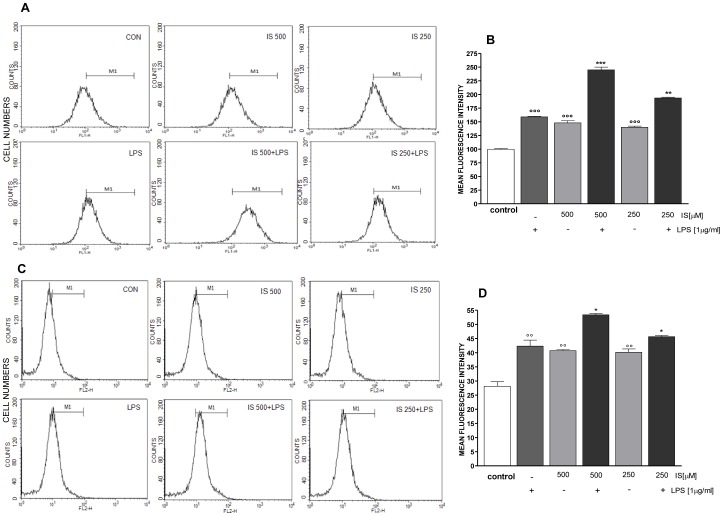
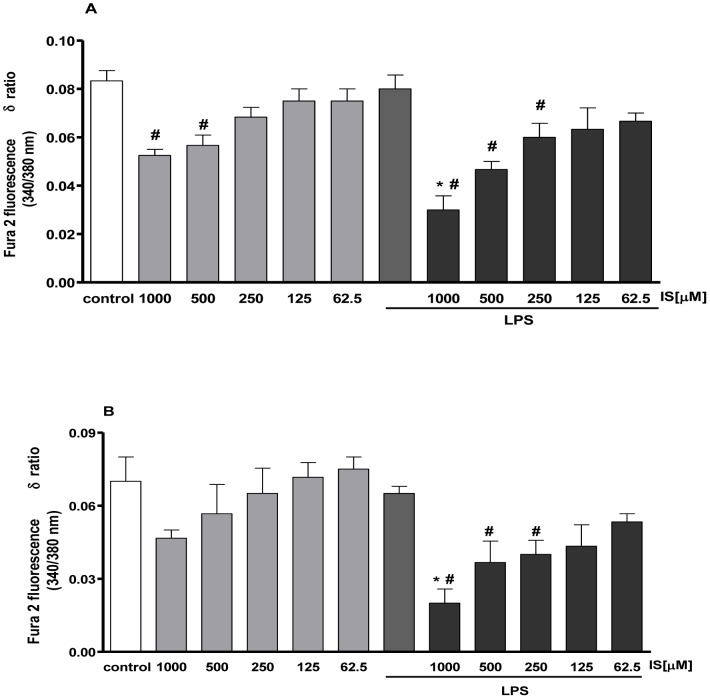
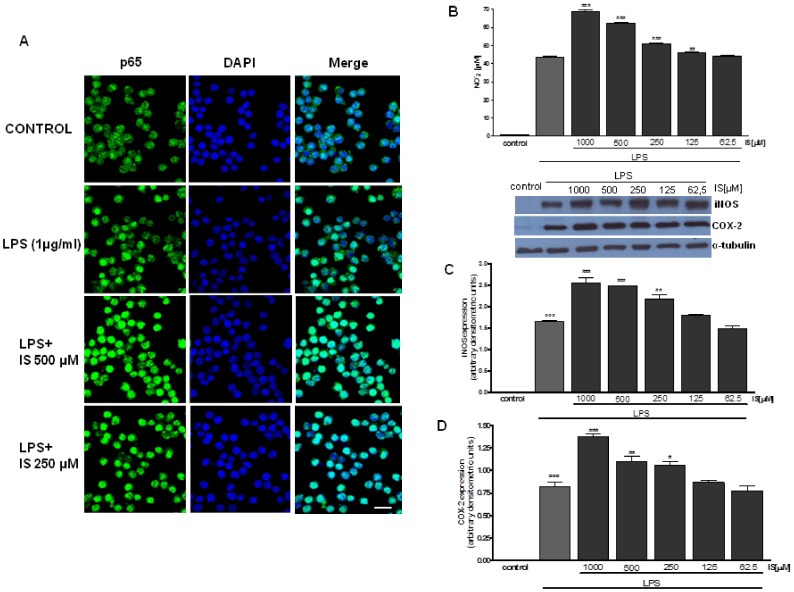
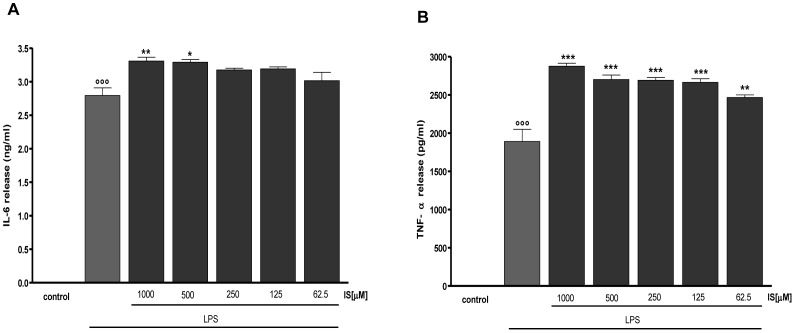
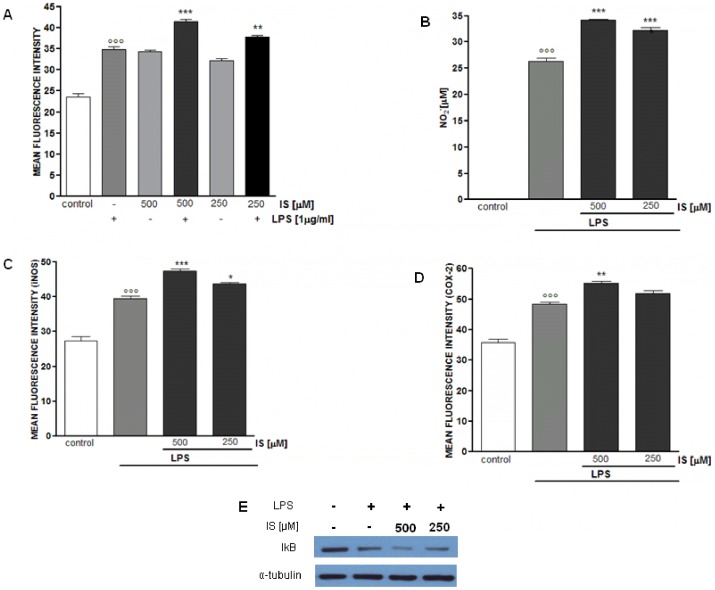
Indoxyl sulphate (IS) is a protein-bound uremic toxin that results from the metabolism of dietary tryptophan normally excreted by kidney through the proximal tubules. Thus the toxin accumulates in the blood of patients with impaired renal function such as in chronic kidney disease (CKD). High IS serum levels in patients with CKD suggest its involvement in CKD progression and in the onset of complications. Its presence in plasma is also a powerful predictor of overall and cardiovascular morbidity/mortality. IS is a well known nephrovascular toxin but very little is known regarding its effects on the immune system and in particular during inflammation. In this study we examined the effect of IS on macrophage activation in response to lipopolysaccharide from E. coli (LPS), a gram negative bacterial endotoxin associated with inflammation and septic shock. To simulate the uremic condition, J774A.1 macrophages were incubated with IS at concentrations observed in uremic patients (1000-62.5 µM) both alone and during LPS challenge. IS alone induced release of reactive oxygen species (ROS), through a mechanism involving pro- and anti-oxidant systems, and alteration in intracellular calcium homeostasis. When added to J774A.1 macrophages in presence of LPS, IS significantly increased the nitric oxide (NO) release, inducible nitric oxide synthase (iNOS) and cycloxygenase-2 (COX-2) expression. IS pre-treatment was also associated with an increase in tumor necrosis factor-α (TNF-α) and interleukin-6 (IL-6) production by macrophages stimulated with LPS. Mechanistic studies revealed that IS increased LPS-induced NF-kB nuclear translocation, ROS release and altered calcium concentrations, mainly because of mitochondrial calcium overloading. Moreover also in primary mouse peritoneal macrophages IS enhances the inflammatory response to LPS increasing ROS, NO, iNOS, COX-2, TNF-α, IL-6 and NF-kB levels. This study provides evidences that IS stimulates macrophage function and enhances inflammatory reasponse associated with LPS, thus contributing to altered immune response dysfunctions observed in CKD.


Conflict of interest statement

Competing Interests: The authors have declared that no competing interests exist.

Figures

Figure 1
Figure 1. Indoxyl sulphate induces ROS formation in J774A.1 macrophages, effect of DPI and NAC.
ROS formation was evaluated by means of the probe 2′,7′ dichlorofluorescein-diacetate (H2DCF-DA) in J774A.1 stimulate with IS (1000–62.5 µM) for 1 h. Where indicated, DPI (10 µM) or NAC (20 mM) for 30 min before to IS. ROS production was expressed as mean±s.e.m. of mean fluorescence intensity of six independent experiments. Data were analyzed by analysis of variance test, and multiple comparison were made by Bonferroni's test. *** denotes P<0.001 versus IS alone; °°°, °° and ° denote P<0.001, P<0.01 and P<0.05 respectively versus control.
Figure 2
Figure 2. Concentration – related effect of IS on [Ca2+]i concentrations.
Intracellular calcium concentration was evaluated on J774A.1 cells in Ca2+-free medium 30 minutes (panel A) or 2 h (panel B) after IS treatment (1000–62.5 µM). Effect of IS on mitochondrial Ca2+ pool was evaluated on J774A.1 cells in Ca2+-free medium in presence of FCCP (0.05 µM) added for 30 minutes (panel C) or 2 h (panel D) after IS treatment. Results were expressed as mean±s.e.m. of delta (δ) increase of FURA 2 ratio fluorescence (340/380 nm) from three independent experiments. Data were analyzed by ANOVA, and multiple comparison were made by Bonferroni's test. ***, ** and * denote P<0.001, P<0.01 and P<0.05 respectively versus control cells (J774A.1 in medium without LPS nor IS).
Figure 3
Figure 3. IS increases ROS production in LPS treated J774A.1 macrophages.
ROS formation was evaluated by means of the probe 2′,7′ dichlorofluorescein-diacetate (H2DCF-DA) in J774A.1 cells. IS (500–250 µM) was added 1 h before and simultaneously to LPS (1 µg/ml) for 15 minutes. Panel A reports representative histograms for ROS detection. In panel B, ROS production was expressed as mean±s.e.m. of mean fluorescence intensity six independent experiments. In the same experimental conditions we also evaluated superoxide production by mitochondria adding MitoSOX Red. Panel C reports representative histograms for mitochondria superoxide detection. In panel D, mitochondrial superoxide production was expressed as mean±s.e.m. of mean fluorescence intensity of at least three independent experiments. Data were analyzed by analysis of variance test, and multiple comparison were made by Bonferroni's test. *** and ** denote P<0.001 and P<0.01 respectively versus LPS; °°°denotes P<0.001 versus control.
Figure 4
Figure 4. IS increase [Ca2+]i concentrations in LPS treated J774A.1 macrophages.
Cells were pre-treated with IS for 1 h and then co-treated with LPS and IS (1000–62.5 µM) for 15 minutes. Intracellular calcium concentration was evaluated on J774A.1 cells in Ca2+-free medium (panel A). Effect of IS on mitochondrial Ca2+ pool was evaluated on J774A.1 cells in Ca2+-free medium in presence of FCCP (0.05 µM) (panel B) after LPS and IS treatment. Results were expressed as mean±s.e.m. of delta (δ) increase of FURA 2 ratio fluorescence (340/380 nm) from three independent experiments. Data were analyzed by analysis of variance test, and multiple comparison were made by Bonferroni's test. # denotes P<0.05 versus control cells (J774A.1 in medium without LPS or IS).
Figure 5
Figure 5. Effect of IS on LPS-induced p65 nuclear translocation, NO release and iNOS expression.
J774A.1 cells were treated with IS (1000–62.5 µM) for 1 h and then co-exposed to LPS (1 µg/ml) for 20 min and nuclear translocation of NF-kB p65 subunit was detected using immunofluorescence assay at confocal microscopy. Scale bar, 10 µm. A representative of three experiments was shown (panel A). NF-kB activation is involved in NO release and iNOS protein expression. J774A.1 cells were treated with IS (1000–62.5 µM) for 1 h and then co-exposed to LPS (1 µg/ml) for further 24 h and NO (panel B) and iNOS (panel C) expression was detected by Griess reaction and Western blot respectively. Tubulin protein expression was used as loading control. Results are expressed as mean±s.e.m. from three independent experiments. Data were analyzed by ANOVA test, and multiple comparison were made by Bonferroni's test. °°° denotes P<0.001 versus control. ***, ** and * denote P<0.001, P<0.01 and P<0.05 resspectively versus LPS. Bar = 5 µM.
Figure 6
Figure 6. Effect of IS on LPS –induced IL-6 and TNF-α production in J774A.1 macrophages.
IL-6 (panel A) and TNF-α (panel B) production was measured in the supernatants of J774A.1 cells treated with IS (1000–62.5 µM) and LPS (1 µg/ml) for 18 h by an ELISA kit. Results are expressed as mean±s.e.m. from three independent experiments. Data were analyzed by ANOVA test, and multiple comparison were made by Bonferroni's test. °°° denotes P<0.001 versus control. ***, ** and * denote P<0.001, P<0.01 and P<0.05 respectively versus LPS.
Figure 7
Figure 7. Effect of IS on murine peritoneal macrophages.
ROS formation was evaluated by H2DCF-DA in peritoneal macrophages treated with IS (500–250 µM) for 1 h. Where indicated IS was also added together with LPS (1 µg/ml) for 15 minutes (panel A). Peritoneal macrophages were treated with IS (500–250 µM) for 1 h and then co-exposed to LPS (1 µg/ml) for further 24 h to assess NO release (panel B), iNOS (panel C) and COX 2 (panel D) expression. In order to evaluate the effect of IS on NF-kB pathway macrophage were treated with IS for 1 h, then together with LPS for 10 minutes and IkB- α degradation was assed by Western blot, a representative of three experiments was shown (panel E). Results are expressed as mean±s.e.m. from three independent experiments. Data were analyzed by ANOVA test, and multiple comparison were made by Bonferroni's test. °°° denotes P<0.001 versus control. ***, ** and * denote P<0.001, P<0.01 and P<0.05 respectively versus peritoneal macrophages treated with LPS alone.

References

    1. Vanholder R, Argiles A, Baurmeister U, Brunet P, Clark W, et al. (2001) Uremic toxicity: Present state of the art. Int J Artif Organs 24: 695–725. - PubMed
    1. Raff AC, Meyer TW, Hostetter TH (2008) New insights into uremic toxicity. Curr Opin Nephrol Hypertens 17: 560–565. - PubMed
    1. Di Micco L, Marzocco S, Sirico ML, Torraca S, Di Iorio B (2012) Does daily dialysis improve hypertension in chronic haemodialysis patients? Current Hypertension Reviews 8(4): 291–295.
    1. Niwa T, Takeda N, Tatematsu A, Maeda K (1988) Accumulation of indoxyl sulfate, an inhibitor of drug-binding, in uremic serum as demonstrated by internal-surface reversed-phase liquid chromatography. Clin Chem 34: 2264–2267. - PubMed
    1. Niwa T (2001) Uremic Toxicity, Indoxyl sulfate. In: Massry SG, Glassock RJ (eds). Textbook of Nephrology. Philadelphia, PA: LippincottWilliams & Wilkins, 1269–1272.

Publication types

MeSH terms