. 2013;14(10):R108.
doi: 10.1186/gb-2013-14-10-r108.

Cytosine methylation changes in enhancer regions of core pro-fibrotic genes characterize kidney fibrosis development

Cytosine methylation changes in enhancer regions of core pro-fibrotic genes characterize kidney fibrosis development

Yi-An Ko et al. Genome Biol. 2013.

Abstract

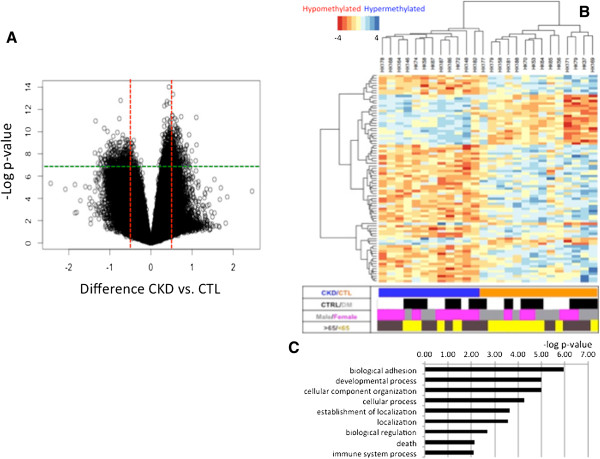
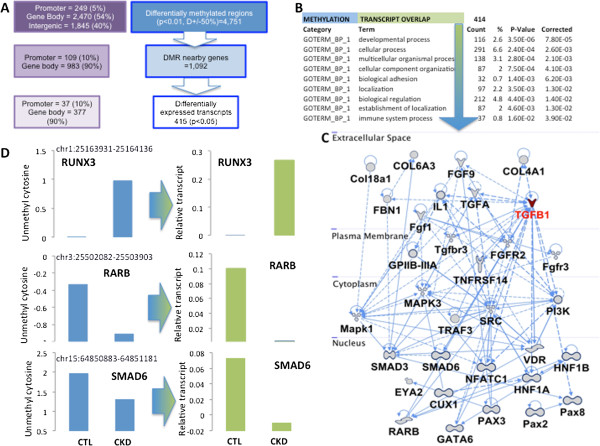
Background: One in eleven people is affected by chronic kidney disease, a condition characterized by kidney fibrosis and progressive loss of kidney function. Epidemiological studies indicate that adverse intrauterine and postnatal environments have a long-lasting role in chronic kidney disease development. Epigenetic information represents a plausible carrier for mediating this programming effect. Here we demonstrate that genome-wide cytosine methylation patterns of healthy and chronic kidney disease tubule samples obtained from patients show significant differences.

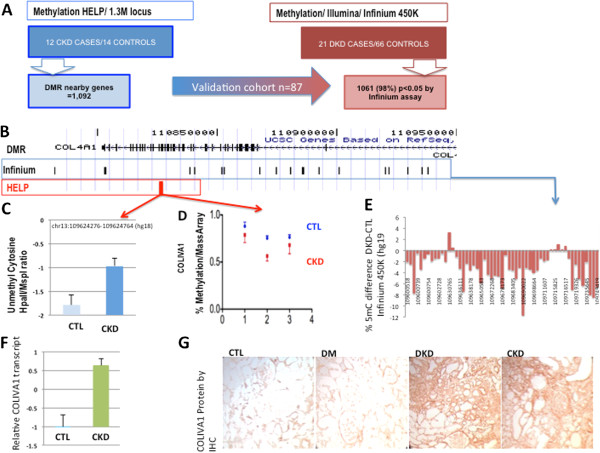
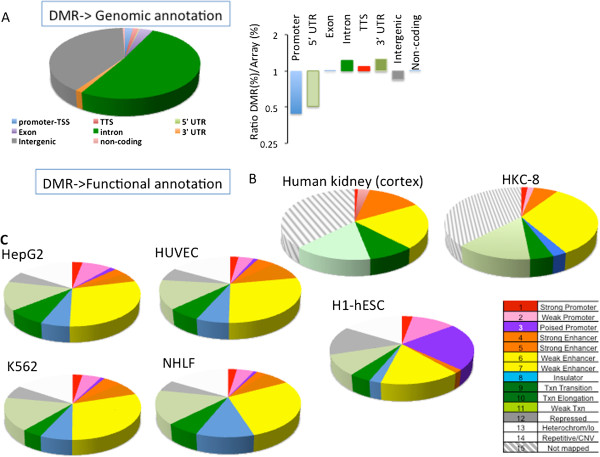
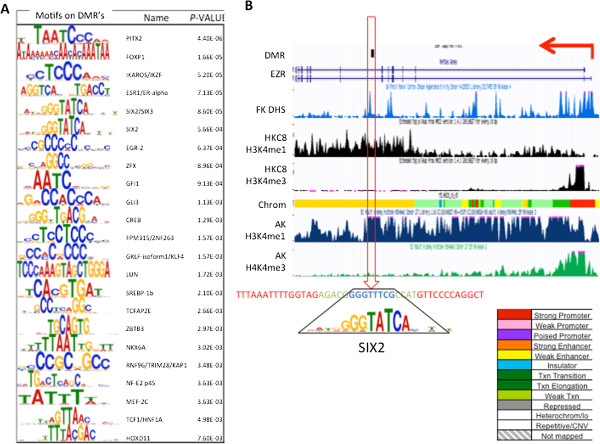
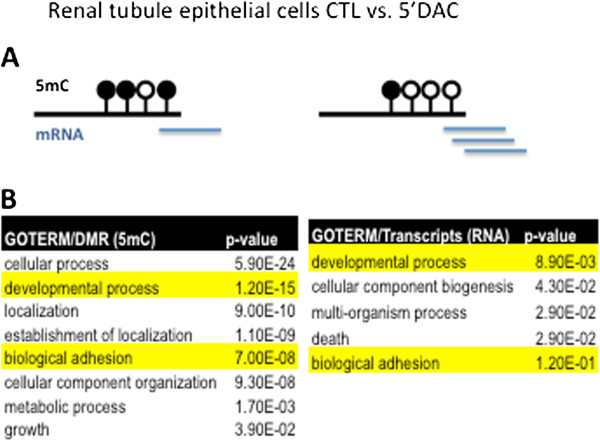
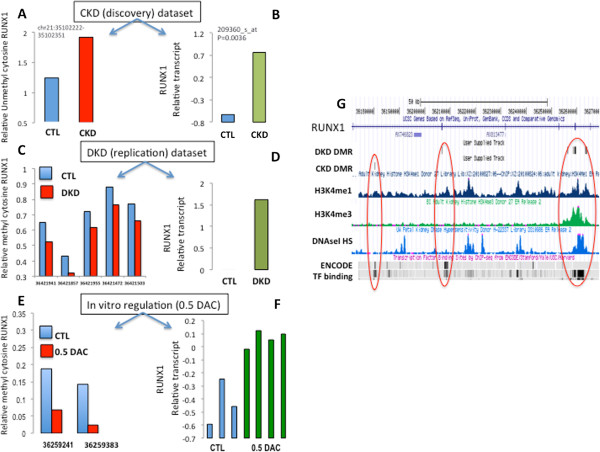
Results: We identify differentially methylated regions and validate these in a large replication dataset. The differentially methylated regions are rarely observed on promoters, but mostly overlap with putative enhancer regions, and they are enriched in consensus binding sequences for important renal transcription factors. This indicates their importance in gene expression regulation. A core set of genes that are known to be related to kidney fibrosis, including genes encoding collagens, show cytosine methylation changes correlating with downstream transcript levels.

Conclusions: Our report raises the possibility that epigenetic dysregulation plays a role in chronic kidney disease development via influencing core pro-fibrotic pathways and can aid the development of novel biomarkers and future therapeutics.


Figures

Figure 1
Figure 1
Statistically significant cytosine methylation differences in chronic kidney disease. (A) Volcano plot analysis of cytosine methylation differences. The x-axis represents the relative cytosine methylation difference of control (CTL) versus CKD samples, the y-axis represents the negative log2 of the P-value of that locus. The mean P-value and mean difference of 1.3 million loci present on the chips are plotted on the graph. The green and red lines represent the statistical criteria used for further analysis (P-value and fold change, respectively). (B) Hierarchical cluster analysis of the differentially methylated regions. Each column represents changes from one individual kidney sample; blue indicates hypermethylation in CKD, while red represents hypomethylation in CKD. The chart below shows the clinical parameters of the samples: glomerular filtration rate, diabetes status (DM, diabetes mellitus), sex, and age (aged >65 years or <65 years). (C) Gene Ontology analysis of the 1,535 DMRs mapped to unique genes using DAVID gene ontology annotation groups (biological process level 1 annotation).
Figure 2
Figure 2
External and internal validation of the observed changes. (A) Correlation of the DMRs identified in 26 samples using the HELP method and an external dataset containing 87 human kidney samples analyzed using Illumina Infinium 450K arrays. We found concordant regulation of 1,061 transcripts (98%) from the 1,092 mapped genes using this validation dataset. Of transcripts that showed both differential methylation and expression, 404 (97%) were confirmed. (B) An example of a DMR identified by the HELP assay and confirmed in the validation dataset. This DMR is localized in the intronic region of COLIVA1. (C) Methylation status and (D) gene expression of COLIVA1 in the original HELP dataset in control and CKD samples. (E) MassArray confirmation of methylation status of the COLIVA1 locus (blue is mean ± standard deviation of control samples, red is mean ± standard deviation of CKD samples). (F) Methylation status of the COLIVA1 locus in the validation dataset (Infinium 450K arrays). The data represent the mean differences in absolute methylation levels of individual cytosines at the COLIVA1 locus. (G) Immunohistochemistry of COLIVA1 expression in control (CTL), diabetic (DM), DKD and CKD kidneys.
Figure 3
Figure 3
Chronic kidney disease differentially methylated regions are localized to kidney-specific enhancer regions. (A) RefSeq annotation of the DMRs. Relative enrichment ratio of the DMRs compared with the representation of the different elements on the methylation microarray. TSS, transcription start site; TTS, transcription termination site. (B) DMRs overlap with regulatory element (chromatin state) annotation maps of renal tubule epithelial cells (HKC8) and adult kidney cortex, indicating that most differentially methylated cytosines are localized to enhancer (yellow and orange) regions in kidney epithelial cells. The color code annotation of the chromatin state map is provided bottom right. (C) Chromatin annotation of the DMRs in five different ENCODE cell lines (H1, human embryonic stem cells; HepG2, hepatocytes; HUVEC, endothelial cells; K562, erythroid cells; NHLF, human lung fibroblasts).
Figure 4
Figure 4
Chronic kidney disease differentially methylated regions are enriched for kidney-specific transcription factor binding sites. (A) The DMR and DHS sites contain consensus sequences. The transcription factor binding site motifs and their statistical enrichment from the de novo searched consensus sequences in DMR and DHS sites. (B) A specific example of an intronic DMR (within the EZR gene). The genomic location of the DMR is at the top, followed by the RefSeq representation of EZR; fetal kidney (FK)-specific DHS tracks (in blue); HKC8 cell-specific H3K4me1 and H3K4me3 tracks; HKC8 cell specific ChromHMM annotation of the locus (yellow, enhancer; red, promoter; green, transcription-associated region; the full color coding key is shown bottom right) - the sequences contain consensus-binding sites for the key kidney transcription factor SIX2/3, with the SIX2/3 binding motif illustrated as a sequence logo plot below; and adult kidney (AK)-specific H3K4me1 (blue) and H3K4me3 (green) tracks [19].
Figure 5
Figure 5
Differentially methylated regions correlate with transcript changes. (A) The 4,751 DMRs mapped to 1,092 unique genes that were present in the Affymetrix arrays. There were 415 transcripts that showed differences both in their methylation status and their expression in CKD samples. The RefSeq-based locations of the DMRs are also shown. While most differentially methylated regions localize to gene body regions, they also show correlation with the expression of many of those genes. Not only are the 415 transcripts differentially expressed, they also show differences in their cytosine methylation profiles as well. (B) DAVID-based gene ontology annotation of the 415 transcripts. (C) Network chart of the genes that are both differentially expressed and methylated). (D) Methylation and gene expression level of key molecules (RUNX3, RARB, SMAD6) identified by the network analysis in control (CTL) and CKD samples.
Figure 6
Figure 6
Regulation of transcripts by a DNA methyltransferase inhibitor in in vitro cultured human tubular epithelial cells. Gene ontology terms of transcripts showing differential expression in the decitabine-treated cells. (A) Illustration of regions that showed differential methylation of cultured HKC8 cells treated with 0.5 μM decitabine (5'DAC). CTL, control. (B) The interconnected network analysis highlighted the differential expression of cell adhesion and developmental pathways. These genes are also differentially expressed and methylated in the original CKD dataset. GO, gene ontology.
Figure 7
Figure 7
Gene body cytosine methylation changes drive gene expression differences. RUNX1 methylation and gene expression were examined only (A,B) In the original discovery dataset, the gene body region of RUNX1 was hypomethylated (A) and the corresponding transcript level was increased (B) in the CKD (discovery) dataset. CTL, control. (C,D) The differential methylation (C) and expression (D) of RUNX1 in the DKD replication dataset. (E,F) Transcript levels are increased (F) in vitro in cultured tubules after decreasing the methylation level of the locus following 0.5 μM decitabine (DAC) treatment (E). (G) Genomic representation of the RUNX1 locus showing DMRs in the DKD dataset and in the CKD dataset. Different tracks are shown for the RUNX1 locus, including RefSeq gene, DMRs in the DKD dataset, DMRs in the CKD cells, and histone ChIP-seq data for H3K4me1 and H3K4me3 for adult kidney cortex and DHS sites from fetal kidneys. In addition, ENCODE-based transcription factor binding sites are also shown.

References

    1. Jensen BL. Reduced nephron number, renal development and 'programming’ of adult hypertension. J Hypertens. 2004;14:2065–2066. doi: 10.1097/00004872-200411000-00006. - DOI - PubMed
    1. Woroniecki R, Gaikwad AB, Susztak K. Fetal environment, epigenetics, and pediatric renal disease. Pediatr Nephrol. 2011;14:705–711. doi: 10.1007/s00467-010-1714-8. - DOI - PMC - PubMed
    1. Pujadas E, Feinberg AP. Regulated noise in the epigenetic landscape of development and disease. Cell. 2012;14:1123–1131. doi: 10.1016/j.cell.2012.02.045. - DOI - PMC - PubMed
    1. Laird PW. Principles and challenges of genomewide DNA methylation analysis. Nat Rev Genet. 2010;14:191–203. - PubMed
    1. Weber W. Cancer epigenetics. Prog Mol Biol Transl Sci. 2010;14:299–349. - PubMed

Publication types

MeSH terms