. 2013;14(10):R109.
doi: 10.1186/gb-2013-14-10-r109.

High-efficiency RNA cloning enables accurate quantification of miRNA expression by deep sequencing

High-efficiency RNA cloning enables accurate quantification of miRNA expression by deep sequencing

Zhaojie Zhang et al. Genome Biol. 2013.

Abstract

Small RNA cloning and sequencing is uniquely positioned as a genome-wide approach to quantify miRNAs with single-nucleotide resolution. However, significant biases introduced by RNA ligation in current protocols lead to inaccurate miRNA quantification by 1000-fold. Here we report an RNA cloning method that achieves over 95% efficiency for both 5′ and 3′ ligations. It achieves accurate quantification of synthetic miRNAs with less than two-fold deviation from the anticipated value and over a dynamic range of four orders of magnitude. Taken together, this high-efficiency RNA cloning method permits accurate genome-wide miRNA profiling from total RNAs.


Figures

Figure 1
Figure 1
Current miRNA-Seq method yields inaccurate miRNA quantification. (A) Schematic of the two-step ligation protocol used to prepare small RNA libraries for deep sequencing. (B) Table of representative miRNAs from the 29 synthetic miRNA pool grouped by cluster where sequence differences are in red. (C) Representative result of deep sequencing from an equimolar mixture of the 29 synthetic miRNAs. Dashed line indicates expected cloning frequency for all, red bars indicate miRNAs with ≥50% GC content. Note the deviation is more than three orders of magnitude. (D) Deep sequencing data from previously published results, and one of our skin samples obtained from mouse hair follicle, grouped by miRNA clusters. Asterisks denote the absence of sequencing reads for a miRNA.
Figure 2
Figure 2
Improved 5′ ligation reactions reduce cloning bias. (A) Schematic of the 5′ ligation splint where the DNA splint is shown in black, the 5′ RNA ligation adapter is shown in green, the randomized nucleotides are shown as 'N', and the product of the 3′ ligation (miRNA + 3′ adapter) is shown in blue. (B) Representative result of deep sequencing from an equimolar mixture of the 29 synthetic miRNAs using the original cloning method (red bars) and the thermostable RNA ligase for the 5′ ligation (black bars). Dashed line indicates expected cloning frequency. (C) Same as in (B) except the splint structure shown in (A) is used for the 5′ ligation step. (D) Scatter plot amongst replicates of miRNA-Seq done with thermo-stable RNA ligase. (E) Same as in (D) except splint ligations are being compared. (F) Scatter plot of thermo-stable RNA ligation data as a function of splinted ligation. For all plots, error bars represent standard error of the mean.
Figure 3
Figure 3
Optimized RNA ligation conditions achieve high efficiency for both 3′ and 5′ ligation steps. (A) 3′ ligation efficiencies were determined by resolving ligation reactions with radiolabeled synthetic miRNA substrates and Linker-3 (Integrated DNA Technologies) on 15% Urea-PAGE. A dash indicates free miRNA; a dash with a box formula image indicates 3′ ligation product. The numbers at the bottom indicate the percentage of ligated species relative to the total. (B) 3′ ligation efficiencies were tested as in (A) with varying 3′ linkers and 10% w/v PEG8000. (C) 3′ ligation efficiency was enhanced by increasing the amount of NN linker used. The numbers at the top indicate fold molar excess of linker to substrate RNA. (D) A mixture of 29 synthetic miRNAs were radiolabeled and subjected to enhanced 3′ ligation conditions in the presence of 0.5 μg of total RNA obtained from mouse skin. The numbers at top indicate time in hours the reaction was carried out. (E) 5′ ligation efficiencies were assessed using gel-purified, radiolabeled, 3′ ligated, equimolar 29 synthetic miRNA mixtures with T4 RNL1 (left panel) at room temperature or with thermostable (TS) RNA ligase at 60°C (right panel) for 2 hours. The numbers at the bottom indicate the ligation efficiency, and a dash between two boxes indicates 5′ ligation product. (F) Optimized 5′ ligation reaction achieves 96% ligation efficiency.
Figure 4
Figure 4
High efficiency ligations capture synthetic miRNAs with high fidelity. (A) Deep sequencing data of an equimolar mixture of 29 synthetic miRNAs from high efficiency ligation reaction (blue bars) and previous method (red bars); the dashed line indicates expected result. For all high efficiency ligations, plotted is the average of at least two independent experiments where error bars represent the standard error of the mean. (B) As in (A) except the mix is composed of an equimolar mixture of 25 synthetic miRNAs (blue bars) and differential mixture of 4 let-7 miRNAs (black bars) where the ratio was let-7i:let-7c:let7f:let-7d = 0.01:0.1:1:10. (C) As in (A) except the synthetic mixture was combined with 0.5 μg C. elegans total RNA prior to ligations.
Figure 5
Figure 5
Optimized miRNA-Seq faithfully captures miRNAs from biological samples. (A) Deep sequencing data of mapped miRNA reads cloned from total RNA isolated from mouse brain and (B) heart. The most cloned miRNAs are shown with the cloning frequencies. (C) Deep sequencing data of miRNA reads for cistronic miRNAs obtained from mouse heart and brain. Note the highly similar representation of each cistronic miRNA by read numbers across four orders of magnitude, except for the miR-451/144 cluster.
Figure 6
Figure 6
Identification and quantification of the major miR-203 isoforms in skin by deep sequencing. (A) Table showing miR-203 with differential 5′ ends (shown in red). (B) Primer extension for miR-203 using RNA isolated from mouse total epidermis where upper band corresponds to miR-203 and lower corresponds to miR203iso. Dicer conditional knock out skin sample was used as a control. (C) Northern blot probed for miR-203. Left panel shows synthetic miRNA controls, and right panel shows mouse keratinocyte cultures where miR-203 was lowly expressed under the proliferative condition and highly induced in the differentiated condition. Staining of tRNAs by ethidium bromide (EtBr) is shown as the loading control.
Figure 7
Figure 7
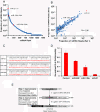
The potency of miRNA-mediated repression correlates with expression levels. (A) miRNA-Seq results from 1 μg of HeLa total RNA. Red dots indicate miRNAs of interest with their rank by cloning frequency shown in parentheses. (B) Scatter plot of the top 250 miRNAs from two HeLa miRNA-Seq experiments; miRNAs of interest are in red. (C) Schematic of the luciferase targeting constructs for miR-21, miR-130 and miR-502. The red sequences are the tandem target sites located in the 3′ UTR of the luciferase mRNA, and the black sequences are the miRNAs. (D) Ratios of firefly to renilla luciferase activities in HeLa cultures transfected with miRNA-reporter constructs. Shown is a representative result from three independent experiments. Error bars are the standard deviation from a single experiment where transfections were done in quadruplicate for each construct. (E) Schematic depicting the workflow for the optimized miRNA-Seq approach to profiling miRNAs.

References

    1. Bartel DP. MicroRNAs: target recognition and regulatory functions. Cell. 2009;14:215–233. - PMC - PubMed
    1. Lewis BP, Burge CB, Bartel DP. Conserved seed pairing, often flanked by adenosines, indicates that thousands of human genes are microRNA targets. Cell. 2005;14:15–20. - PubMed
    1. Xie X, Lu J, Kulbokas EJ, Golub TR, Mootha V, Lindblad-Toh K, Lander ES, Kellis M. Systematic discovery of regulatory motifs in human promoters and 3′ UTRs by comparison of several mammals. Nature. 2005;14:338–345. - PMC - PubMed
    1. Lim LP, Lau NC, Garrett-Engele P, Grimson A, Schelter JM, Castle J, Bartel DP, Linsley PS, Johnson JM. Microarray analysis shows that some microRNAs downregulate large numbers of target mRNAs. Nature. 2005;14:769–773. - PubMed
    1. Giraldez AJ, Mishima Y, Rihel J, Grocock RJ, Van Dongen S, Inoue K, Enright AJ, Schier AF. Zebrafish MiR-430 promotes deadenylation and clearance of maternal mRNAs. Science. 2006;14:75–79. - PubMed

Publication types

Associated data