. 2013 Nov 4;10(11):4263-71.
doi: 10.1021/mp400357v. Epub 2013 Oct 22.

In vivo imaging of bone using a deep-red fluorescent molecular probe bearing multiple iminodiacetate groups

Affiliations

In vivo imaging of bone using a deep-red fluorescent molecular probe bearing multiple iminodiacetate groups

Kara M Harmatys et al. Mol Pharm. .

Abstract

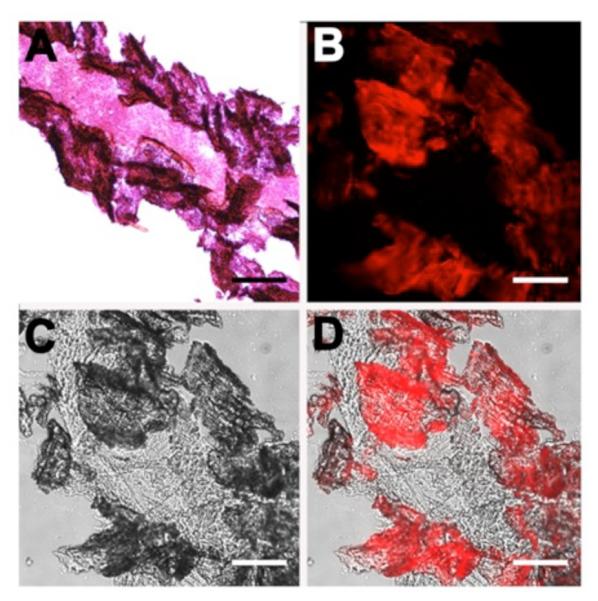
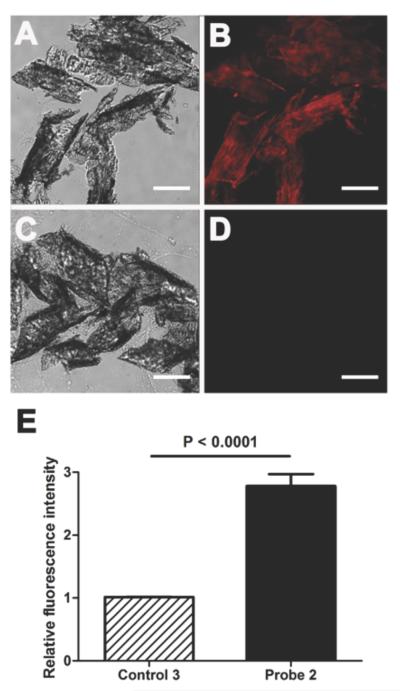
Deep-red fluorescent molecular probes are described that have a dendritic molecular architecture with a squaraine rotaxane core scaffold and multiple peripheral iminodiacetate groups as the bone targeting units. Iminodiacetates have an inherently lower bone affinity than bisphosphonates, and a major goal of the study was to determine how many appended iminodiacetate groups are required for effective deep-red fluorescence imaging of bone in living rodents. A series of in vitro and in vivo imaging studies showed that a tetra(iminodiacetate) probe stains bones much more strongly than an analogous bis(iminodiacetate) probe. In addition, a control tetra(iminodipropionate) probe exhibited no bone targeting ability. The tetra(iminodiacetate) probe targeted the same regions of high bone turnover as the near-infrared bisphosphonate probe OsteoSense750. Longitudinal studies showed that the fluorescence image signal from living mice treated with the tetra(iminodiacetate) probe was much more stable over 19 days than the signal from OsteoSense750. The narrow emission band of the tetra(iminodiacetate) probe makes it very attractive for inclusion in multiplex imaging protocols that employ a mixture of multiple fluorescent probes in preclinical studies of bone growth or in fluorescence guided surgery. The results also suggest that molecules or nanoparticles bearing multivalent iminodiacetate groups have promise as bone targeting agents with tunable properties for various pharmaceutical applications.


Figures

Figure 1
Figure 1
Structures of fluorescent squaraine rotaxane molecular probes; bis(iminodiacetate) 1, tetra(iminodiacetate) 2, and tetra(iminodipropionate) 3.
Figure 2
Figure 2
Representative histological slices of tibia extracted from a healthy SKH1 mouse. The slices were subjected either to Hematoxylin/Eosin staining (A) or incubation with targeted probe 2 (10 μM) in water (B–D) for 1 h. The brightfield image (C) and deep-red fluorescence emission image due to staining by probe 2 (B) is merged in panel (D). Scale bar = 0.16 mm for all panels.
Figure 3
Figure 3
Representative histological slices of tibia extracted from a healthy SKH1 mouse. The slices were incubated with targeted probe 2 (10 μM) (A–B) or untargeted control 3 (10 μM) (C–D) in water for 1 h. Micrographs were acquired using brightfield (A, C) or Cy5 fluorescence (B, D) filter sets. Scale bar = 0.16 mm for all panels. The graph (E) shows the relative ratio of fluorescence mean pixel intensity for panels (B) and (D) and is normalized to the fluorescence of control 3 (N = 5).
Figure 4
Figure 4
Representative histological slices of tibia extracted from a healthy SKH1 mouse. The slices were subjected to decalcification for 16 h with 0.25 M EDTA (C, D) or no incubation with EDTA (A, B), then subjected to incubation with targeted probe 2 (10 μM) in water for 1 h. Micrographs were acquired using the brightfield (A, C) or Cy5 fluorescence (B, D) filter sets. Scale bar = 0.16 mm for all panels. The graph (E) shows the relative ratio of fluorescence mean pixel intensity for panels (B) and (D) which is normalized to the fluorescence of cells treated with EDTA (N = 5).
Figure 5
Figure 5
Representative deep-red fluorescent dorsal images of living mice treated with 20 nmol of divalent probe 1 (A) or tetravalent probe 2 (B). Images were acquired at the indicated time points after intraperitoneal injection the molecular probe in water (N = 3). The fluorescence pixel intensity scale bar applies to all images. Lateral images of the same animals are shown in Figure S6.
Figure 6
Figure 6
Region of interest analysis of the mouse imaging data in Figure 5. The graph shows mean pixel intensity, normalized to the 1 h post-injection time point, for the whole animal treated with 20 nmol of divalent probe 1 (dotted line) or tetravalent probe 2 (solid line). Error bars represent the standard error mean (N = 3).
Figure 7
Figure 7
Representative deep-red fluorescent dorsal image of two skinless mice that had been dosed with 20 nmol of divalent probe 1 (A) or tetravalent probe 2 (B) and euthanized 24 h later. The fluorescence pixel intensity scale bar applies to both images (N = 3).
Figure 8
Figure 8
Representative dorsal (A), leg (B), and chest (C) images of a skinless mouse. The X-ray, deep-red fluorescence, and merged images show a SKH1 hairless mouse that had been dosed with 20 nmol of probe 2 and euthanized 24 h later (N = 3).
Figure 9
Figure 9
Representative dorsal (A), leg (B), and chest (C) in vivo fluorescence images of skinless mice that had been treated with probe 2 (4 nmol) via an intraperitoneal injection and OsteoSense®750 (2 nmol) via an retro-orbital injection. The images were acquired immediately after euthanization at 24 h post-injection of the probes and show fluorescence from probe 2 (ex: 630/10 nm, em: 700/20 nm), fluorescence from OsteoSense®750 (ex: 730/10 nm, em: 790/20 nm), and a merged image (N = 3).
Figure 10
Figure 10
Representative histological slice from the tibia of a healthy young rat injected at t = 0 with Xylenol Orange (17 mg/kg), then probe 2 (1.9 mg/kg) at t = 4 days, and euthanized at t = 5 days. A: brightfield image; B: fluorescence image showing Xylenol Orange (ex: 535 nm, em: 610 nm); C: fluorescence image showing probe 2 (ex: 630 nm, em: 700 nm); D: merge of panels (B) and (C). Scale bar = 0.16 mm.

References

    1. Kubicek V, Lukes I. Bone-seeking probes for optical and magnetic resonance imaging. Future Med. Chem. 2010;2:521–531. - PubMed
    1. Low SA, Kopeček J. Targeting polymer therapeutics to bone. Adv. Drug Deliver. Rev. 2012;64:1189–1204. - PMC - PubMed
    1. Wang D, Miller SC, Shlyakhtenko LS, Portillo AM, Liu X-M, Papangkorn K, Kopečková P, Lyubchenko Y, Higuchi WI, Kopeček J. Osteotropic peptide that differentiates functional domains of the skeleton. Bioconjug. Chem. 2007;18:1375–1378. - PubMed
    1. Pautke C, Vogt S, Tischer T, Wexel G, Deppe H, Milz S, Schieker M, Kolk A. Polychrome labeling of bone with seven different fluorochromes: enhancing fluorochrome discrimination by spectral image analysis. Bone. 2005;37:441–445. - PubMed
    1. Stuart AJ, Smith DA. Use of the fluorochromes xylenol orange, calcein green, and tetracycline to document bone deposition and remodeling in healing fractures in chickens. Avian Dis. 1992;36:447–449. - PubMed

Publication types