Comparative Study
. 2013 Dec 1;591(23):5959-75.
doi: 10.1113/jphysiol.2013.259796. Epub 2013 Oct 7.

Identification of unique release kinetics of serotonin from guinea-pig and human enterochromaffin cells

Affiliations
Comparative Study

Identification of unique release kinetics of serotonin from guinea-pig and human enterochromaffin cells

Ravinarayan Raghupathi et al. J Physiol. .

Abstract

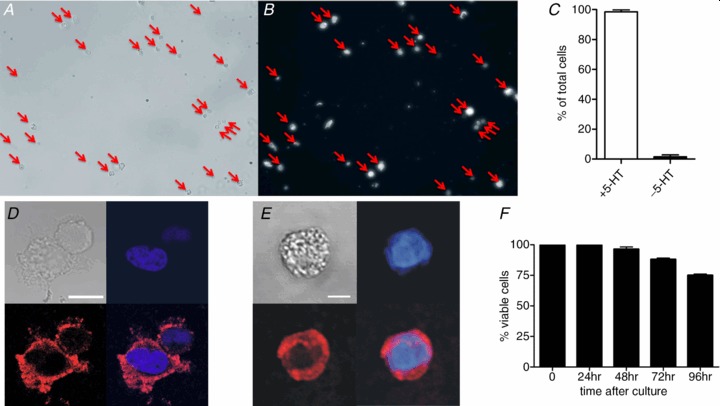
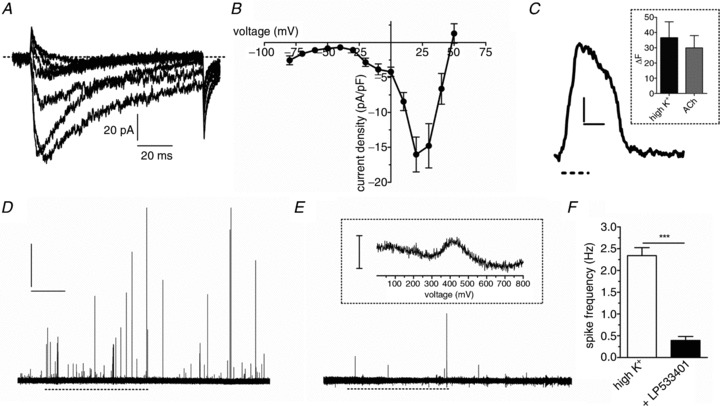
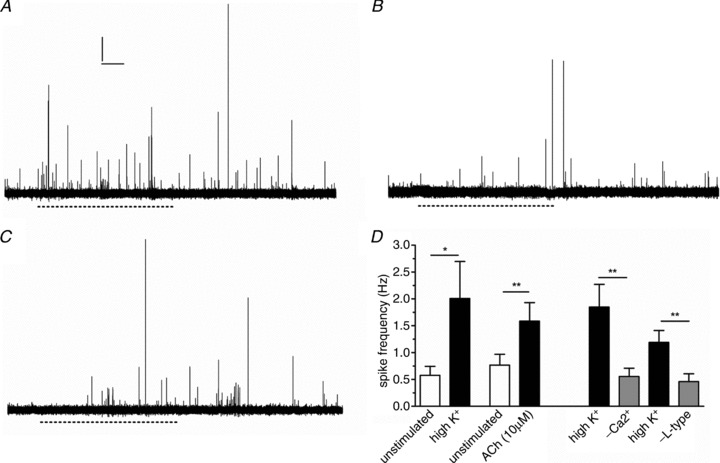
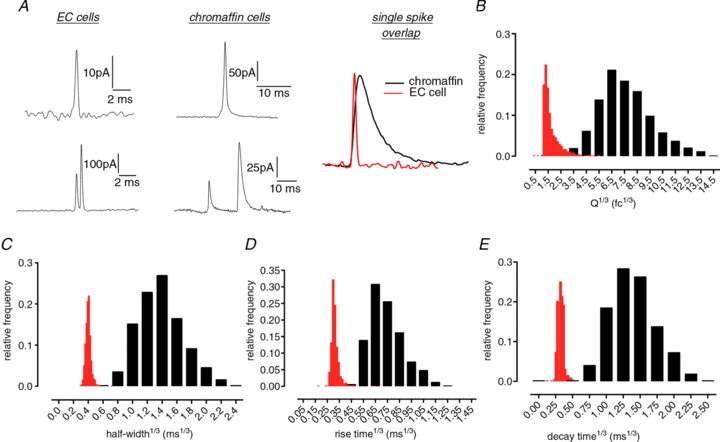
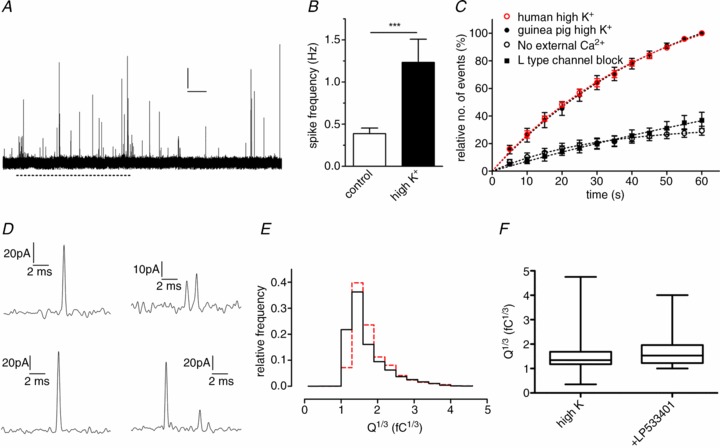
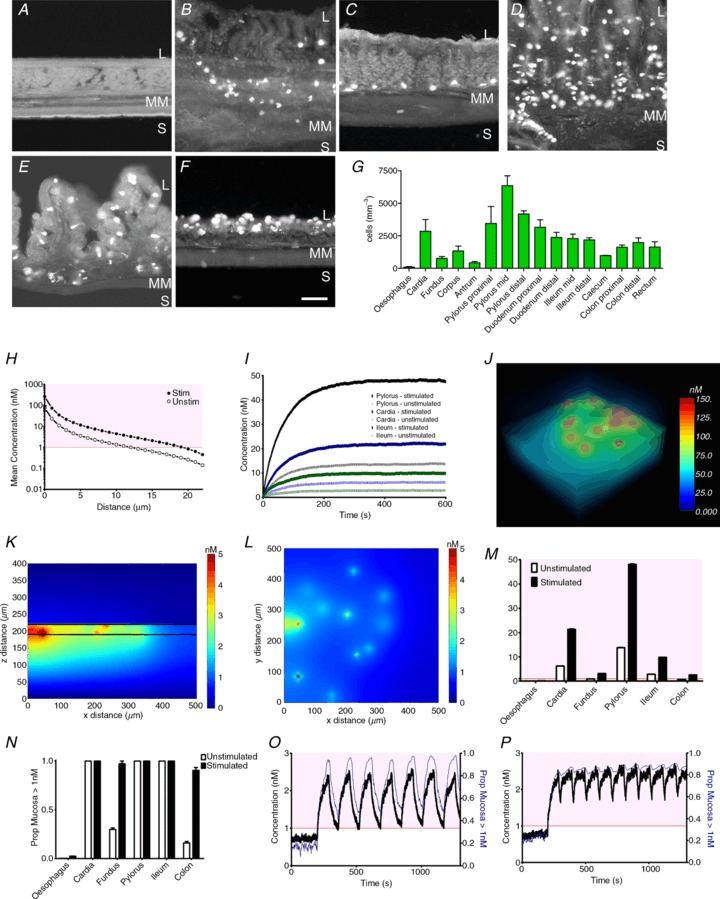
The major source of serotonin (5-HT) in the body is the enterochromaffin (EC) cells lining the intestinal mucosa of the gastrointestinal tract. Despite the fact that EC cells synthesise ∼95% of total body 5-HT, and that this 5-HT has important paracrine and endocrine roles, no studies have investigated the mechanisms of 5-HT release from single primary EC cells. We have developed a rapid primary culture of guinea-pig and human EC cells, allowing analysis of single EC cell function using electrophysiology, electrochemistry, Ca(2+) imaging, immunocytochemistry and 3D modelling. Ca(2+) enters EC cells upon stimulation and triggers quantal 5-HT release via L-type Ca(2+) channels. Real time amperometric techniques reveal that EC cells release 5-HT at rest and this release increases upon stimulation. Surprisingly for an endocrine cell storing 5-HT in large dense core vesicles (LDCVs), EC cells release 70 times less 5-HT per fusion event than catecholamine released from similarly sized LDCVs in endocrine chromaffin cells, and the vesicle release kinetics instead resembles that observed in mammalian synapses. Furthermore, we measured EC cell density along the gastrointestinal tract to create three-dimensional (3D) simulations of 5-HT diffusion using the minimal number of variables required to understand the physiological relevance of single cell 5-HT release in the whole-tissue milieu. These models indicate that local 5-HT levels are likely to be maintained around the activation threshold for mucosal 5-HT receptors and that this is dependent upon stimulation and location within the gastrointestinal tract. This is the first study demonstrating single cell 5-HT release in primary EC cells. The mode of 5-HT release may represent a unique mode of exocytosis amongst endocrine cells and is functionally relevant to gastrointestinal sensory and motor function.


Figures

Figure 1
Figure 1. Isolation and purification of primary EC cells
Low magnification of EC cells in culture labelled with a 5-HT antibody and viewed under brightfield (A) and immunofluorescence (B). Red arrows illustrate 5-HT staining in these cells. C, cells staining positively for both 5-HT and the nuclear marker DAPI, demonstrating >98% pure EC cell culture (n= 3 cultures, ***P < 0.001). D, higher magnification of these cells using confocal microscopy observed in brightfield (top left), the nuclear stain DAPI (blue), punctuate cytoplasmic 5-HT immunoreactivity (red) and the merged image. Scale = 8 μm. E, these cells also contain the EC cell marker Tph1. Scale = 5 μm. F, viability assay demonstrates cells are healthy in culture (n= 4 cell cultures).
Figure 2
Figure 2. Stimulation of primary EC cells causes Ca2+ entry and 5-HT release
A, Ca2+ currents elicited from −80 mV holding potential, stepped for 100 ms to −20 mV to +30 mV in 10 mV increments. B, current density–voltage relationship of these Ca2+ currents (n= 6). C, example trace of Ca2+ entry in a single cell stimulated with 70 mm K+ (dashed line, Scale = 10 s and 5 fluorescence points). Inset, average EC cell fluorescence change in response to 70 mm K+ or acetylcholine (ACh, 10 μm, n= 13 cells for both groups). D, amperometry measures 5-HT release from single EC cells. 70 mm K+ solution (dashed line) triggers 5-HT release from single vesicles as indicated by individual current spikes. E, inset, oxidation current in 5-HT (10 μm) when voltage is ramped from 0 to 0.8 V using cyclic voltammetry demonstrates +400 mV as the peak oxidation current for 5-HT. Scale bar = 100 pA. Cells treated for 24 h with the Tph inhibitor LP533401 (1 μm) have almost no 5-HT release (E) and this decrease is significant (F; ***P < 0.001, n= 9–12 cells). Scale bars in C and D represent 100 pA and 20 s.
Figure 3
Figure 3. EC cell 5-HT release is dependent on external Ca2+ entry via voltage-gated Ca2+ channels
K+ at 70 mm (dashed line) triggers 5-HT release in the presence of external Ca2+ (A) and in the same cell when external Ca2+ is removed (B). C, a similar effect is seen in cells exposed to the L-type Ca2+ channel antagonist nicardipine (2 μm). Scale bars in A represent 20 pA and 10 s and apply to A, B and C. D, quantification of spike frequency demonstrates that 70 mm K+ (n= 18 paired recordings, *P < 0.05) and acetylcholine (ACh, n= 16 paired recordings, **P < 0.01) increase the number of 5-HT release events and high K+-induced release is reduced in the absence of external Ca2+ (n= 6 paired recordings, **P < 0.01) or presence of nicardipine (n= 8 paired recordings, **P < 0.01).
Figure 4
Figure 4. EC cell 5-HT release occurs with synaptic-like release kinetics
A, individual release events from EC cells are more rapid than those in adrenal chromaffin cells. An example spike from each cell type is overlaid for comparison B, a comparison of spike area distribution illustrates that the amount of EC cell 5-HT released per fusion event represents a separate population to release events from chromaffin cells. Faster release kinetics in EC cells are further illustrated by comparing the frequency distribution of spike half-width (C), rise time (D) or decay time (E) in both cell types. n= 2113 spikes from 24 EC cell recordings and 781 spikes from 16 chromaffin cell recordings. Red bars = EC cell data, black bars = chromaffin cell data.
Figure 5
Figure 5. Human EC cells also release 5-HT with synaptic kinetics
A, an amperometric recording from a human EC cell in response to 70 mm K+ (dashed line) exposure. Scale bar = 20 pA and 10 s. B, average spike frequency is significantly increased by stimulation (n= 21 cells from 4 cultures, ***P < 0.001). C, relative number of events over time is similar in human and guinea-pig EC cells stimulated by 70 mm K+ while lack of external Ca2+ or L-type Ca2+ channel block similarly reduce cumulative spike frequency. D, single amperometric spikes from human EC cells have rapid kinetics. E, the distribution of spike area (Q1/3) in human cells (n= 1542 spikes from 21 recordings, red) is the same as that in guinea-pig cells (n= 2113 spikes from 24 recordings, black). F, reducing 5-HT availability by treatment of guinea-pig EC cells with the Tph inhibitor LP533401 (1 μm) does not affect the amount of 5-HT released per vesicle.
Figure 6
Figure 6. Simulated 5-HT diffusion in the GI tract mucosal layer
EC cells 5-HT immunoreactivity in six representative regions of the guinea-pig GI tract including the oesophagus (A), cardia (B), fundus (C), pylorus (D), ileum (E) and colon (F). L = lumen, S = serosa, MM = muscularis mucosa; Scale bar in F represents 30 μm and applies to panels A–F. G, average density of EC cells in various sections of the GI tract. H, diffusion of 5-HT after release from a single EC cell in stimulated and unstimulated conditions (n= 6 simulations). I, effect of stimulation on the evolution of steady-state 5-HT concentration (from starting point of 0 mm) in different gut regions. J, 3D image of modelled steady-state 5-HT concentrations at a single time point. K and L, mean 5-HT concentrations throughout the x–z plane (K) and x–y plane in the colon (L). M, average steady-state 5-HT concentrations in different gut regions (n= 5 simulations). N, proportion of cells in different regions exposed to an average 5-HT concentration >1 nm (n= 5 simulations). O, model of contraction-induced alterations in average 5-HT level (black) and proportion of cells exposed to >1 nm 5-HT (blue) in the colon. P, increasing contraction frequency will ultimately lead to constant average 5-HT levels >1 nm (red line) and a higher proportion of cells exposed to >1 nm 5-HT.

References

    1. Albillos A, Dernick G, Horstmann H, Almers W, Alvarez de Toledo G, Lindau M. The exocytotic event in chromaffin cells revealed by patch amperometry. Nature. 1997;389:509–512. - PubMed
    1. Bertrand PP. Real-time detection of serotonin release from enterochromaffin cells of the guinea-pig ileum. Neurogastroenterol Motil. 2004;16:511–514. - PubMed
    1. Bertrand PP. Real-time measurement of serotonin release and motility in guinea-pig ileum. J Physiol. 2006;577:689–704. - PMC - PubMed
    1. Bertrand PP, Barajas-Espinosa A, Neshat S, Bertrand RL, Lomax AE. Analysis of real-time serotonin (5-HT) availability during experimental colitis in mouse. Am J Physiol Gastrointest Liver Physiol. 2010;298:G446–G455. - PubMed
    1. Bischoff SC, Mailer R, Pabst O, Weier G, Sedlik W, Li Z, Chen JJ, Murphy DL, Gershon MD. Role of serotonin in intestinal inflammation: knockout of serotonin reuptake transporter exacerbates 2,4,6-trinitrobenzene sulfonic acid colitis in mice. Am J Physiol Gastrointest Liver Physiol. 2009;296:G685–G695. - PubMed

Publication types

LinkOut - more resources