. 2014 Jan 1:84:672-80.
doi: 10.1016/j.neuroimage.2013.09.057. Epub 2013 Oct 4.

Dynamic and static contributions of the cerebrovasculature to the resting-state BOLD signal

Affiliations

Dynamic and static contributions of the cerebrovasculature to the resting-state BOLD signal

Sungho Tak et al. Neuroimage. .

Abstract

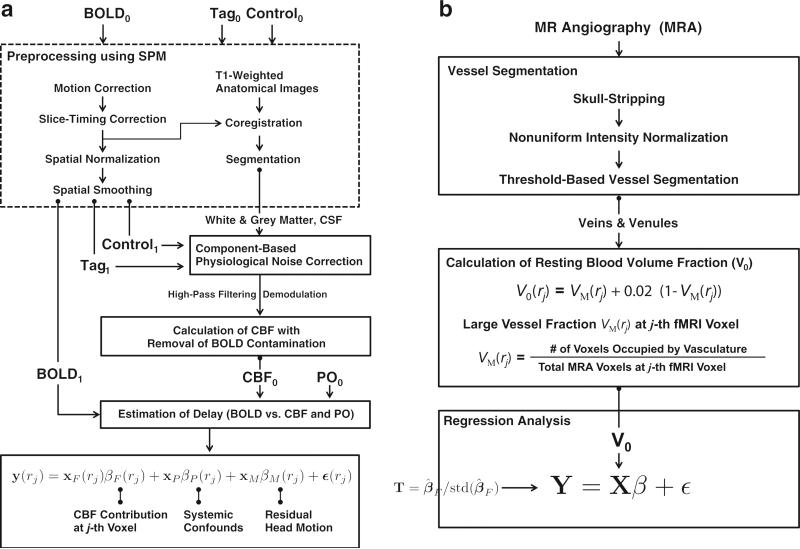
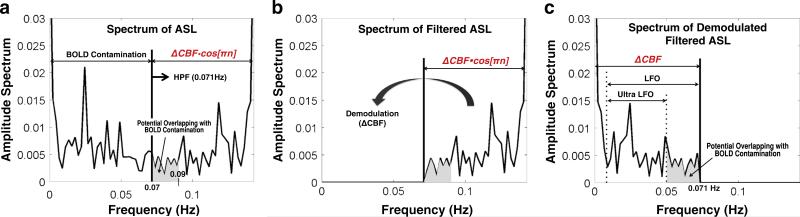
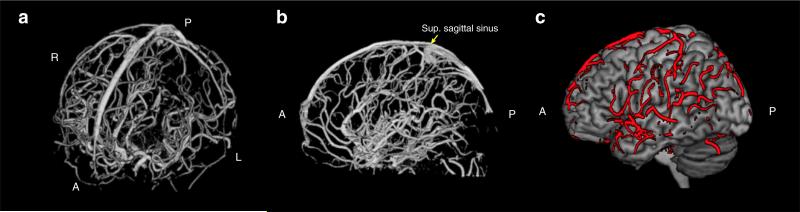
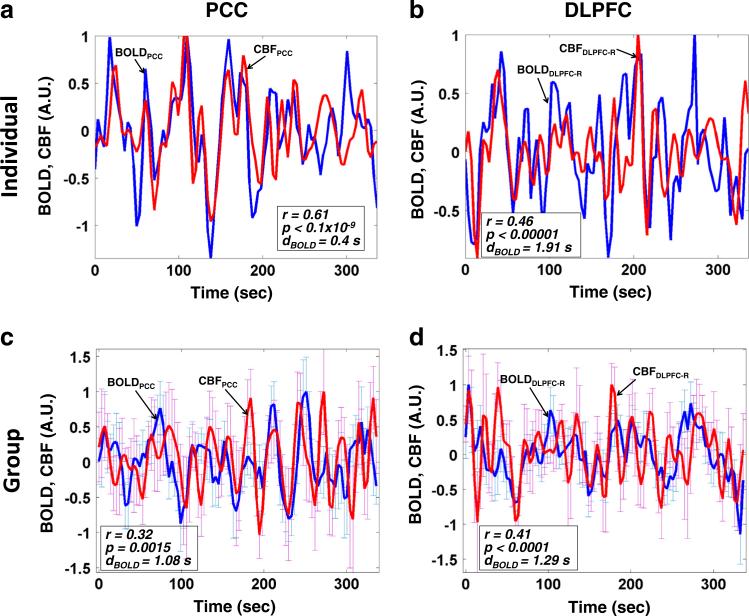
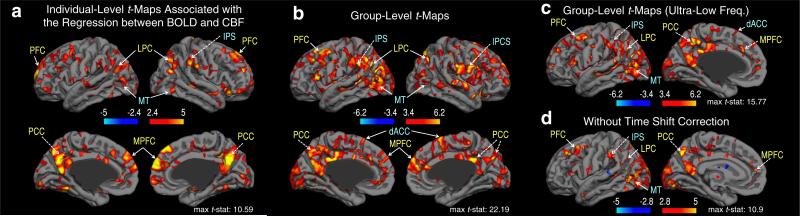
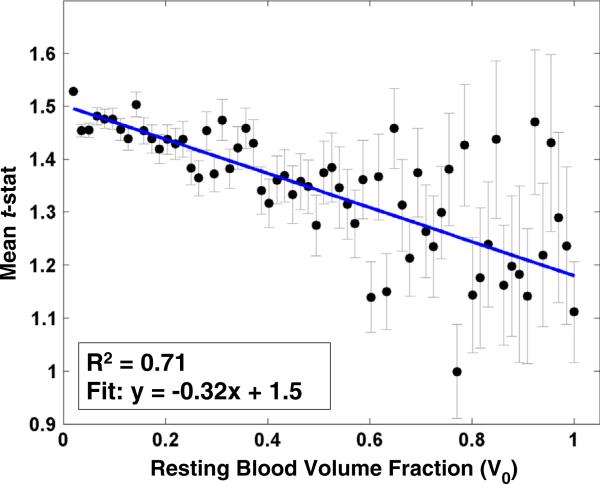
Functional magnetic resonance imaging (fMRI) in the resting state, particularly fMRI based on the blood-oxygenation level-dependent (BOLD) signal, has been extensively used to measure functional connectivity in the brain. However, the mechanisms of vascular regulation that underlie the BOLD fluctuations during rest are still poorly understood. In this work, using dual-echo pseudo-continuous arterial spin labeling and MR angiography (MRA), we assess the spatio-temporal contribution of cerebral blood flow (CBF) to the resting-state BOLD signals and explore how the coupling of these signals is associated with regional vasculature. Using a general linear model analysis, we found that statistically significant coupling between resting-state BOLD and CBF fluctuations is highly variable across the brain, but the coupling is strongest within the major nodes of established resting-state networks, including the default-mode, visual, and task-positive networks. Moreover, by exploiting MRA-derived large vessel (macrovascular) volume fraction, we found that the degree of BOLD-CBF coupling significantly decreased as the ratio of large vessels to tissue volume increased. These findings suggest that the portion of resting-state BOLD fluctuations at the sites of medium-to-small vessels (more proximal to local neuronal activity) is more closely regulated by dynamic regulations in CBF, and that this CBF regulation decreases closer to large veins, which are more distal to neuronal activity.

Keywords: Arterial-spin labeling (ASL); Blood volume fraction; Cerebral blood flow (CBF); MR angiography; Resting-state BOLD.


Figures

Fig. 1
Fig. 1
Schematics of proposed methods. The main modules are: (a) estimation of the CBF contribution to resting-state BOLD signal during resting-state, and (b) linear regression analysis with resting blood volume fraction.
Fig. 2
Fig. 2
Estimation of CBF signals from pCASL data. Single-sided amplitude spectrum of (a) the initial ASL signal, (b) the high-pass filtered ASL signal, and (c) demodulated and high-pass filtered ASL signal. BOLD contamination of the CBF signal was substantially reduced using the procedure introduced in Chuang et al. (2008). However, within the frequency spectrum of the estimated CBF signal (i.e., 0–0.071 Hz), residual BOLD contamination might still be found in the range of 0.05–0.07 Hz (c). Therefore, in order to investigate the BOLD–CBF coupling during resting-state, we also tested the BOLD–CBF coupling using the CBF signal in the low-frequency oscillation range (LFO, 0.009–0.071 Hz) as well as the ultra-low frequency oscillation range (Ultra UFO, 0.009–0.05 Hz).
Fig. 3
Fig. 3
3D visualization of the vessel segmentation obtained from the MR angiography scan. (a) Anterior–dorsal view of the vascular tree; (b) sagittal view of the medial and intracranial vessels; and (c) sagittal view of the pial vessels located at the surface of cortex, outlined in red. Volume rendering of the blood vessels was performed using MRIcron (http://www.mccauslandcenter.sc.edu/mricro/mricron/). Abbreviations: A: anterior, P: posterior, L: left, R: right, Sup: superior.
Fig. 4
Fig. 4
Regional-mean time series of BOLD (blue) and CBF (red) in select brain regions. We examined the posterior cingulate cortex (PCC, (a, c)) and the right dorsolateral prefrontal cortex (DLPFC-R, (b, d)). The time series for one illustrative subjective are shown in (a) and (b), whereas the corresponding group-average time courses are shown in (c) and (d). The error bars represent the standard error of the mean (SEM) across individuals at each time point.
Fig. 5
Fig. 5
Association between resting-state BOLD and CBF time course: t-statistics. (a) A sample individual t-map (uncorrected p < 0.01), and the corresponding group t-maps for testing the BOLD–CBF coupling of (b) low-frequency oscillations (0.009–0.071 Hz, uncorrected p < 0.005), (c) ultra-low frequency oscillations (0.009–0.05 Hz, uncorrected p < 0.005), and (d) low-frequency oscillations without shifting the BOLD signal with respect to the vascular regressors, including CBF and pulse oximetry (uncorrected p < 0.01). Note that CBF and BOLD are significantly consistent in prominent resting-state networks (including the DMN and visual network, labeled in yellow) as well as in the task-positive network (marked in cyan). Moreover, within ultra-low frequencies minimally overlapped with the frequency band of BOLD contamination, the spatial distribution of BOLD–CBF coupling remained consistent with the major nodes of DMN and task-positive network. In addition, the low-frequency BOLD–CBF coupling was preserved when the potential time delays between BOLD and vascular regressors were not compensated for. These suggest that our estimated BOLD–CBF coupling is not likely to be dominated by BOLD–CBF cross-contamination or by the time-delay estimations, but represents synchronized oscillations of BOLD and CBF. Abbreviations: PFC: prefrontal cortex, PCC: posterior cingulate cortex, MPFC: medial prefrontal cortex, LPC: lateral parietal cortex, IPS: intraparietal sulcus, IPCS: inferior precentral sulcus, dACC: dorsal anterior cingulate cortex, MT: medial temporal region.
Fig. 6
Fig. 6
Linear regression of the regional mean t-statistics of the BOLD–CBF association against resting blood volume fraction (V0) associated with regional vasculature. The coefficient of determination (R2) was 0.71. The error bar indicates the standard error of the mean (SEM). The degree of the positive coupling between BOLD and CBF significantly decreased as the macrovascular volume fraction (V0) increased.

References

    1. Aguirre GK, Detre JA, Zarahn E, Alsop DC. Experimental design and the relative sensitivity of BOLD and perfusion fMRI. Neuroimage. 2002;15(3):488–500. - PubMed
    1. Alsop D, Detre J. Reduced transit-time sensitivity in noninvasive magnetic resonance imaging of human cerebral blood flow. J. Cereb. Blood Flow Metab. 1996;16(6):1236–1249. - PubMed
    1. Behzadi Y, Restom K, Liau J, Liu TT. A component based noise correction method (CompCor) for BOLD and perfusion based fMRI. Neuroimage. 2007;37(1):90–101. - PMC - PubMed
    1. Birn RM. The role of physiological noise in resting-state functional connectivity. Neuroimage. 2012;62(2):1–7. - PubMed
    1. Biswal B, Yetkin FZ, Haughton VM, Hyde JS. Functional connectivity in the motor cortex of resting human brain using echo-planar MRI. Magn. Reson. Med. 1995;34(4):537–541. - PubMed

Publication types