. 2013 Oct 14;203(1):129-47.
doi: 10.1083/jcb.201212024. Epub 2013 Oct 7.

An in vitro assay for entry into cilia reveals unique properties of the soluble diffusion barrier

Affiliations

An in vitro assay for entry into cilia reveals unique properties of the soluble diffusion barrier

David K Breslow et al. J Cell Biol. .

Abstract

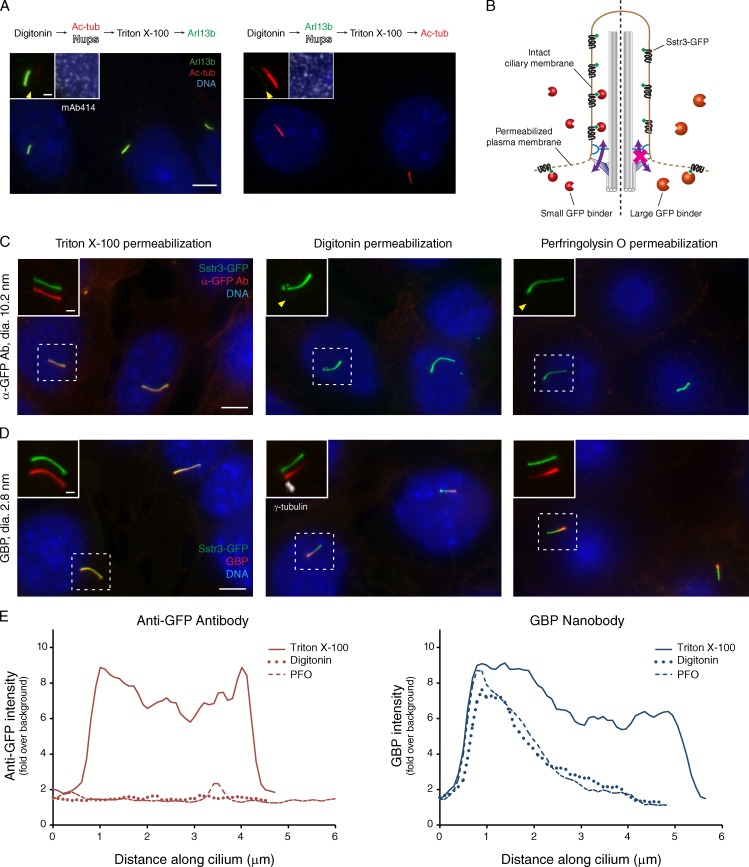
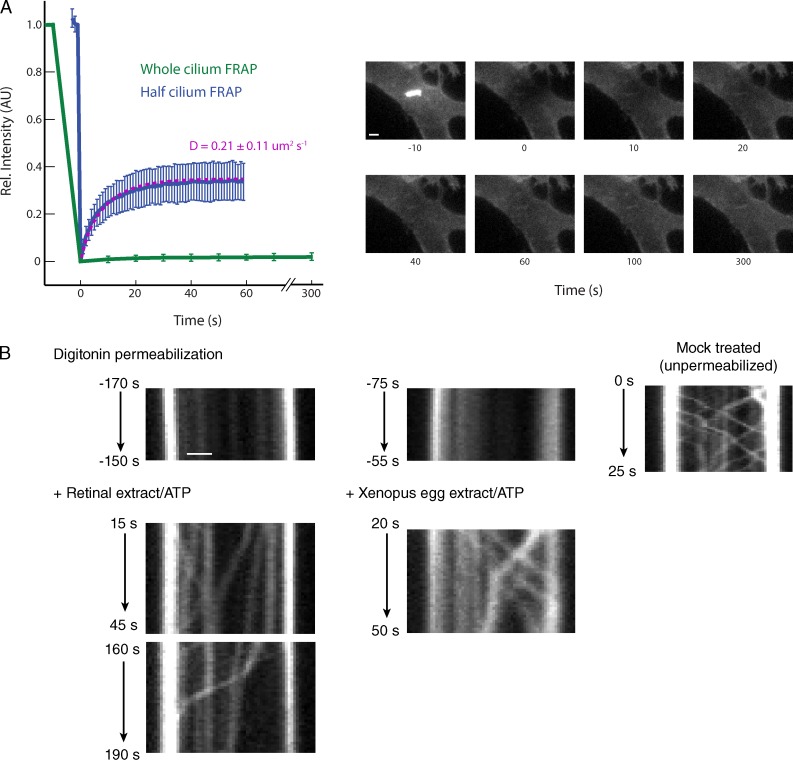
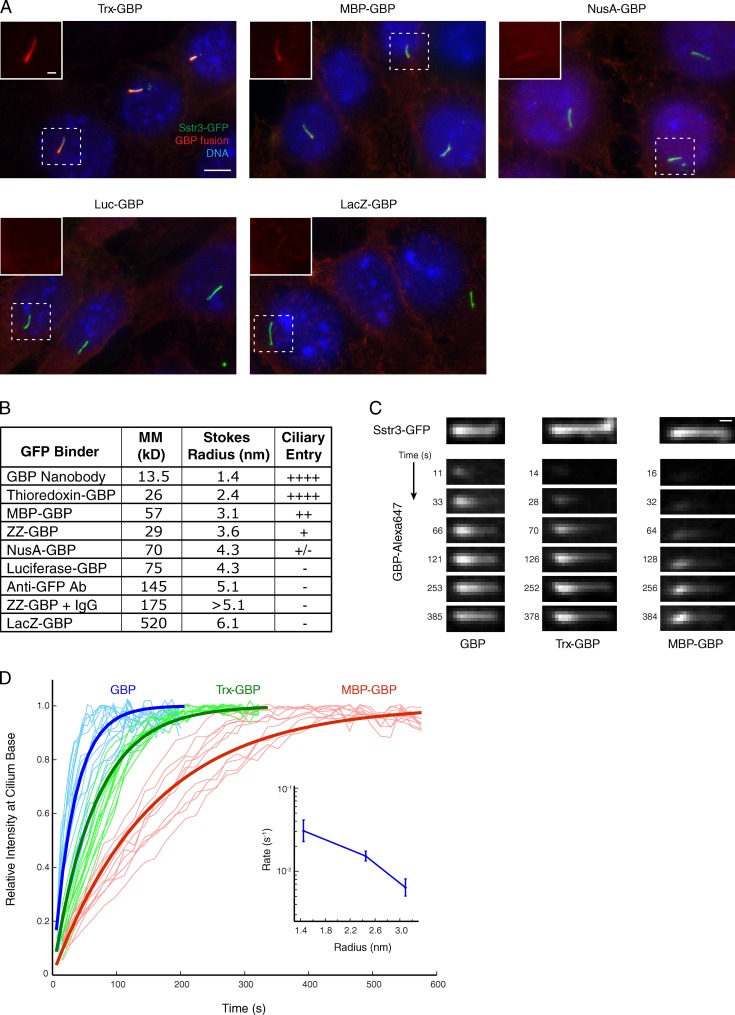
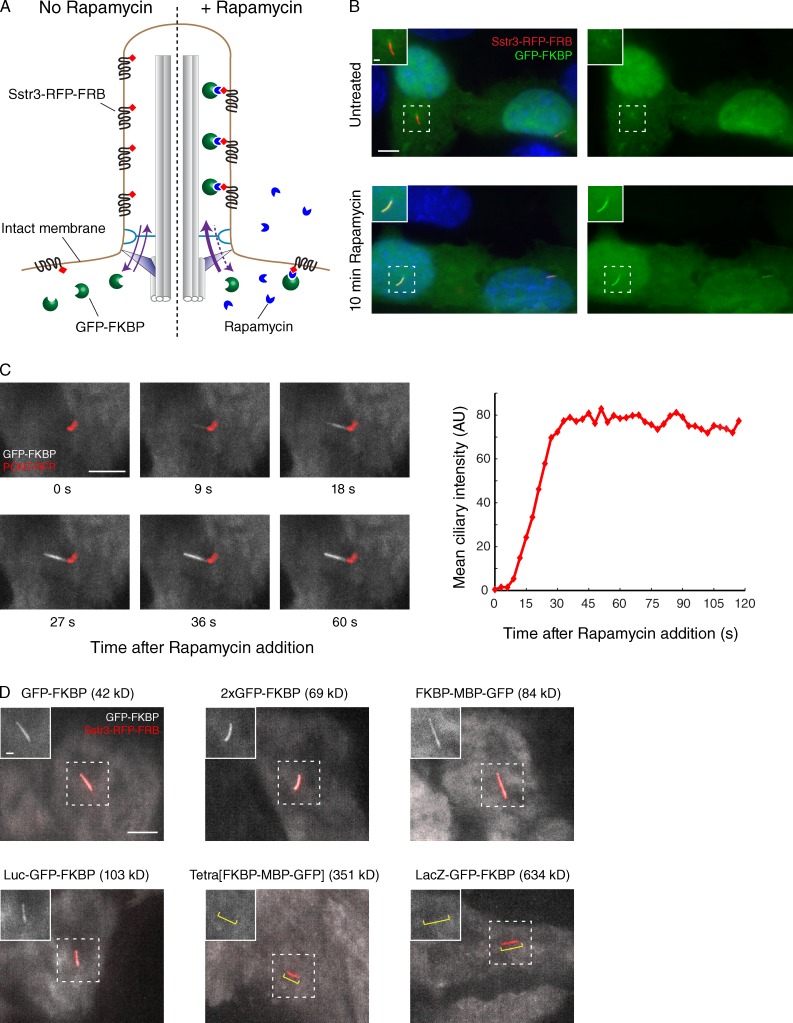
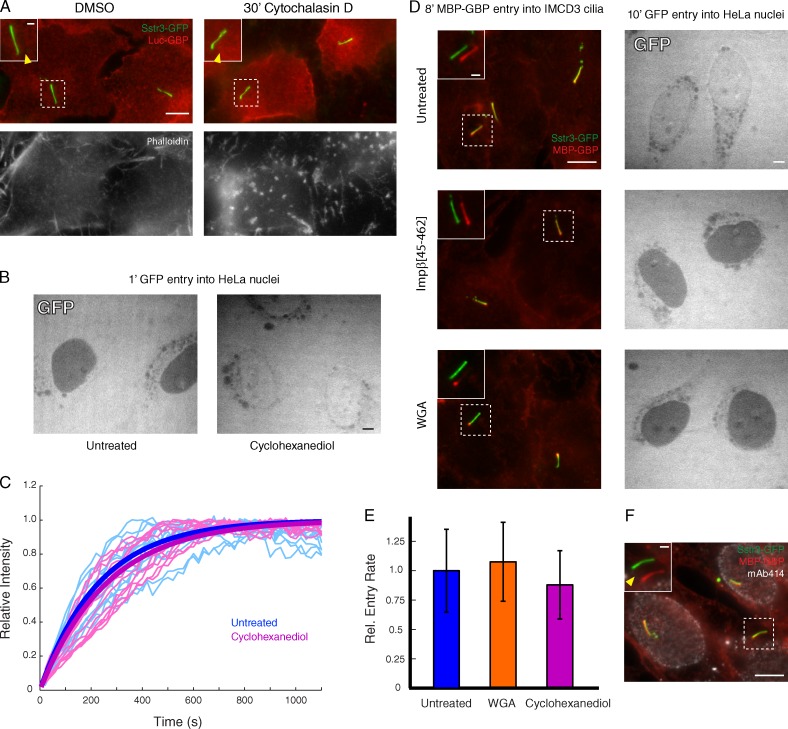
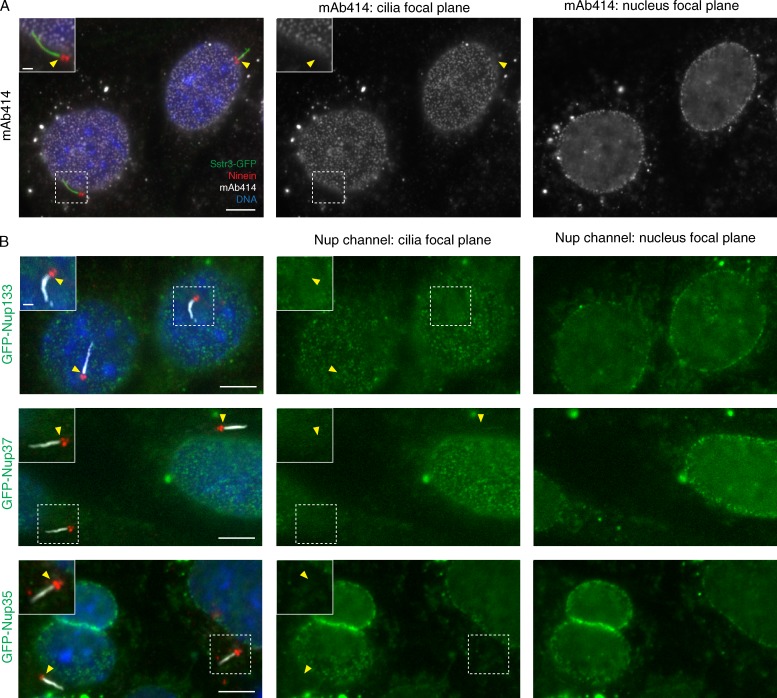
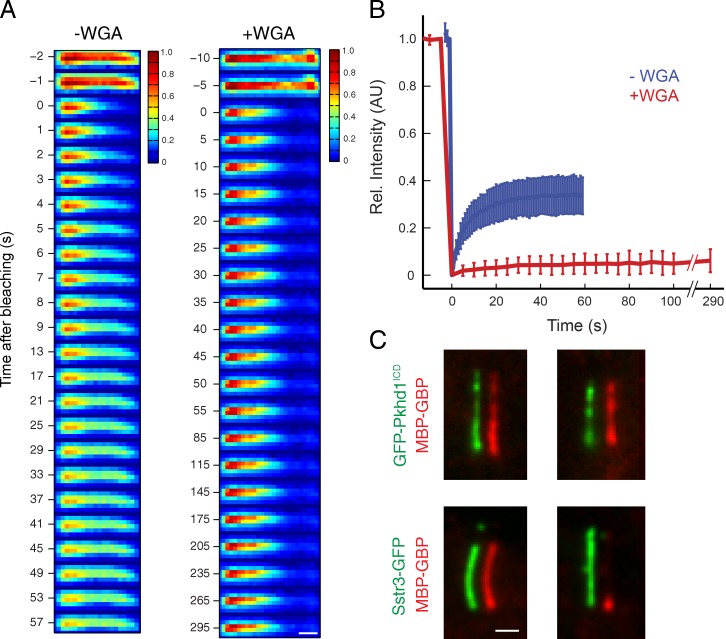
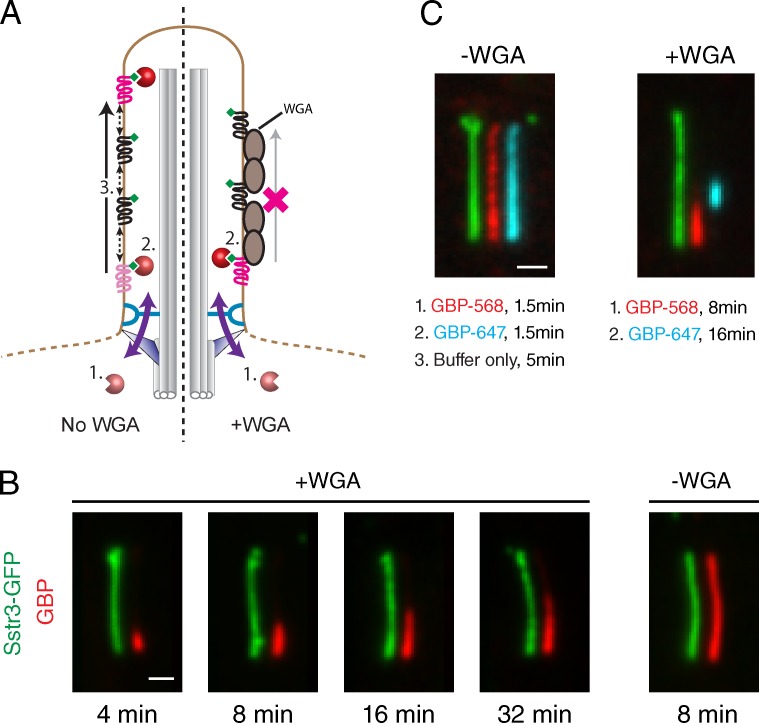
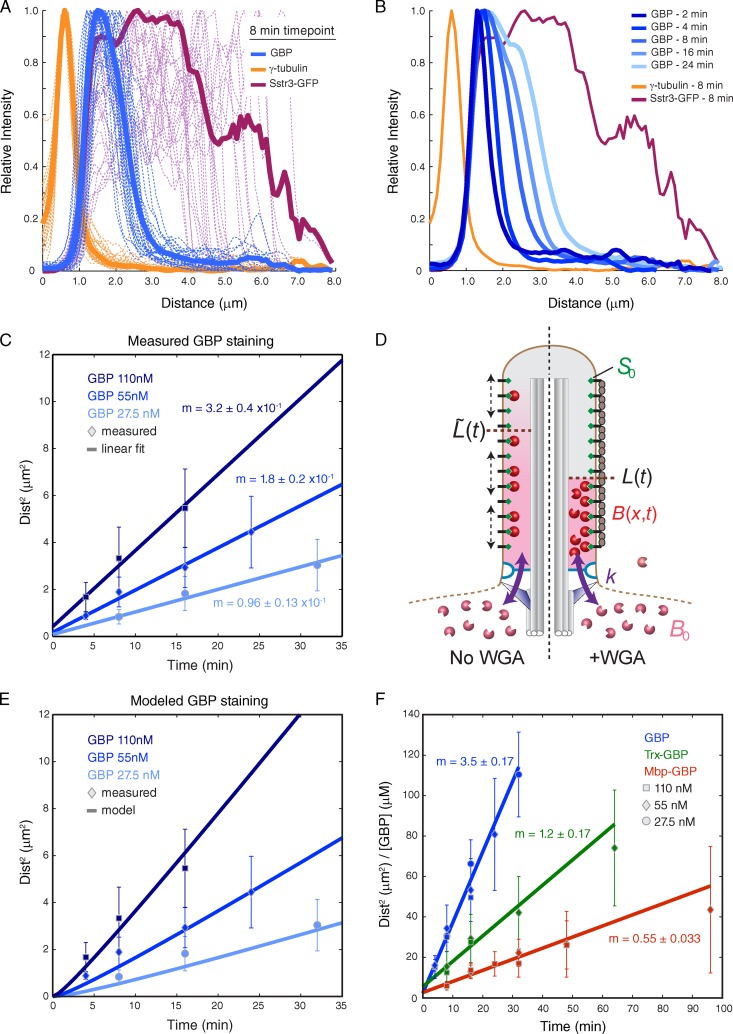
Specific proteins are concentrated within primary cilia, whereas others remain excluded. To understand the mechanistic basis of entry into cilia, we developed an in vitro assay using cells in which the plasma membrane was permeabilized, but the ciliary membrane was left intact. Using a diffusion-to-capture system and quantitative analysis, we find that proteins >9 nm in diameter (∼100 kD) are restricted from entering cilia, and we confirm these findings in vivo. Interference with the nuclear pore complex (NPC) or the actin cytoskeleton in permeabilized cells demonstrated that the ciliary diffusion barrier is mechanistically distinct from those of the NPC or the axon initial segment. Moreover, applying a mass transport model to this system revealed diffusion coefficients for soluble and membrane proteins within cilia that are compatible with rapid exploration of the ciliary space in the absence of active transport. Our results indicate that large proteins require active transport for entry into cilia but not necessarily for movement inside cilia.


Figures

Figure 1.
Figure 1.
Ciliary proteins are not accessible to antibodies in digitonin-permeabilized cells. (A) IMCD3 cells were fixed, permeabilized with 30 µg/ml digitonin, and incubated for 10 min with antibodies to ciliary proteins and to nucleoporins (Nups). After removal of unbound antibodies, cells were permeabilized with Triton X-100 and stained with additional antibodies. Left insets show primary cilia with channels shifted to aid visualization. Arrowheads point to the cilium base in the acetylated tubulin channel (left) or the Arl13b channel (right). Right insets show staining of Nups and DNA. Ac-tub, acylated tubulin. (B) Overview of assay for soluble protein entry into primary cilia. IMCD3 cells are first treated with digitonin or PFO, which permeabilizes the plasma membrane while leaving the ciliary membrane intact. An exogenously added small GBP can cross from the cytoplasmic compartment into the cilium (left), where it is captured by GFP fused to the intracellular tail of the ciliary GPCR Sstr3. (right) A large GBP (e.g., an antibody) cannot enter the cilium and only accesses the pool of Sstr3-GFP present in the plasma membrane. (C) IMCD3 cells expressing Sstr3-GFP were stained with an anti-GFP antibody following a conventional immunofluorescence protocol using Triton X-100 for permeabilization (left) or in live cells permeabilized with digitonin (middle) or PFO (right). Insets show primary cilia with GFP and anti-GFP channels shifted to aid visualization. Arrowheads point to the base of the cilium in the GBP channel. Ab, antibody; dia., diameter. (D) Cells expressing Sstr3-GFP were stained with GBP labeled with Alexa Fluor 647 as in C. Insets show primary cilia with channels shifted. PFO- and digitonin-treated cells exhibit a gradient of GBP signal from cilium base (marked by γ-tubulin in white) to tip. (E) Line graphs of ciliary signals of GFP binders reveal that the base-to-tip gradient of GBP distribution is specific to semipermeabilized cells and that the anti-GFP antibody is absent from semipermeabilized cells. Lines were drawn through cilia from images in C and D, and intensity relative to background was measured with ImageJ. The data shown are from a representative cell, with >10 cells analyzed in each of four experiments. Bars: (main images) 5 µm; (insets) 1 µm.
Figure 2.
Figure 2.
Cilia from digitonin-permeabilized cells are functionally intact. (A) The integrity of the membrane diffusion barrier at the base of cilia was assessed by whole-cilium FRAP. Photobleaching of the distal half of the cilium was performed to test Sstr3 mobility with the ciliary membrane. Averaged fluorescence recovery traces for the bleached region are plotted on the left (n ≥ 14; error bars indicate standard deviation). The Sstr3-GFP diffusion coefficient was determined by fitting observed half-cilium recovery traces to an expected curve (see Materials and methods) and was used to calculate the recovery curve shown in purple. Images on the right show representative data for whole-cilium FRAP. Rel., relative; AU, arbitrary unit. Bar, 2 µm. (B) Reconstitution of IFT in digitonin-permeabilized cells. Kymographs of GFP-IFT88 movement reveal that IFT trains do not move in digitonin-permeabilized cells. Addition of an ATP regenerating system and extracts from bovine retina (left) or Xenopus eggs (middle) reactivates IFT movement in anterograde and retrograde directions. IFT movement in a mock-permeabilized (intact) cell is shown on the right. Bar, 1 µm.
Figure 3.
Figure 3.
A series of GBP fusions reveals the size limit of the ciliary diffusion barrier. (A) Digitonin-permeabilized cells were incubated at room temperature for 10 min with the indicated dye-labeled GBP fusion proteins. Insets show cilia in GBP channel only. Trx, thioredoxin; MBP, maltose-binding protein; NusA, N-using substance A; Luc, firefly luciferase; LacZ, β-galactosidase. Bars: (main images) 5 µm; (insets) 1 µm. (B) Properties of GBPs including molecular mass (MM), Stokes radius, and degree of ciliary entry in digitonin-permeabilized IMCD3 cells expressing Sstr3-GFP. The relative degree of entry seen in A is denoted by the number of + symbols or by a − symbol in cases where no entry was detected. ZZ, tandem Z domain from S. aureus protein A; IgG, immunoglobulin G. (C) Kinetic analysis of GBP entry into cilia of permeabilized IMCD3 cells. GBP alone, Trx-GBP, and MBP-GBP were added at 110 nM, and capture by ciliary Sstr3-GFP was monitored by confocal microscopy. Bar, 1 µm. (D) The GBP signal at the most proximal region of the cilium is plotted versus time for GBP alone, Trx-GBP, and MBP-GBP. Traces for individual cilia are shown in thin lines (n ≥ 10). Fitted exponential curves corresponding to the mean entry rate are shown in thick lines. Inset graph at right shows fitted rate constants (plotted on a logarithmic scale) versus measured Stokes radius. Error bars indicate standard deviations.
Figure 4.
Figure 4.
Inducible diffusion to capture in live cells confirms the existence of a ciliary diffusion barrier. (A) Schematic of the in vivo diffusion to capture assay based on rapamycin-inducible binding of FRB and FKBP domains. Cells expressing Sstr3-RFP-FRB in cilia were transfected with plasmids encoding FKBP- and GFP-bearing fusion proteins. In the absence of rapamycin (left), GFP-FKBP fusions are found in the cytoplasm; after rapamycin addition (right), irreversible dimerization of FRB with FKBP leads to the capture of any GFP-FKBP that diffuses into cilia. (B) Cells were fixed and imaged before and after rapamycin-induced accumulation of GFP-FKBP inside cilia. Insets show enlarged views of cilia. A weak enrichment of GFP-FKBP around the base of cilia is caused by a nonspecific affinity of GFP for pericentriolar material (Fig. S4 B). (C) Pericentrin (PCNT) was cotransfected with GFP-FKBP to mark the base of cilia, and time-lapse imaging was performed after rapamycin addition. Micrographs at select time points are shown on the left, and the integrated intensity of ciliary GFP for the same cell is plotted on the right. 8/8 cells analyzed showed progressive entry of GFK-FKBP from base to tip. AU, arbitrary unit. (D) Fusions of GFP-FKBP with proteins of increasing size reveal the existence of a permeability barrier in live cells. All images were captured by live microscopy 6 min after rapamycin addition. Insets show enlarged views of cilia, and the yellow brackets in the last two images indicate the position of the cilium. Tetra[FKBP-MBP-GFP] denotes FKBP-MBP-GFP fused to a tetramerizing version of the Gcn4 coiled coil (Harbury et al., 1993). Bars: (main images) 5 µm; (insets) 1 µm.
Figure 5.
Figure 5.
The ciliary diffusion barrier is distinct from the barriers at the axon initial segment and the NPC. (A) Cells were treated with 4 µM Cytochalasin D for 30 min to depolymerize actin before digitonin permeabilization and incubation with Luc-GBP for 10 min. Arrowheads point to the base of the cilium in the GBP channel. (bottom) F-actin (phalloidin staining), with the gain increased in untreated cells relative to Cytochalasin D–treated cells for clarity. (B) Entry of GFP (shown in white) into nuclei of digitonin-permeabilized HeLa cells was assessed in the presence and absence of 5% wt/vol 1,2-trans-cyclohexanediol. (C) The rate of MBP-GBP entry into cilia of digitonin-permeabilized IMCD3 cells was assessed in the presence and absence of 5% wt/vol cyclohexanediol. Traces for individual cilia are shown as thin lines (n ≥ 10). Fitted exponential curves corresponding to the mean entry rates are shown as thick lines. (D) Effect of 4 µM dominant-negative Importin-β (residues 45–462) and 75 µg/ml WGA on entry of GFP into nuclei of digitonin-permeabilized HeLa cells (right) and on entry of MBP-GBP into cilia of digitonin-permeabilized IMCD3 cells (left). (E) Comparison of rates of MBP-GBP capture at the proximal segment of primary cilia for untreated cells and cells treated with WGA or 1,2-trans-cyclohexanediol. Error bars indicate standard deviations (n ≥ 10). Rel., relative. (F) Effect of anti-Nup antibody mAb414 on MBP-GBP entry into cilia of digitonin-permeabilized IMCD3 cells. The arrowhead points to the cilium base in the mAb414 channel, where no staining is seen. Bars: (main images) 5 µm; (insets) 1 µm. All insets show primary cilia with channels shifted to aid visualization.
Figure 6.
Figure 6.
Nups are not detected near the base of the cilium. (A) IMCD3 cells were stained with anti-Nup monoclonal antibody mAb414 and an anti-ninein antibody to mark the base of the cilium. Insets show enlarged view of cilium, and arrowheads point to the base of the cilium, where no mAb414 staining is seen. (B) Nup133, Nup35, and Nup37 fused to GFP were transfected into IMCD3 cells for 48 h before processing for immunofluorescence. (right) All tested Nups localize efficiently to NPCs, as seen by spotted circles in midnuclear focal sections. (left) The centrioles and basal bodies were visualized with ninein and cilia stained with acetylated tubulin. Insets show enlarged views of cilia, and arrowheads point to the base of cilia, where no concentration of GFP signal is observed (middle). Bars: (main images) 5 µm; (insets) 1 µm.
Figure 7.
Figure 7.
WGA binds and immobilizes Sstr3-GFP in cilia. (A) FRAP analysis of Sstr3-GFP mobility in untreated cells and cells treated with 75 µg/ml WGA. The relative (Rel.) Sstr3-GFP intensity is displayed in pseudocolored images before and after bleaching the distal half of the cilium. (B) Averaged fluorescence recovery traces for the bleached half of the cilium are plotted for untreated cells and cells treated with 75 µg/ml WGA. Error bars indicate standard deviations (n ≥ 20). AU, arbitrary unit. (C) The effect of WGA on MBP-GBP progression within cilia was compared for cells expressing GFP fused to Sstr3 (bottom) or the lipidated cytoplasmic tail of Pkhd1 (Pkhd1ICD; top). GFP and MBP-GBP channels are offset for clarity. Bars, 1 µm.
Figure 8.
Figure 8.
Effect of WGA on GBP diffusion to capture inside IMCD3-(Sstr3-GFP) cilia. (A) Schematic illustrating GBP behavior in untreated and WGA-treated cells expressing Sstr3-GFP. (left) In the absence of WGA, GBPs enter cilia at the base and are captured by proximal Sstr3-GFP molecules. Rapid lateral diffusion of Sstr3-GFP and Sstr3-GFP:GBP complexes enables the GBP signal to spread distally and replenishes the pool of unliganded Sstr3-GFP near the ciliary base. (right) In the presence of WGA, lateral movement of Sstr3-GFP and Sstr3-GFP:GBP complexes is blocked, and GBP signal remains concentrated at the base until proximal receptors are saturated. (B) Kinetic analysis of GBP staining of WGA-treated cells (left) or untreated cells (right). After incubation with Alexa Fluor 647–labeled GBP for the indicated times, cells were washed and fixed. Channels are offset for clarity. (C) Colorimetric pulse–chase analysis of GBP capture by ciliary Sstr3-GFP in untreated and WGA-treated cells. After digitonin permeabilization, cells were first incubated with Alexa Fluor 568–GBP and then washed and incubated with Alexa Fluor 647–GBP. Channels are offset for clarity. Bars, 1 µm.
Figure 9.
Figure 9.
Quantitative analysis of diffusion to capture in WGA-treated cells. (A) Line traces are plotted for γ-tubulin signal, Sstr3-GFP signal, and GBP signal along the length of cilia after an 8-min incubation with 55 nM GBP. Traces for individual cilia are plotted as thin dotted lines. Averaged traces are shown as solid lines (n ≥ 20). (B) Line traces are plotted as in A for incubations with 55 nM GBP for the indicated times. Sstr3-GFP and γ-tubulin plots correspond to the 8-min time point (n = 10–38). (C) Relationship between the square of the GBP-stained distance and time for GBP added at the indicated concentrations. Error bars indicate standard deviations (n = 10–38). The linear slope ± SEM (in micrometers squared/minute) was determined for each concentration by weighted least-squares fitting. (D) Overview of mathematical model for GBP entry into cilia and capture by Sstr3-GFP in the absence (left) and presence (right) of WGA. GBP added at concentration B0 enters cilia with rate constant k and is captured by Sstr3-GFP present at concentration S0. The position of the distal boundary of the GBP-stained segment is expressed as L(t) (with WGA) or L(t) (no WGA), and the position- and time-dependent concentration of free GBP within cilia is expressed as B(x,t). (E) Comparison of observed GBP staining results with fitted curves derived from mathematical model using DGBP = 7.3 µm2/s. (F) Relationship between time and (GBP distance stained)2/[GBP] (in micrometers squared/micromolar GBP) for GBP alone, Trx-GBP, and MBP-GBP. Data point symbols indicate the GBP concentration added. Error bars indicate standard deviations (n = 10–38). Lines show linear fits to measured data, with slopes indicated in micrometers squared/micromolar/minute.

References

    1. Adam S.A., Marr R.S., Gerace L. 1990. Nuclear protein import in permeabilized mammalian cells requires soluble cytoplasmic factors. J. Cell Biol. 111:807–816 10.1083/jcb.111.3.807 - DOI - PMC - PubMed
    1. Besschetnova T.Y., Roy B., Shah J.V. 2009. Imaging intraflagellar transport in mammalian primary cilia. Methods Cell Biol. 93:331–346 10.1016/S0091-679X(08)93016-8 - DOI - PMC - PubMed
    1. Calvert P.D., Govardovskii V.I., Krasnoperova N., Anderson R.E., Lem J., Makino C.L. 2001. Membrane protein diffusion sets the speed of rod phototransduction. Nature. 411:90–94 10.1038/35075083 - DOI - PubMed
    1. Calvert P.D., Schiesser W.E., Pugh E.N., Jr 2010. Diffusion of a soluble protein, photoactivatable GFP, through a sensory cilium. J. Gen. Physiol. 135:173–196 10.1085/jgp.200910322 - DOI - PMC - PubMed
    1. Charpilienne A., Nejmeddine M., Berois M., Parez N., Neumann E., Hewat E., Trugnan G., Cohen J. 2001. Individual rotavirus-like particles containing 120 molecules of fluorescent protein are visible in living cells. J. Biol. Chem. 276:29361–29367 10.1074/jbc.M101935200 - DOI - PubMed

Publication types

MeSH terms

LinkOut - more resources