. 2013 Oct 14;203(1):87-100.
doi: 10.1083/jcb.201302060. Epub 2013 Oct 7.

Sequestration of CDH1 by MAD2L2 prevents premature APC/C activation prior to anaphase onset

Affiliations

Sequestration of CDH1 by MAD2L2 prevents premature APC/C activation prior to anaphase onset

Tamar Listovsky et al. J Cell Biol. .

Abstract

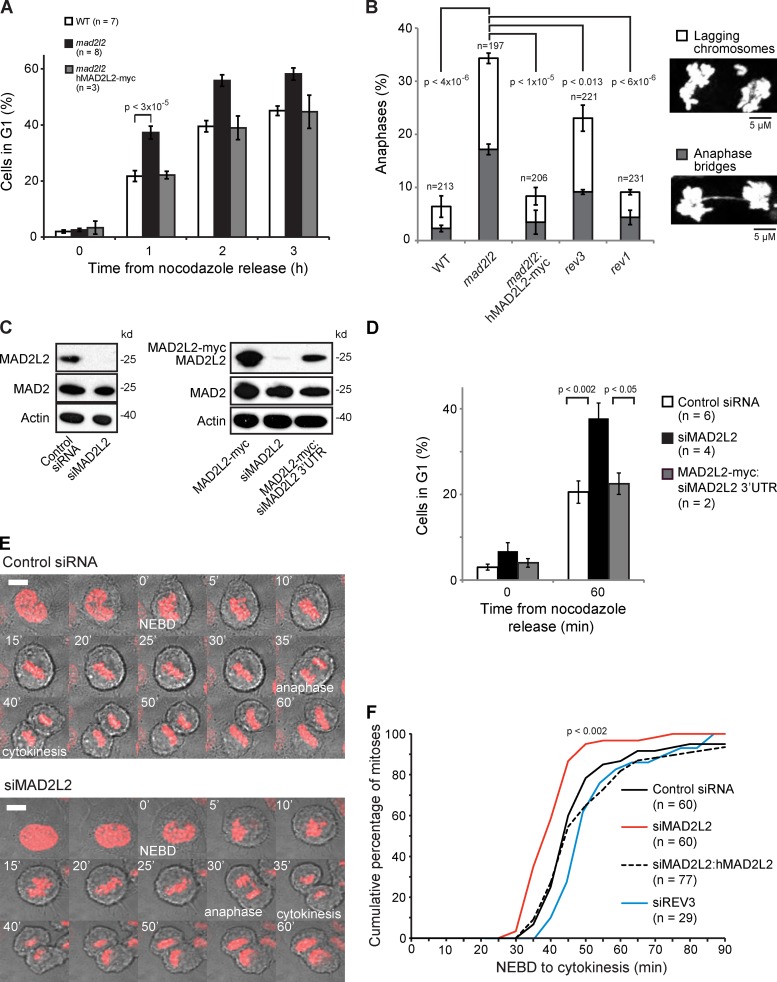
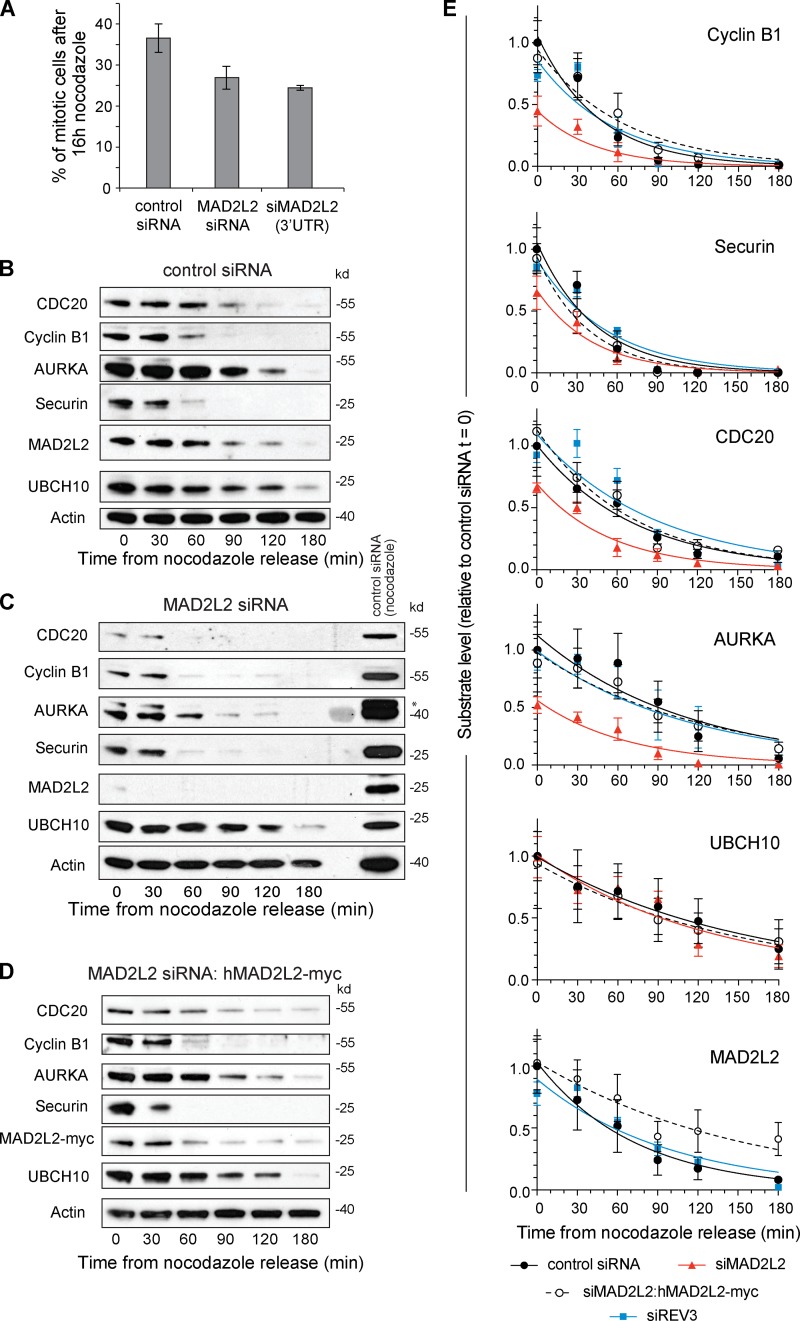
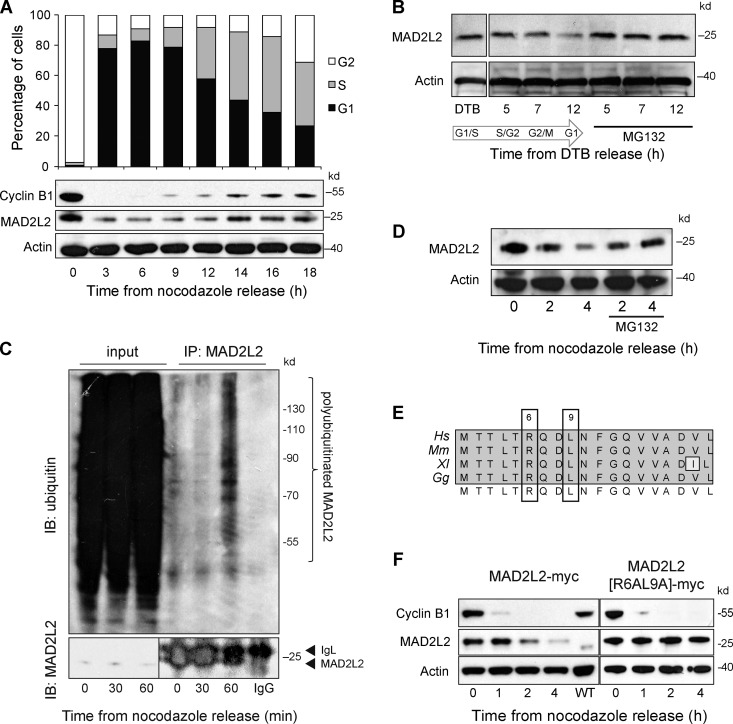
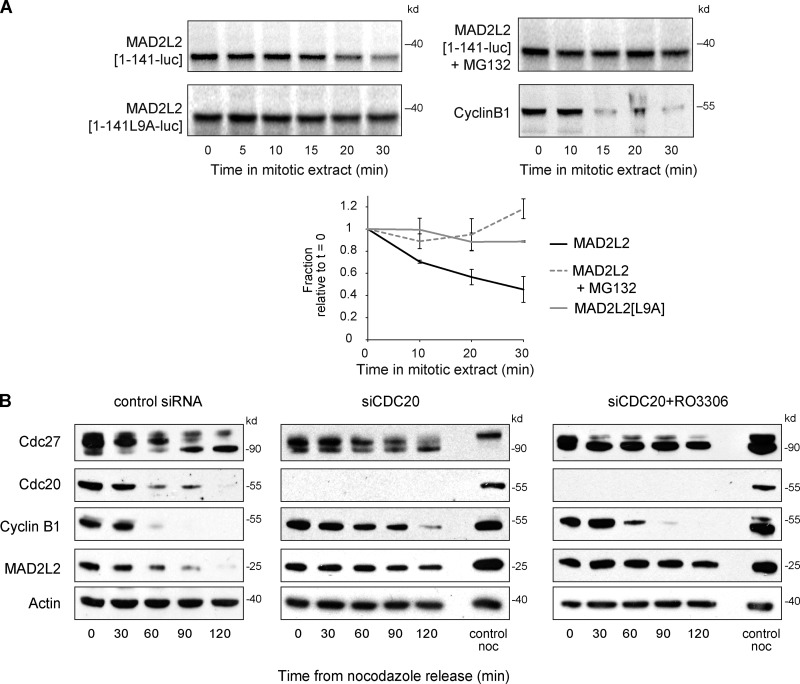
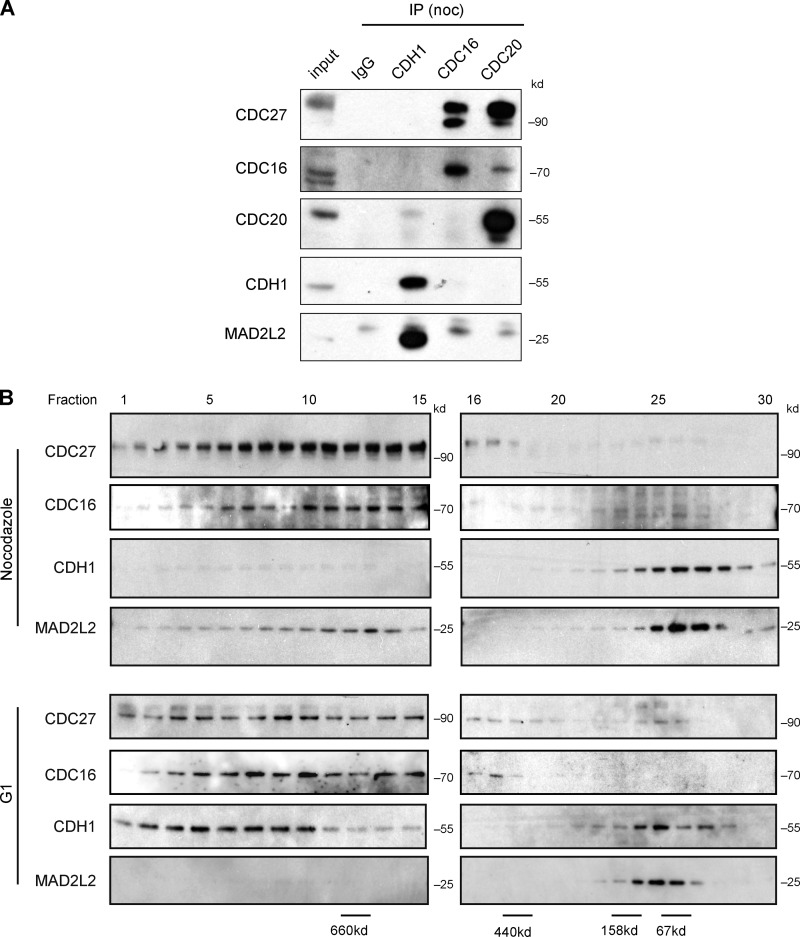
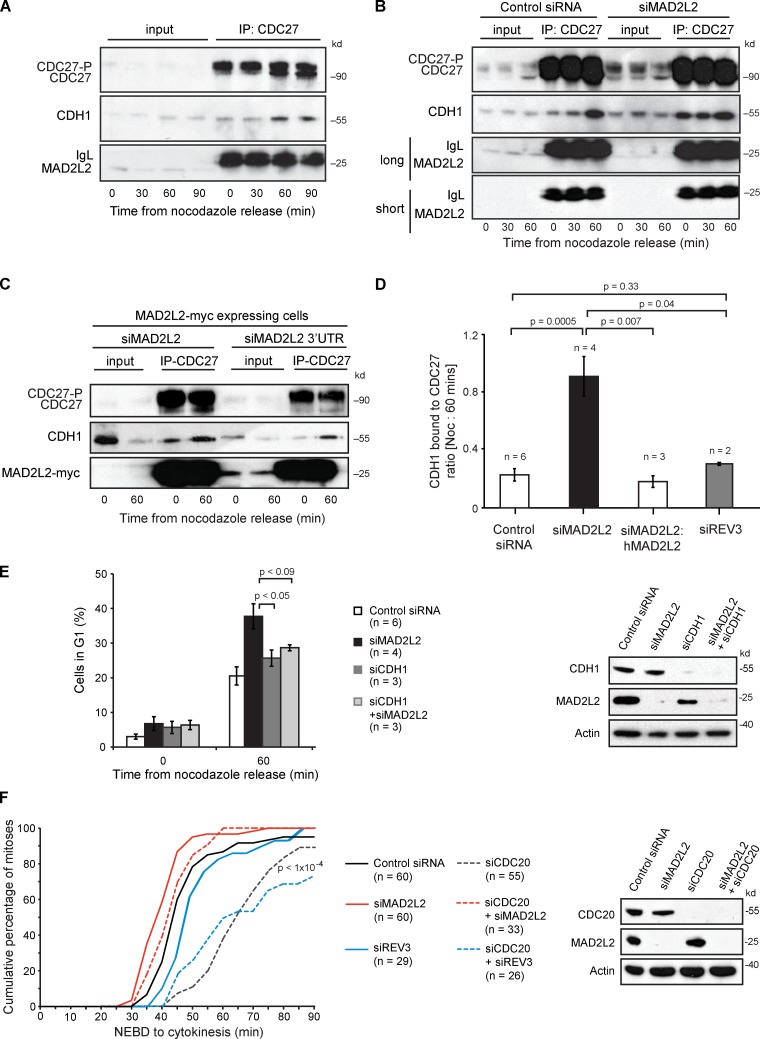
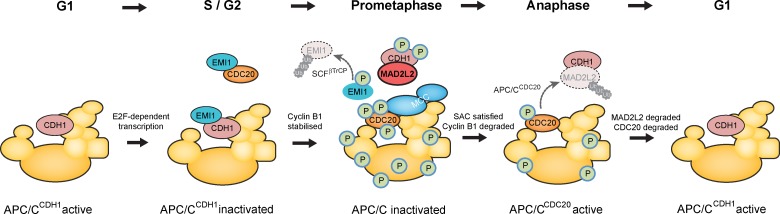
The switch from activation of the anaphase-promoting complex/cyclosome (APC/C) by CDC20 to CDH1 during anaphase is crucial for accurate mitosis. APC/C(CDC20) ubiquitinates a limited set of substrates for subsequent degradation, including Cyclin B1 and Securin, whereas APC/C(CDH1) has a broader specificity. This switch depends on dephosphorylation of CDH1 and the APC/C, and on the degradation of CDC20. Here we show, in human cells, that the APC/C inhibitor MAD2L2 also contributes to ensuring the sequential activation of the APC/C by CDC20 and CDH1. In prometaphase, MAD2L2 sequestered free CDH1 away from the APC/C. At the onset of anaphase, MAD2L2 was rapidly degraded by APC/C(CDC20), releasing CDH1 to activate the dephosphorylated APC/C. Loss of MAD2L2 led to premature association of CDH1 with the APC/C, early destruction of APC/C(CDH1) substrates, and accelerated mitosis with frequent mitotic aberrations. Thus, MAD2L2 helps to ensure a robustly bistable switch between APC/C(CDC20) and APC/C(CDH1) during the metaphase-to-anaphase transition, thereby contributing to mitotic fidelity.


Figures

Figure 1.
Figure 1.
Accelerated mitosis in MAD2L2-deficient cells. (A) MAD2L2 DT40 cells release more rapidly from nocodazole block into G1 than wild-type cells. “n” represents the number of independent experiments. Error bars = SEM; p, unpaired t test. (B) Mitotic aberrations in mad2l2(rev7), rev3, and rev1 DT40 cells. Lagging chromosomes, white segments; anaphase bridges, gray segments. The total number of metaphases scores is indicated. These data were derived from two independent experiments in each of which at least 85 metaphases were counted. Error bars = 1 SD for the independently determined percentages from the two experiments; p, unpaired t test. (C) Confirmation of the effectiveness of the MAD2L2 siRNAs used in this study, showing silencing of only MAD2L2 but not MAD2. The right-hand panel shows the effect of the siRNA against the 3′UTR of human MAD2L2 that does not deplete ectopically expressed human MAD2L2 cDNA carrying a C-terminal myc tag. (D) MAD2L2-depleted U2OS cells release more rapidly than controls from nocodazole block into G1. The percentage of cells in G1 was assessed 60 min after nocodazole release. “n” represents the number of independent experiments. Error bars = SEM; p, unpaired t test. (E) Frames from time-lapse movies of control and siMAD2L2 U2OS cells. NEBD, nuclear envelope breakdown. Note the lagging chromosome at 30 min in the siMAD2L2 frames. Example movies can be found online (Videos 1–4). The white bar in the first frame represents 5 µm. (F) Quantification of the time taken for control (Control siRNA; solid black line), MAD2L2-depleted (siMAD2L2; solid red line), complemented (siMAD2L2 + hMAD2L2; dashed black line), and REV3-depleted (siREV3; solid blue line) U2OS cells expressing mCherry-H2B to complete mitosis, assessed by time-lapse video microscopy (1 frame every 5 min). The plot shows the cumulative percentage of cells that completed mitosis, measured from NEBD to cytokinesis. “n” represents the number of cells examined, collected from at least three independent experiments. The P-value to test whether the distribution of times in siMAD2L2-treated cells is distinct from controls was calculated by the Kolmogorov-Smirnov test.
Figure 2.
Figure 2.
Premature degradation of APC/C substrates in cells depleted of MAD2L2. (A) Silencing of MAD2L2 results in a lower mitotic index in nocodazole. The percentage of mitotic U2OS cells was calculated by flow cytometry monitoring histone H3 phospho-serine 10 in cells treated with nocodazole for 16 h. Error bars = 1 SD. (B) APC/C substrate degradation in control siRNA-treated U2OS cells. (C) APC/C substrate degradation in siMAD2L2-treated cells. The asterisk indicates remnant Cyclin B1 signal in the AURKA blot. (D) APC/C substrate degradation in cells complemented with siRNA-resistant hMAD2L2-myc. (E) Summary of substrate degradation in control and siMAD2L2-treated cells in the 180 min after nocodazole release. Substrate levels at each time point are normalized to actin and then shown as a fraction of the level of the substrate at t = 0 in control siRNA-treated cells. The curve fit is an exponential decay. The t1/2 and fitting statistics are presented in Table 2. Error bars = SEM. Control siRNA: solid black circle/solid black line, n = 5. siMAD2L2: solid red triangles/solid red line, n = 3. siMAD2L2 complemented with hMAD2L2-myc: open circles/dashed black line, n = 4. siREV3: solid blue square/solid blue line, n = 3. “n” represents the number of independent experiments. The additional blots that contribute to this analysis are shown in Fig. S1 (control, siMAD2L2, and complemented) and Fig. S4 (siREV3).
Figure 3.
Figure 3.
MAD2L2 degradation in early anaphase is dependent on a destruction box and the proteasome. (A) Long time-course of MAD2L2 expression in U2OS after release from nocodazole with a representative cell cycle profile (of three repeats). (B) Stabilization of MAD2L2 levels by MG132 after release from double thymidine block. (C) In vivo ubiquitination of MAD2L2 on release from nocodazole. Left-hand three lanes: input blotted with anti-MAD2L2 (bottom) and anti-ubiquitin (top). Right-hand lanes: the anti-MAD2L2 immunoprecipitate blotted with anti-ubiquitin with IgG only control on the far right. (D) Stabilization of MAD2L2 by proteasome inhibition with MG132 after release from nocodazole. (E) The RXXL motif in vertebrate MAD2L2. Alignments of the first 19 amino acids of human (Hs), mouse (Mm), Xenopus (Xl), and chicken (Gg) MAD2L2. (F) MAD2L2 levels are stabilized by mutation of the D-box. Ectopically expressed myc-tagged MAD2L2 is degraded on release into G1 (left) and this is prevented by mutation of R6 and L9 to A (right).
Figure 4.
Figure 4.
MAD2L2 degradation in anaphase is mediated by APC/CCDC20. (A) D-box and proteasome-dependent destruction of MAD2L2 in extracts of mitotic Xenopus oocytes. The first 141 amino acids of MAD2L2, and the first 200 amino acids of Cyclin B1, were fused to luciferase, in vitro translated, and added to mitotic Xenopus oocyte extracts. Degradation is stabilized by mutation of the D-box or by addition of MG132. The graphs shows quantification of three repeats of the experiment with the level of translated MAD2L2 being normalized to time 0. Error bars = 1 SD. (B) The degradation of MAD2L2 in early anaphase is delayed by depletion of CDC20. Depletion of CDC20 alone results in prolonged delay in mitotic exit and hence also a delay in MAD2L2 and Cyclin B1 degradation and CDC27 dephosphorylation. Addition of the CDK1 inhibitor RO3306 permits mitotic exit in the absence of CDC20, but MAD2L2 degradation remains delayed.
Figure 5.
Figure 5.
In vivo MAD2L2 interacts with a pool of CDH1 that is not bound to the APC/C. (A) MAD2L2 binds CDH1 but not the APC/C or CDC20 in nocodazole-arrested cells. (B) Gel filtration of synchronized U2OS cells. In nocodazole, the bulk of CDH1 and MAD2L2 co-elute in a low molecular weight fraction, while in G1 CDH1 is present in a higher molecular weight fractions containing the APC/C subunits CDC27 and CDC16.
Figure 6.
Figure 6.
Depletion of MAD2L2 leads to premature binding of CDH1 to the APC/C in prometaphase. (A) CDH1 interacts with the APC/C within 60 min after nocodazole release. Immunoprecipitation with anti-CDC27 from U2OS cells arrested in nocodazole and at 30, 60, and 90 min after release blotted for CDH1 to monitor the association of CDH1 with the APC/C. (B) Silencing of MAD2L2 leads to premature association of CDH1 with CDC27. (C) Complementation of the premature association of CDH1 with CDC27. The cells in this experiment all stably express hMAD2L2-myc. siMAD2L2 silences both the endogenous MAD2L2 and the transgenic MAD2L2-myc. The siMAD2L2 3′UTR only silences the endogenous MAD2L2, leaving the MAD2L2-myc expressed. See also Fig. 1 C. (D) Quantification of the premature association of CDH1 with CDC27 in MAD2L2-depleted cells. The amount of CDH1 immunoprecipitated with CDC27 was normalized to the IgG signal for each immunoprecipitation and the ratio of the amount of CDH1 pulled down in nocodazole (time = 0) and at 60 min after release was calculated. The constitutive association of CDH1 with CDC27 in prometaphase in MAD2L2-silenced cells results in an increase in this ratio, which approaches 1. “n” represents the number of independent experiments. Error bars = SEM; P-value calculated with unpaired, two-tailed t test assuming equal variance. The additional blots contributing to this analysis are shown in Fig. S1 D. (E) Depletion of CDH1 prevents the rapid mitotic exit seen in cells lacking MAD2L2. The percentage of cells in G1 was assessed 60 min after nocodazole release. “n” represents the number of independent experiments. Error bars = SEM; p, unpaired t test. The control siRNA and siMAD2L2 data are reproduced from Fig. 1 D for comparison. The effectiveness of the siRNA protocol is illustrated in the panel on the right. (F) Silencing of MAD2L2, but not REV3, can rescue the mitotic delay in CDC20-depleted cells. Quantification of the time taken for control (Control siRNA; solid black line), MAD2L2-depleted (siMAD2L2; solid red line), REV3-depleted (siREV3; solid blue line), CDC20-depleted (siCDC20, dashed dark gray line), CDC20- and MAD2L2-depleted (siCDC20 + siMAD2L2, dashed red line), and CDC20- and REV3-depleted (siCDC20 + siREV3, dashed blue line) U2OS cells expressing mCherry-H2B to complete mitosis, assessed by time-lapse video microscopy (1 frame every 5 min). The plot shows the cumulative percentage of cells that completed mitosis, measured from NEBD to cytokinesis. “n” represents the number of cells examined, collected from at least three independent experiments. P-value for siCDC20 and siCDC20 + siREV3 vs. Control siRNA, siMAD2L2, and siMAD2L2 + siCDC20 < 1 × 10⁻⁴.
Figure 7.
Figure 7.
The role played by MAD2L2 in the control of APC/C activation. As cells enter S phase, APC/CCDH1, which has been active in G1, is inhibited by Emi1 and by degradation of CDH1. Emi1 can also inhibit newly produced CDC20 by sequestering it from the APC/C. Loss of APC/C activity results in Cyclin B1 stabilization and consequent phosphorylation of the APC/C, the activators CDC20 and CDH1 and of Emi1. Phosphorylated Emi1 is degraded via ubiquitination by the SCFβTrCP. APC/C phosphorylation promotes binding of CDC20, but the complex is kept inactive by MAD2 and the mitotic checkpoint complex. Meanwhile, APC/C and CDH1 phosphorylation antagonizes activation of the APC/C by CDH1. CDH1 is additionally bound by MAD2L2, contributing to its sequestration away from the APC/C. Once the spindle assembly checkpoint (SAC) is satisfied and anaphase is initiated, APC/CCDC20 degrades MAD2L2 and releases CDH1. CDH1 and the APC/C are also dephosphorylated, allowing CDH1 to bind and activate the APC/C. The sequestration of CDH1 by MAD2L2 acts to prevent premature activation of the APC/C by preventing binding of CDH1 to hypophosphorylated forms of the complex, thus ensuring the timing and bistability of the APC/CCDC20 to APC/CCDH1 switch. Model adapted from Pines, 2011.

References

    1. Baba T.W., Giroir B.P., Humphries E.H. 1985. Cell lines derived from avian lymphomas exhibit two distinct phenotypes. Virology. 144:139–151 10.1016/0042-6822(85)90312-5 - DOI - PubMed
    1. Bhat A., Andersen P.L., Qin Z., Xiao W. 2013. Rev3, the catalytic subunit of Polζ, is required for maintaining fragile site stability in human cells. Nucleic Acids Res. 41:2328–2339 10.1093/nar/gks1442 - DOI - PMC - PubMed
    1. Chao W.C., Kulkarni K., Zhang Z., Kong E.H., Barford D. 2012. Structure of the mitotic checkpoint complex. Nature. 484:208–213 10.1038/nature10896 - DOI - PubMed
    1. Chen J., Fang G. 2001. MAD2B is an inhibitor of the anaphase-promoting complex. Genes Dev. 15:1765–1770 10.1101/gad.898701 - DOI - PMC - PubMed
    1. Ciosk R., Zachariae W., Michaelis C., Shevchenko A., Mann M., Nasmyth K. 1998. An ESP1/PDS1 complex regulates loss of sister chromatid cohesion at the metaphase to anaphase transition in yeast. Cell. 93:1067–1076 10.1016/S0092-8674(00)81211-8 - DOI - PubMed

Publication types

LinkOut - more resources