. 2013 Oct 14;203(1):57-71.
doi: 10.1083/jcb.201305159. Epub 2013 Oct 7.

Pin1 promotes histone H1 dephosphorylation and stabilizes its binding to chromatin

Affiliations

Pin1 promotes histone H1 dephosphorylation and stabilizes its binding to chromatin

Nikhil Raghuram et al. J Cell Biol. .

Abstract

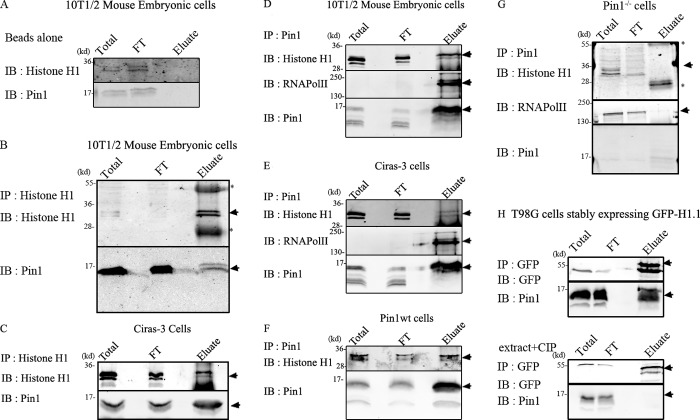
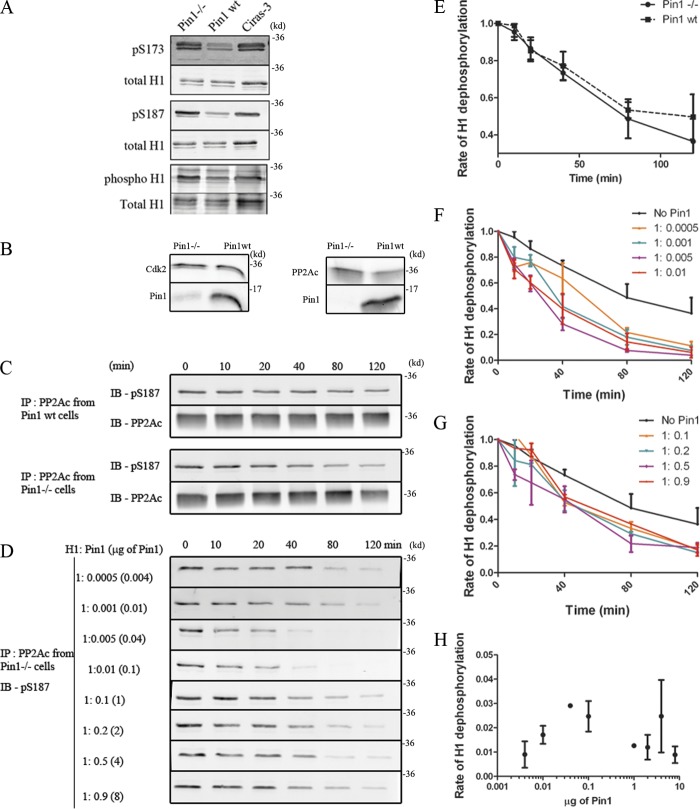
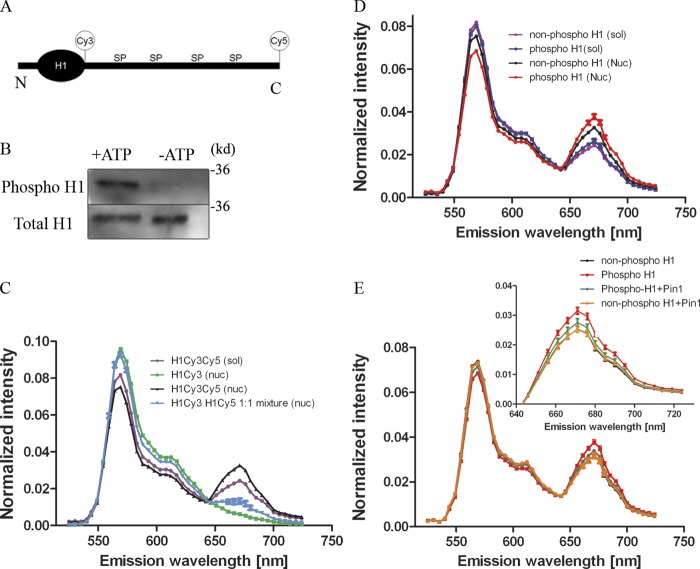
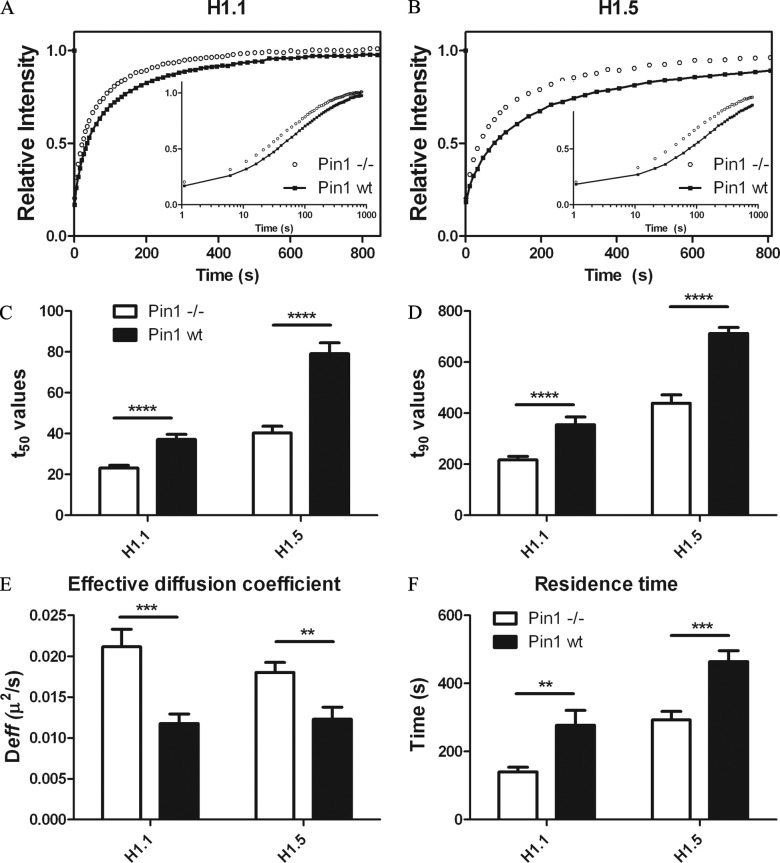
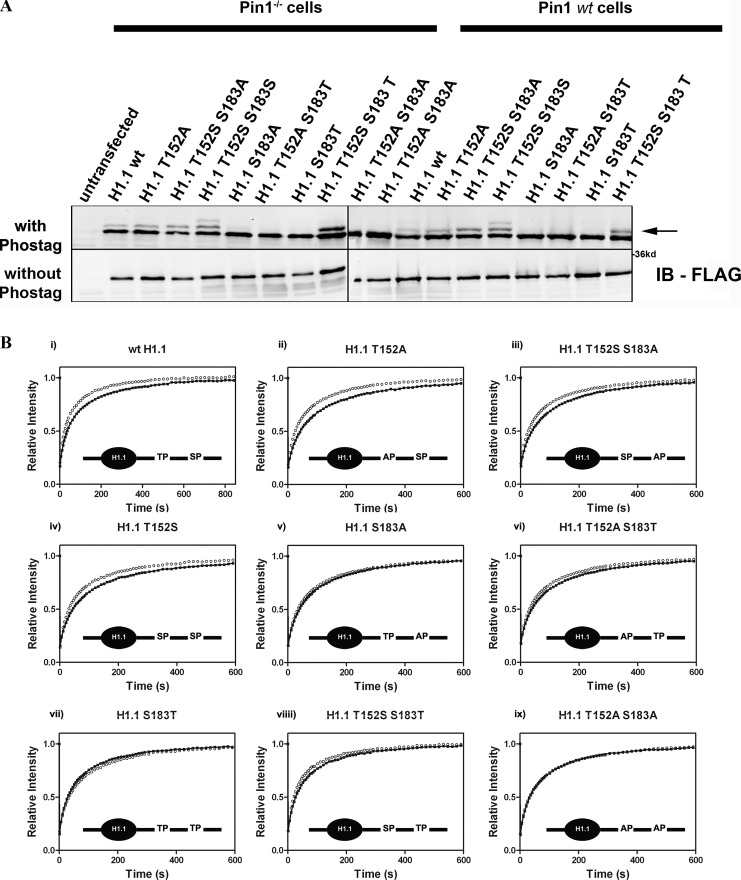
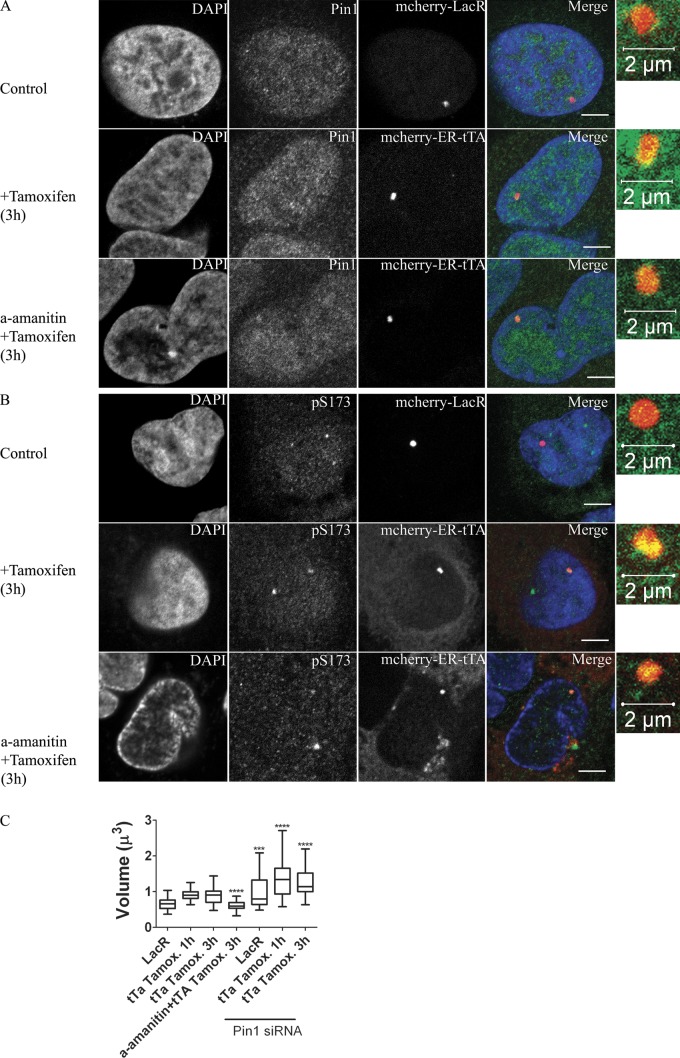
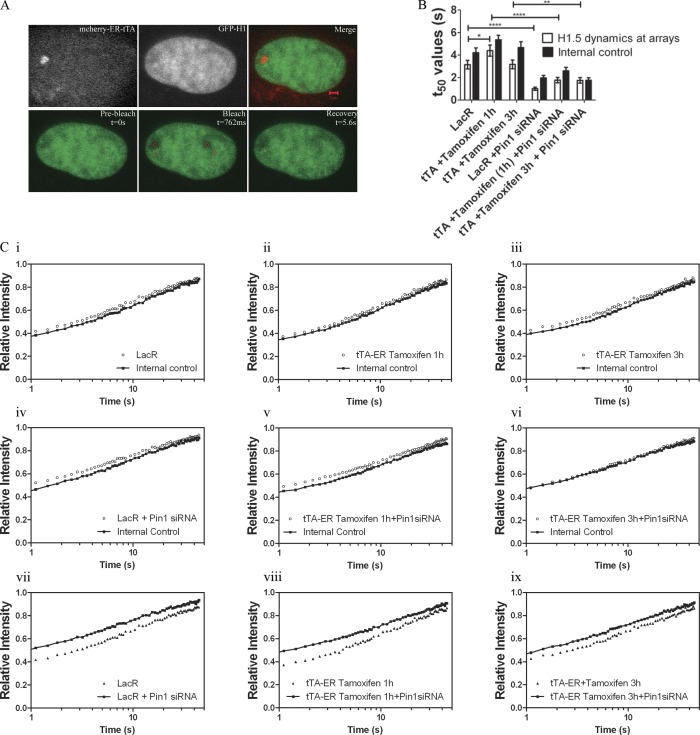
Histone H1 plays a crucial role in stabilizing higher order chromatin structure. Transcriptional activation, DNA replication, and chromosome condensation all require changes in chromatin structure and are correlated with the phosphorylation of histone H1. In this study, we describe a novel interaction between Pin1, a phosphorylation-specific prolyl isomerase, and phosphorylated histone H1. A sub-stoichiometric amount of Pin1 stimulated the dephosphorylation of H1 in vitro and modulated the structure of the C-terminal domain of H1 in a phosphorylation-dependent manner. Depletion of Pin1 destabilized H1 binding to chromatin only when Pin1 binding sites on H1 were present. Pin1 recruitment and localized histone H1 phosphorylation were associated with transcriptional activation independent of RNA polymerase II. We thus identify a novel form of histone H1 regulation through phosphorylation-dependent proline isomerization, which has consequences on overall H1 phosphorylation levels and the stability of H1 binding to chromatin.


Figures

Figure 1.
Figure 1.
Pin1 interacts with histone H1. Coimmunoprecipitation experiments were performed to test whether Pin1 and H1 interacted with each other in vivo. “Total” refers to the total nuclear extract before the addition of the antibody, and “FT” refers to flow-through (∼3–6% of the total volume). The entire contents of the eluate were run on the gel. Black lines indicate that intervening lanes were spliced out, and arrows indicate bands that correspond to the protein being IB. Asterisks indicate heavy/light chain IgG antibodies that form part of the eluate. (A) Under the conditions used, both histone H1 and Pin1 did not bind beads nonspecifically. Histone H1 antibodies were used to immunoprecipitate (IP) H1 from mouse embryonic cells (B) and from Ciras-3 cells (C). Immunoblots (IB) reveal pull-down of Pin1 along with histone H1 demonstrating their association in vitro. Reciprocal experiments were performed using Pin1 antibody to pull down Pin1 from extracts prepared from 10T1/2 mouse embryonic cells (D), Ciras-3 cells (E), and Pin1wt cells (F) and Pin1−/− cells (G). RNA polymerase II, which is an established substrate for Pin1, was used as a positive control. Both H1 and RNA polymerase II form a part of the eluate in 10T1/2 and Ciras-3 cells, but not in Pin1−/− cells, demonstrating specific interactions mediated by Pin1. (H, top) Interaction between Pin1 and GFP-H1.1 in extracts prepared from T98G cells stably expressing GFP-H1.1. GFP-H1.1 was immunoprecipitated using GFP antibody coupled to magnetic particles (GFP-Trap). This interaction is dependent on the phosphorylation status of proteins (H, bottom) as treatment of the extracts with calf intestinal phosphatase (CIP), a general nonspecific protein phosphatase, abrogated the interaction between H1 and Pin1.
Figure 2.
Figure 2.
Pin1 promotes H1 dephosphorylation. (A) Histones were extracted from Pin1−/−, Pin1wt, and Ciras-3 cells, and were then probed with either pS173(H1.2/H1.5), pS187(H1.4), a phospho-specific stain that labels all phosphorylated proteins, or with a stain that labels total protein. Levels of pS173, pS187, and net H1 phosphorylation levels were found to be higher in Pin1−/− cells as compared with Pin1wt cells, similar to those observed in Ciras-3 cells (positive control). (B) Nuclear extracts from Pin1−/− cells and Pin1wt cells revealed that the levels of Cdk2 and PP2Ac were similar in both cells. (C) The dephosphorylation activity of PP2Ac activity was analyzed using purified H1 as a substrate. PP2Ac was immunoprecipitated from either Pin1wt cells or Pin1−/− cells and assessed for its ability to dephosphorylate pS187. The kinetics of this dephosphorylation reaction are plotted in E with each dot/square representing the average H1 phosphorylation level obtained from at least three independent experiments. The average intensity from the zero-minute time point is set as the maximum, against which all other time points are compared. (D) PP2Ac was immunoprecipitated from Pin1−/− cells and was mixed with a constant amount of H1, while levels of purified Pin1 were varied from 0.004 to 8 µg. The former corresponds to a molar stoichiometry of H1/Pin1 = 1:0.0005, whereas the latter corresponds to H1/Pin1 = 1:0.9. The kinetics of dephosphorylation is plotted in F and G, with the average intensity at the zero-minute time point set to 1. These curves were then submitted to a one-phase decay curve analysis and the rate obtained was plotted as a function of the amount of Pin1 added to the reaction (H).
Figure 3.
Figure 3.
Pin1 and H1 phosphorylation change the structure of the CTD. (A) The position of the Cy3 and Cy5 label are indicated in relation to the whole H1 molecule, not to scale (N, N-terminal; C, C-terminal; SP, Ser-Pro). (B) H1 labeled with Cy3 and Cy5 were treated with Cdk2 immunoprecipitated from Pin1−/− cells in the presence or absence of ATP and probed with a phospho-specific stain. These blots reveal successful phosphorylation of H1 in the presence of ATP (now referred to as phosphoH1), whereas Cdk2 was unable to phosphorylate labeled H1 molecules in the absence of ATP (now referred to as nonphospho H1). (C) Labeled phospho H1 molecules were then diluted either in solution (sol) or with reconstituted nucleosomes (nuc). A 514-nm laser was then used to excite the molecules and fluorescence emission spectra was obtained from 525–724nm (5-nm slit width). Fluorescence intensity was normalized to the total fluorescence intensity obtained from each spectrum. The spectra show a slight increase in FRET signal (peak at 671 nm) in the mono-labeled H1s (either Cy3 or Cy5) mixed with each other in 1:1 stoichiometry together with nucleosomes, indicating inter-molecular FRET, whereas this signal increases dramatically when both Cy3 and Cy5 are on the same H1 molecule. (D) FRET signal was compared between phosphorylated H1 and nonphosphorylated H1 in solution versus these molecules added to reconstituted nucleosomes. Although FRET signal remains the same when H1 is in solution, FRET signal is dependent on the phosphorylation status of H1 in the presence of reconstituted nucleosomes. (E) FRET signal was compared between phosphorylated H1 and nonphosphorylated H1 with reconstituted nucleosomes in the presence or absence of Pin1. Although phosphorylation alone increases the FRET signal, addition of Pin1 reduces this signal toward that of the nonphosphorylated H1 molecules.
Figure 4.
Figure 4.
Pin1 stabilizes GFP-H1.1 and GFP-H1.5 dynamics. GFP H1.1 (A) or GFP-H1.5 (B) was expressed either in Pin1−/− cells or Pin1wt cells. FRAP experiments were performed to measure the dynamics of H1; each curve represents an average of ∼20 cells (total) in three independent experiments. The inset represents the same FRAP curve with the x-axis in log (time) to highlight changes in the earlier phases of the FRAP curve. Both H1.1 and H1.5 recover much faster in Pin1−/− cells as compared with Pin1wt cells. This trend was affirmed with a statistically significant increase in both t50 (C) and t90 (D) values in the presence of Pin1. Mathematical modeling of FRAP curves show that Pin1 causes a decrease in effective diffusion coefficient (E), a measure of the freely diffusing and low-affinity population, while at the same time causes increases residence time (F) of the high-affinity H1 population. Significance between Pin1−/− vs. Pin1wt was analyzed using unpaired t test (95% confidence interval). Notation for significance: *** if P value is < 0.001; ** if P is between 0.001 and 0.01; * if P is between 0.01 and 0.05.
Figure 5.
Figure 5.
Mobility shift assay for detecting phosphorylated H1 and FRAP analysis of H1.1 mutants. (A) FLAG-tagged H1.1 wt and H1.1 mutants were transfected in Pin1−/− and Pin1wt cells. Histones were then extracted using 0.4 N H2SO4 and the extracts were then run in a 10% acrylamide gel ± Phos-tag. Phos-tag is a ligand that interacts with phosphate molecules imparting shifts in mobility. H1.1wt migrates as two distinct species in the presence of Phos-tag, whereas H1.1T152S migrates as three distinct species (shown by arrows). In the absence of Phos-tag, all mutants migrate as a single band. (B) GFP H1.1 (i) or GFP H1.1 mutants (ii–ix) were expressed either in Pin1wt (black filled circles) or Pin1−/− (open circles) cells. FRAP experiments were performed to measure the dynamics of the H1 molecules. Each curve represents an average of ∼20 cells (total), three independent experiments. The inset is a diagrammatic representation of the genetic alteration and relative position of serines (S), theonines (T), prolines (P), and alanines (A). (ii–iv) Role played by serine at either position 183 or 152 in contributing toward Pin1 mediated changes in H1 dynamics. (v–vii) Role played by altering the Thr residue on H1.1 in Pin1-mediated changes in H1 dynamics. (viii) Recovery of H1.1 when the ser and thr positions are switched. (ix) Lack of any change in H1 dynamics when both the ser and thr residues are changed to ala.
Figure 6.
Figure 6.
Pin1 and H1 phosphorylation are marks of transcriptionally competent chromatin. U2Os 263 cells harboring lac arrays followed by TRE, CMV promoter, and CFP-SKL gene were either transfected with mCherry LacR or mCherry ER-tTA. The former represented the transcriptionally inactive state while addition of tamoxifen (3 h) to the latter represented the transcriptionally active state of chromatin. Pin1 (A) and pS173H1.2 (B) levels were measured using immunofluorescence. Both Pin1 and pS173H1.2 levels were found to increase at sites of active transcription. α-Amanitin, was used to deplete RNA polymerase II levels in the cells. When transcription was activated in these competent, yet transcriptionally silent cells, Pin1 and H1 phosphorylation levels were elevated, suggesting that these were early events in the initiation of transcription. Bar, 5 µm (unless otherwise specified). (C) The volume occupied by the arrays was measured in both the transcriptionally inactive state (mCherry LacR alone) and in the transcriptionally active state (addition of tamoxifen to cells expressing mCherry ER-tTA for either 1 h or 3 h). Volume was measured through rapid acquisition of z-stacks in living cells. Whereas transcription caused an increase in the volume occupied by the arrays, treatment of cells with α-amanitin led to compact arrays. Both transcriptionally active and inactive arrays were found to occupy larger volumes when Pin1 was depleted by Pin1siRNA treatment. Significance between control vs. treated (amanitin or Pin1si-RNA) was analyzed using unpaired t test (95% confidence interval). Notation for significance: *** if P value is < 0.001; ** if P is between 0.001 and 0.01; * if P is between 0.01 and 0.05.
Figure 7.
Figure 7.
Pin1 stabilizes H1 binding at sites of transcription. (A) GFP-H1.5 was cotransfected with either mCherry LacR or mCherry-ER-tTA in U2OS 263 cells harboring the arrays. H1 dynamics were monitored using FRAP with two separate regions in the nucleus being photo-bleached. One bleached region corresponded to either the mCherry LacR (transcriptionally inactive site) or mCherry-ER-tTA (transcriptionally active site), and photo-bleached region 2 corresponded to a random site within the nucleus in the same horizontal plane. (B) T50 values of the FRAP curves (C) show that H1.5 dynamics at the lac arrays is fairly similar to those of internal controls, in the transcriptionally uninduced state (Ci). The same trend is seen even when transcription is stimulated by transfection of mCherry-ER-tTA and tamoxifen is added for either 1 h (Cii) or 3 h (Ciii). Similar experiments were performed in cells treated with Pin1siRNA (Civ–Cvi). Major differences in H1 mobility can be observed when comparing the recovery rate in Pin1-proficient cells vs. those seen in Pin1-deficient cells (Cvii–ix). The increase in H1.5 dynamics upon Pin1 depletion is independent of transcriptional activity. Significance between control vs. Pin1siRNA treated t50 values was analyzed using unpaired t test (95% confidence interval). Notation for significance: *** if P value is < 0.001; ** if P is between 0.001 and 0.01; * if P is between 0.01 and 0.05. Each FRAP curve represents an average of ∼30 unique sites of transcription from three independent experiments.

Similar articles

Cited by

References

    1. Albert A., Lavoie S., Vincent M. 1999. A hyperphosphorylated form of RNA polymerase II is the major interphase antigen of the phosphoprotein antibody MPM-2 and interacts with the peptidyl-prolyl isomerase Pin1. J. Cell Sci. 112:2493–2500 - PubMed
    1. Alexandrow M.G., Hamlin J.L. 2005. Chromatin decondensation in S-phase involves recruitment of Cdk2 by Cdc45 and histone H1 phosphorylation. J. Cell Biol. 168:875–886 10.1083/jcb.200409055 - DOI - PMC - PubMed
    1. Bednar J., Horowitz R.A., Grigoryev S.A., Carruthers L.M., Hansen J.C., Koster A.J., Woodcock C.L. 1998. Nucleosomes, linker DNA, and linker histone form a unique structural motif that directs the higher-order folding and compaction of chromatin. Proc. Natl. Acad. Sci. USA. 95:14173–14178 10.1073/pnas.95.24.14173 - DOI - PMC - PubMed
    1. Bradbury E.M. 1992. Reversible histone modifications and the chromosome cell cycle. Bioessays. 14:9–16 10.1002/bies.950140103 - DOI - PubMed
    1. Carrero G., Crawford E., Hendzel M.J., de Vries G. 2004a. Characterizing fluorescence recovery curves for nuclear proteins undergoing binding events. Bull. Math. Biol. 66:1515–1545 10.1016/j.bulm.2004.02.005 - DOI - PubMed

Publication types

MeSH terms

LinkOut - more resources