Complex structure of type VI peptidoglycan muramidase effector and a cognate immunity protein
- PMID: 24100309
- PMCID: PMC3792639
- DOI: 10.1107/S090744491301576X
Complex structure of type VI peptidoglycan muramidase effector and a cognate immunity protein
Abstract
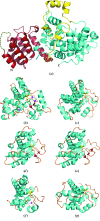
The type VI secretion system (T6SS) is a bacterial protein-export machine that is capable of delivering virulence effectors between Gram-negative bacteria. The T6SS of Pseudomonas aeruginosa transports two lytic enzymes, Tse1 and Tse3, to degrade cell-wall peptidoglycan in the periplasm of rival bacteria that are competing for niches via amidase and muramidase activities, respectively. Two cognate immunity proteins, Tsi1 and Tsi3, are produced by the bacterium to inactivate the two antibacterial effectors, thereby protecting its siblings from self-intoxication. Recently, Tse1-Tsi1 has been structurally characterized. Here, the structure of the Tse3-Tsi3 complex is reported at 1.9 Å resolution. The results reveal that Tse3 contains a C-terminal catalytic domain that adopts a soluble lytic transglycosylase (SLT) fold in which three calcium-binding sites were surprisingly observed close to the catalytic Glu residue. The electrostatic properties of the substrate-binding groove are also distinctive from those of known structures with a similar fold. All of these features imply that a unique catalytic mechanism is utilized by Tse3 in cleaving glycosidic bonds. Tsi3 comprises a single domain showing a β-sandwich architecture that is reminiscent of the immunoglobulin fold. Three loops of Tsi3 insert deeply into the groove of Tse3 and completely occlude its active site, which forms the structural basis of Tse3 inactivation. This work is the first crystallographic report describing the three-dimensional structure of the Tse3-Tsi3 effector-immunity pair.
Keywords: calcium binding; effectors; immunity; interaction; muramidases; peptidoglycan.
Figures


Similar articles
-
Structural insights into the T6SS effector protein Tse3 and the Tse3-Tsi3 complex from Pseudomonas aeruginosa reveal a calcium-dependent membrane-binding mechanism.Mol Microbiol. 2014 Jun;92(5):1092-112. doi: 10.1111/mmi.12616. Epub 2014 May 2. Mol Microbiol. 2014. PMID: 24724564
-
Structural Insights on the bacteriolytic and self-protection mechanism of muramidase effector Tse3 in Pseudomonas aeruginosa.J Biol Chem. 2013 Oct 18;288(42):30607-30613. doi: 10.1074/jbc.C113.506097. Epub 2013 Sep 11. J Biol Chem. 2013. PMID: 24025333 Free PMC article.
-
Expression, purification and preliminary crystallographic analysis of the T6SS effector protein Tse3 from Pseudomonas aeruginosa.Acta Crystallogr Sect F Struct Biol Cryst Commun. 2013 May 1;69(Pt 5):524-7. doi: 10.1107/S1744309113007148. Epub 2013 Apr 30. Acta Crystallogr Sect F Struct Biol Cryst Commun. 2013. PMID: 23695568 Free PMC article.
-
Type VI secretion delivers bacteriolytic effectors to target cells.Nature. 2011 Jul 20;475(7356):343-7. doi: 10.1038/nature10244. Nature. 2011. PMID: 21776080 Free PMC article.
-
Orthologous and Paralogous AmpD Peptidoglycan Amidases from Gram-Negative Bacteria.Microb Drug Resist. 2016 Sep;22(6):470-6. doi: 10.1089/mdr.2016.0083. Epub 2016 Jun 21. Microb Drug Resist. 2016. PMID: 27326855 Free PMC article. Review.
Cited by
-
Genetically distinct pathways guide effector export through the type VI secretion system.Mol Microbiol. 2014 May;92(3):529-42. doi: 10.1111/mmi.12571. Epub 2014 Mar 28. Mol Microbiol. 2014. PMID: 24589350 Free PMC article.
-
Gene Expression of Type VI Secretion System Associated with Environmental Survival in Acidovorax avenae subsp. avenae by Principle Component Analysis.Int J Mol Sci. 2015 Sep 11;16(9):22008-26. doi: 10.3390/ijms160922008. Int J Mol Sci. 2015. PMID: 26378528 Free PMC article.
-
Insights into mechanisms and significance of domain swapping from emerging examples in the Mog1p/PsbP-like fold.Biochem Biophys Res Commun. 2025 Apr 1;755:151570. doi: 10.1016/j.bbrc.2025.151570. Epub 2025 Mar 1. Biochem Biophys Res Commun. 2025. PMID: 40048759 Review.
-
Pseudomonas aeruginosa: pathogenesis, virulence factors, antibiotic resistance, interaction with host, technology advances and emerging therapeutics.Signal Transduct Target Ther. 2022 Jun 25;7(1):199. doi: 10.1038/s41392-022-01056-1. Signal Transduct Target Ther. 2022. PMID: 35752612 Free PMC article. Review.
-
A disordered region in the EvpP protein from the type VI secretion system of Edwardsiella tarda is essential for EvpC binding.PLoS One. 2014 Nov 17;9(11):e110810. doi: 10.1371/journal.pone.0110810. eCollection 2014. PLoS One. 2014. PMID: 25401506 Free PMC article.
References
Publication types
MeSH terms
Substances
Associated data
- Actions
LinkOut - more resources
Full Text Sources
Other Literature Sources

