Suppression of the death gene BIK is a critical factor for resistance to tamoxifen in MCF-7 breast cancer cells
- PMID: 24100375
- PMCID: PMC3833859
- DOI: 10.3892/ijo.2013.2127
Suppression of the death gene BIK is a critical factor for resistance to tamoxifen in MCF-7 breast cancer cells
Abstract
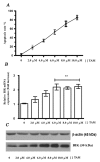
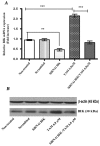
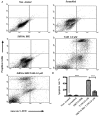
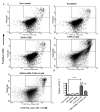
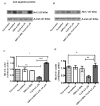
Apoptosis is controlled by the BCL-2 family of proteins, which can be divided into three different subclasses based on the conservation of BCL-2 homology domains. BIK is a founding member of the BH3-only pro-apoptotic protein family. BIK is predominantly localized in the endoplasmic reticulum (ER) and induces apoptosis through the mitochondrial pathway by mobilizing calcium from the ER to the mitochondria. In this study, we determined that suppression of the death gene Bik promotes resistance to tamoxifen (TAM) in MCF-7 breast cancer cells. We utilized small interfering (siRNA) to specifically knockdown BIK in MCF-7 cells and studied their response to tamoxifen. The levels of cell apoptosis, the potential mitochondrial membrane (∆Ψ(m)), and the activation of total caspases were analyzed. Western blot analysis was used to determine the expression of some BCL-2 family proteins. Flow cytometry studies revealed an increase in apoptosis level in MCF-7 cells and a 2-fold increase in relative BIK messenger RNA (mRNA) expression at a concentration of 6.0 μM of TAM. BIK silencing, with a specific RNAi, blocked TAM-induced apoptosis in 45 ± 6.78% of cells. Moreover, it decreased mitochondrial membrane potential (Ψm) and total caspase activity, and exhibited low expression of pro-apoptotic proteins BAX, BAK, PUMA and a high expression of BCl-2 and MCL-1. The above suggests resistance to TAM, regulating the intrinsic pathway and indicate that BIK comprises an important factor in the process of apoptosis, which may exert an influence the ER pathway, which regulates mitochondrial integrity. Collectively, our results show that BIK is a central component of the programmed cell death of TAM-induced MCF-7 breast cancer cells. The silencing of BIK gene will be useful for future studies to establish the mechanisms of regulation of resistance to TAM.
Figures



Similar articles
-
Involvement of multiple cellular pathways in regulating resistance to tamoxifen in BIK-suppressed MCF-7 cells.Tumour Biol. 2015 Sep;36(9):6991-7005. doi: 10.1007/s13277-015-3374-6. Epub 2015 Apr 11. Tumour Biol. 2015. PMID: 25861752
-
Novel mechanism of anti-apoptotic function of 78-kDa glucose-regulated protein (GRP78): endocrine resistance factor in breast cancer, through release of B-cell lymphoma 2 (BCL-2) from BCL-2-interacting killer (BIK).J Biol Chem. 2011 Jul 22;286(29):25687-96. doi: 10.1074/jbc.M110.212944. Epub 2011 May 26. J Biol Chem. 2011. PMID: 21622563 Free PMC article.
-
Overexpression of TMEM47 Induces Tamoxifen Resistance in Human Breast Cancer Cells.Technol Cancer Res Treat. 2021 Jan-Dec;20:15330338211004916. doi: 10.1177/15330338211004916. Technol Cancer Res Treat. 2021. PMID: 33745390 Free PMC article.
-
BIK, the founding member of the BH3-only family proteins: mechanisms of cell death and role in cancer and pathogenic processes.Oncogene. 2008 Dec;27 Suppl 1(Suppl 1):S20-9. doi: 10.1038/onc.2009.40. Oncogene. 2008. PMID: 19641504 Free PMC article. Review.
-
TMBIM protein family: ancestral regulators of cell death.Oncogene. 2015 Jan 15;34(3):269-80. doi: 10.1038/onc.2014.6. Epub 2014 Feb 24. Oncogene. 2015. PMID: 24561528 Review.
Cited by
-
Impacts of Dietary Protein and Prebiotic Inclusion on Liver and Spleen Gene Expression in Hy-Line Brown Caged Layers.Animals (Basel). 2020 Mar 9;10(3):453. doi: 10.3390/ani10030453. Animals (Basel). 2020. PMID: 32182781 Free PMC article.
-
Involvement of multiple cellular pathways in regulating resistance to tamoxifen in BIK-suppressed MCF-7 cells.Tumour Biol. 2015 Sep;36(9):6991-7005. doi: 10.1007/s13277-015-3374-6. Epub 2015 Apr 11. Tumour Biol. 2015. PMID: 25861752
-
EGR3 and estrone are involved in the tamoxifen resistance and progression of breast cancer.J Cancer Res Clin Oncol. 2023 Dec;149(20):18103-18117. doi: 10.1007/s00432-023-05503-6. Epub 2023 Nov 24. J Cancer Res Clin Oncol. 2023. PMID: 37999751 Free PMC article.
-
The La-Related Proteins, a Family with Connections to Cancer.Biomolecules. 2015 Oct 16;5(4):2701-22. doi: 10.3390/biom5042701. Biomolecules. 2015. PMID: 26501340 Free PMC article. Review.
-
Reactive oxygen species in cancer: Mechanistic insights and therapeutic innovations.Cell Stress Chaperones. 2025 Aug 5;30(5):100108. doi: 10.1016/j.cstres.2025.100108. Online ahead of print. Cell Stress Chaperones. 2025. PMID: 40769273 Free PMC article. Review.
References
-
- Zhao X, Wang L, Sun Y, et al. The endoplasmic reticulum (ER)-target protein Bik induces Hep3B cell apoptosis by the depletion of the ER Ca2+stores. Mol Cell Biochem. 2008;312:33–38. - PubMed
-
- Lan KL, Yen SH, Liu RS, Shih HL, Tseng FW, Lan KH. Mutant Bik gene transferred by cationic liposome inhibits peritoneal disseminated murine colon cancer. Clin Exp Metastasis. 2007;24:461–470. - PubMed
-
- Sturm I, Stephan C, Gillissen B, et al. Loss of the tissue-specific proapoptotic BH3-only protein Nbk/Bik is a unifying feature of renal cell carcinoma. Cell Death Differ. 2006;13:619–627. - PubMed
Publication types
MeSH terms
Substances
LinkOut - more resources
Full Text Sources
Other Literature Sources
Research Materials

