Optimization of extraction of phenolics from leaves of Ficus virens
- PMID: 24101207
- PMCID: PMC3796642
- DOI: 10.1631/jzus.B1200365
Optimization of extraction of phenolics from leaves of Ficus virens
Abstract
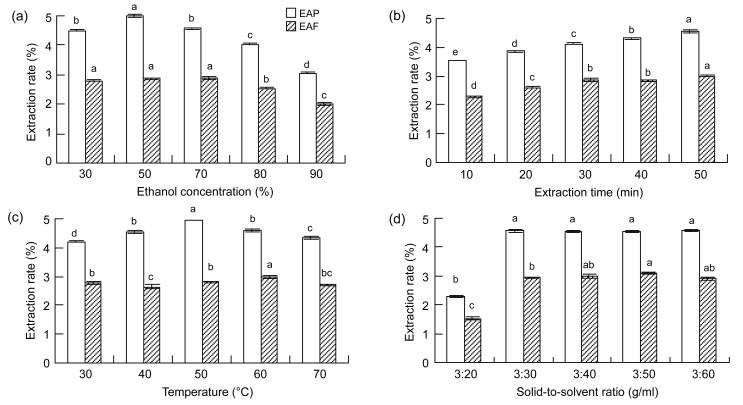
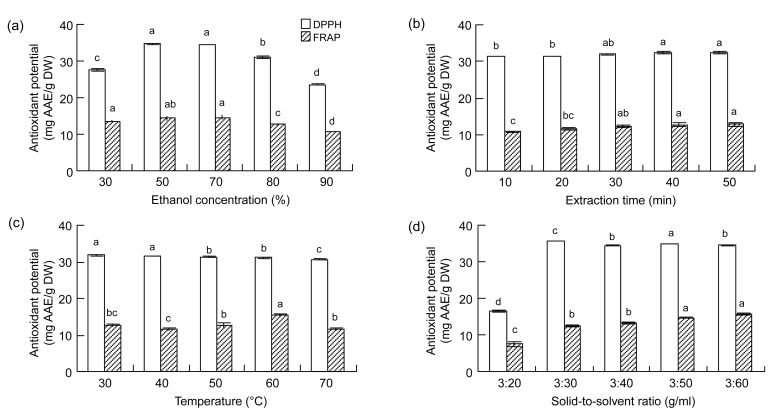
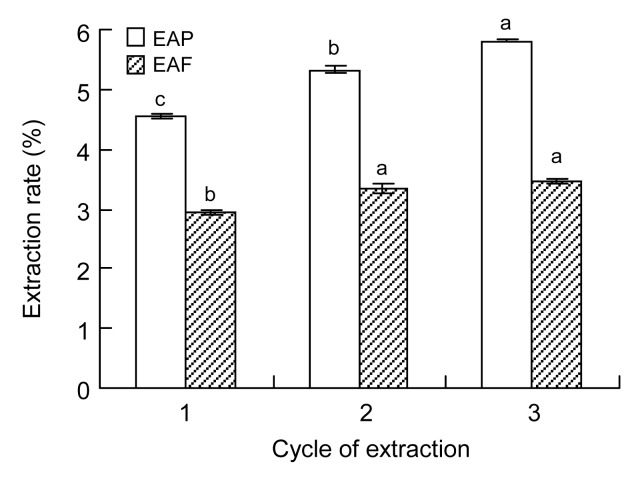
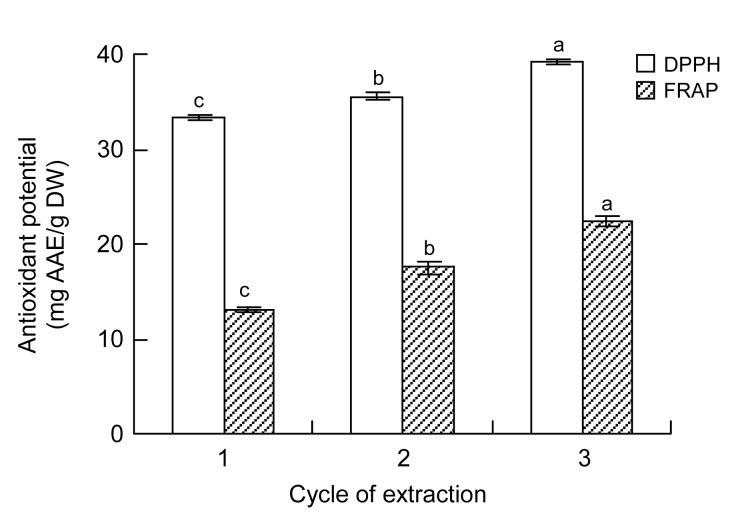
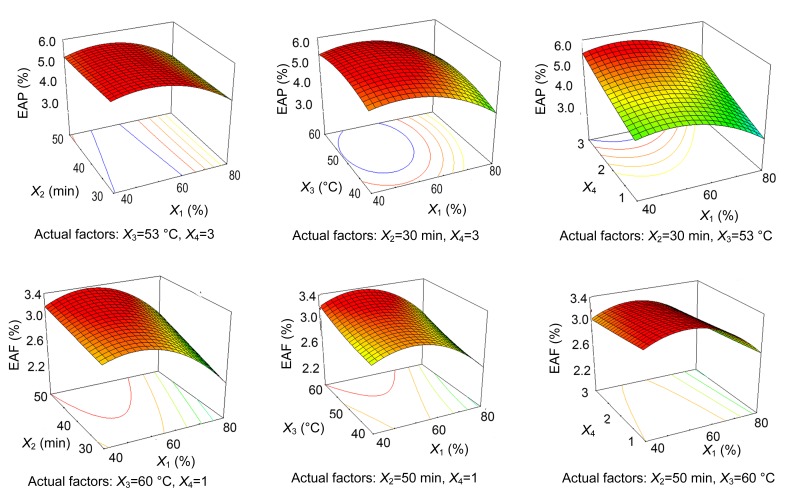
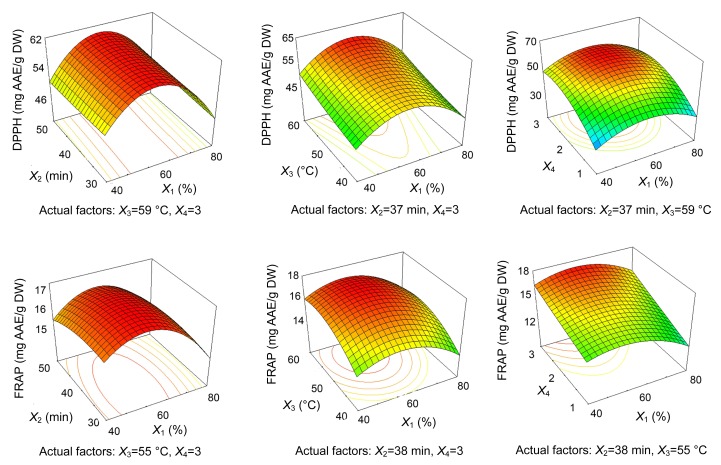
In this research, the conditions for extraction of phenolics from leaves of Ficus virens were optimized using response surface methodology (RSM). The extraction abilities of phenolics (EAP) and flavonoids (EAF), the 2,2-diphenyl-1-pierylhydrazyl (DPPH) free-radical scavenging potential, and the ferric reducing/antioxidant power (FRAP) were used as quality indicators. The results of single-factor experiments showed that temperature, ethanol concentration, extraction time, and the number of extraction cycles were the main influencing variables, and these provided key information for the central composite design. The results of RSM fitted well to a second degree polynomial model and more than 98% of the variability was explained. The ideal extraction conditions for EAP, EAF, DPPH free-radical scavenging potential, and FRAP were obtained. Considering the four quality indicators overall, the ideal extraction conditions were 58% ethanol at 57 °C for 37 min with three extraction cycles. At the ideal extraction conditions, the values of EAP, EAF, DPPH free-radical scavenging potential, and FRAP were 5.72%, 3.09%, 58.88 mg ascorbic acid equivalent (AAE)/g dry weight (DW), and 15.86 mg AAE/g DW, respectively. In addition, linear correlations were observed between EAP, EAF, and antioxidant potential.
Conflict of interest statement
This article does not contain any studies with human or animal subjects performed by any of the authors.
Figures
Similar articles
-
Radical scavenging potential of phenolics from Bryophyllum pinnatum (LAM.) OKEN.Prep Biochem Biotechnol. 2011;41(3):305-19. doi: 10.1080/10826068.2010.541314. Prep Biochem Biotechnol. 2011. PMID: 21660869
-
Optimization of Extraction Conditions for Maximal Phenolic, Flavonoid and Antioxidant Activity from Melaleuca bracteata Leaves Using the Response Surface Methodology.PLoS One. 2016 Sep 9;11(9):e0162139. doi: 10.1371/journal.pone.0162139. eCollection 2016. PLoS One. 2016. PMID: 27611576 Free PMC article.
-
Estimation of cholinesterase inhibitory and antioxidant effects of the leaf extracts of Anatolian Ficus carica var. domestica and their total phenol and flavonoid contents.Nat Prod Commun. 2011 Mar;6(3):375-8. Nat Prod Commun. 2011. PMID: 21485278
-
Antioxidant activity of phenolic and flavonoid compounds in some medicinal plants of India.Nat Prod Res. 2011 Jul;25(11):1101-9. doi: 10.1080/14786419.2010.498372. Nat Prod Res. 2011. PMID: 21726132
-
Determination of Antioxidants by DPPH Radical Scavenging Activity and Quantitative Phytochemical Analysis of Ficus religiosa.Molecules. 2022 Feb 16;27(4):1326. doi: 10.3390/molecules27041326. Molecules. 2022. PMID: 35209118 Free PMC article.
Cited by
-
Exploration of avocado by-products as natural sources of bioactive compounds.PLoS One. 2018 Feb 14;13(2):e0192577. doi: 10.1371/journal.pone.0192577. eCollection 2018. PLoS One. 2018. PMID: 29444125 Free PMC article.
-
Extraction and analysis of antioxidant compounds from the residues of Asparagus officinalis L.J Food Sci Technol. 2015 May;52(5):2690-700. doi: 10.1007/s13197-014-1360-4. Epub 2014 Apr 20. J Food Sci Technol. 2015. PMID: 25892766 Free PMC article.
-
Condensed tannins from Ficus virens as tyrosinase inhibitors: structure, inhibitory activity and molecular mechanism.PLoS One. 2014 Mar 17;9(3):e91809. doi: 10.1371/journal.pone.0091809. eCollection 2014. PLoS One. 2014. PMID: 24637701 Free PMC article.
-
Antioxidant Potential of Spray- and Freeze-Dried Extract from Oregano Processing Wastes, Using an Optimized Ultrasound-Assisted Method.Foods. 2023 Jul 7;12(13):2628. doi: 10.3390/foods12132628. Foods. 2023. PMID: 37444366 Free PMC article.
-
Vibrational Spectroscopy-Based Chemometrics Analysis of Clinacanthus nutans Extracts after Postharvest Processing and Extract Effects on Cardiac C-Kit Cells.Evid Based Complement Alternat Med. 2022 Feb 23;2022:1967593. doi: 10.1155/2022/1967593. eCollection 2022. Evid Based Complement Alternat Med. 2022. PMID: 35251203 Free PMC article.
References
-
- Abdel-Hameed ESS. Total phenolic contents and free radical scavenging activity of certain Egyptian Ficus species leaf samples. Food Chem. 2009;114(4):1271–1277. doi: 10.1016/j.foodchem.2008.11.005. - DOI
-
- Ao C, Li A, Elzaawely AA, Xuan TD, Tawata S. Evaluation of antioxidant and antibacterial activities of Ficus microcarpa L. fil. extract. Food Control. 2008;19(10):940–948. doi: 10.1016/j.foodcont.2007.09.007. - DOI
-
- Brand-Williams W, Cuvelier ME, Berset C. Use of a free radical method to evaluate antioxidant activity. LWT-Food Sci Technol. 1995;28(1):25–30. doi: 10.1016/S0023-6438(95)80008-5. - DOI
-
- Bucić-Kojić A, Planinić M, Tomas S, Jakobek L, Šeruga M. Influence of solvent and temperature on extraction of phenolic compounds from grape seed, antioxidant activity and colour of extract. Int J Food Sci Technol. 2009;44(12):2394–2401. doi: 10.1111/j.1365-2621.2008.01876.x. - DOI
Publication types
MeSH terms
Substances
LinkOut - more resources
Full Text Sources
Other Literature Sources
Miscellaneous