Comparative Study
. 2013 Dec;84(6):935-47.
doi: 10.1124/mol.113.089334. Epub 2013 Oct 7.

Indistinguishable synaptic pharmacodynamics of the N-methyl-D-aspartate receptor channel blockers memantine and ketamine

Affiliations
Comparative Study

Indistinguishable synaptic pharmacodynamics of the N-methyl-D-aspartate receptor channel blockers memantine and ketamine

Christine M Emnett et al. Mol Pharmacol. 2013 Dec.

Abstract

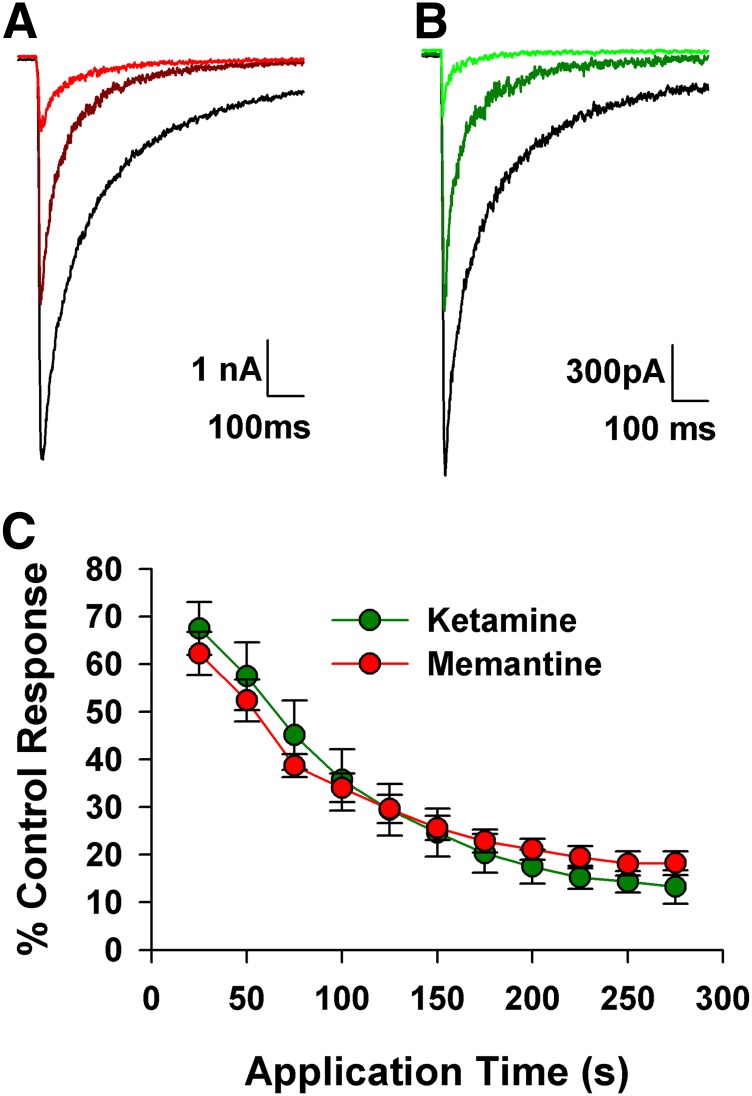
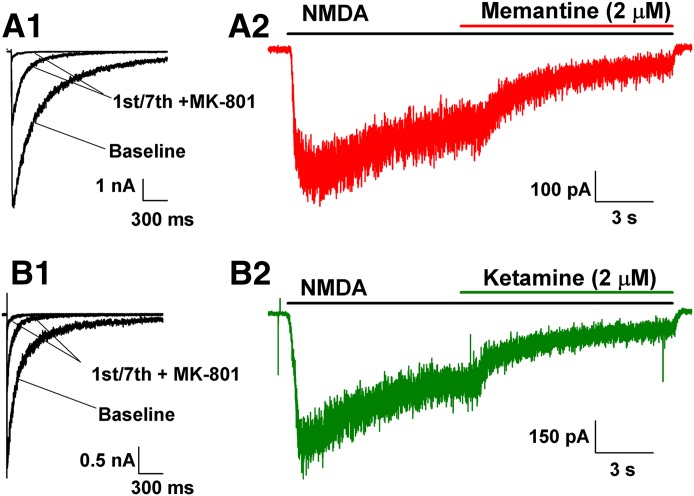
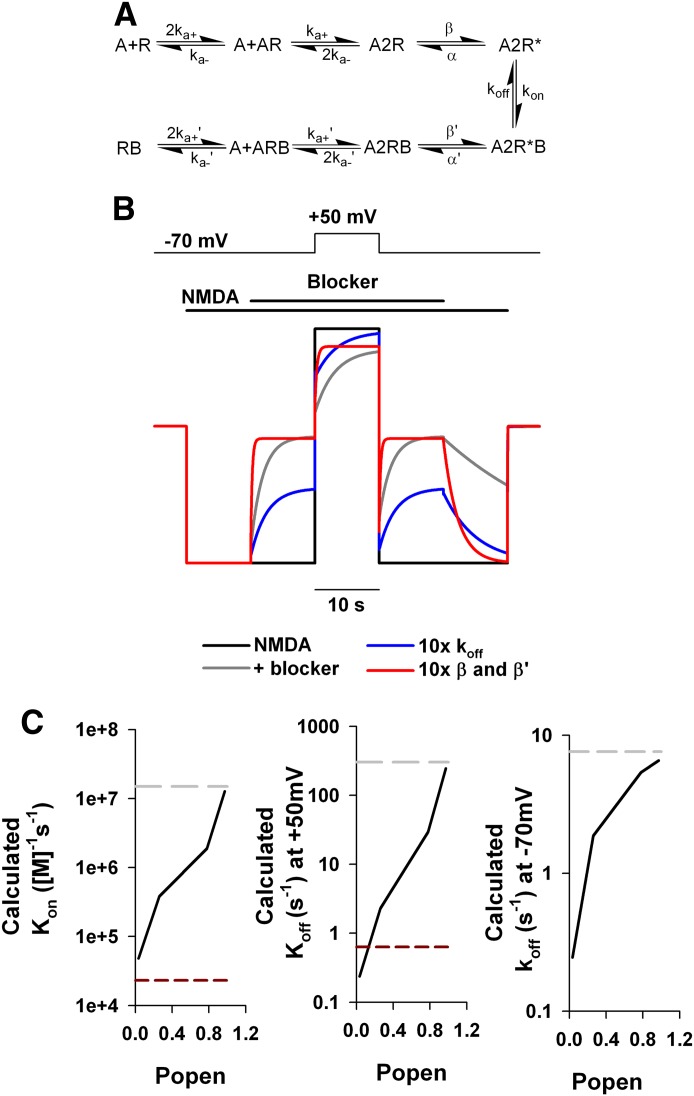
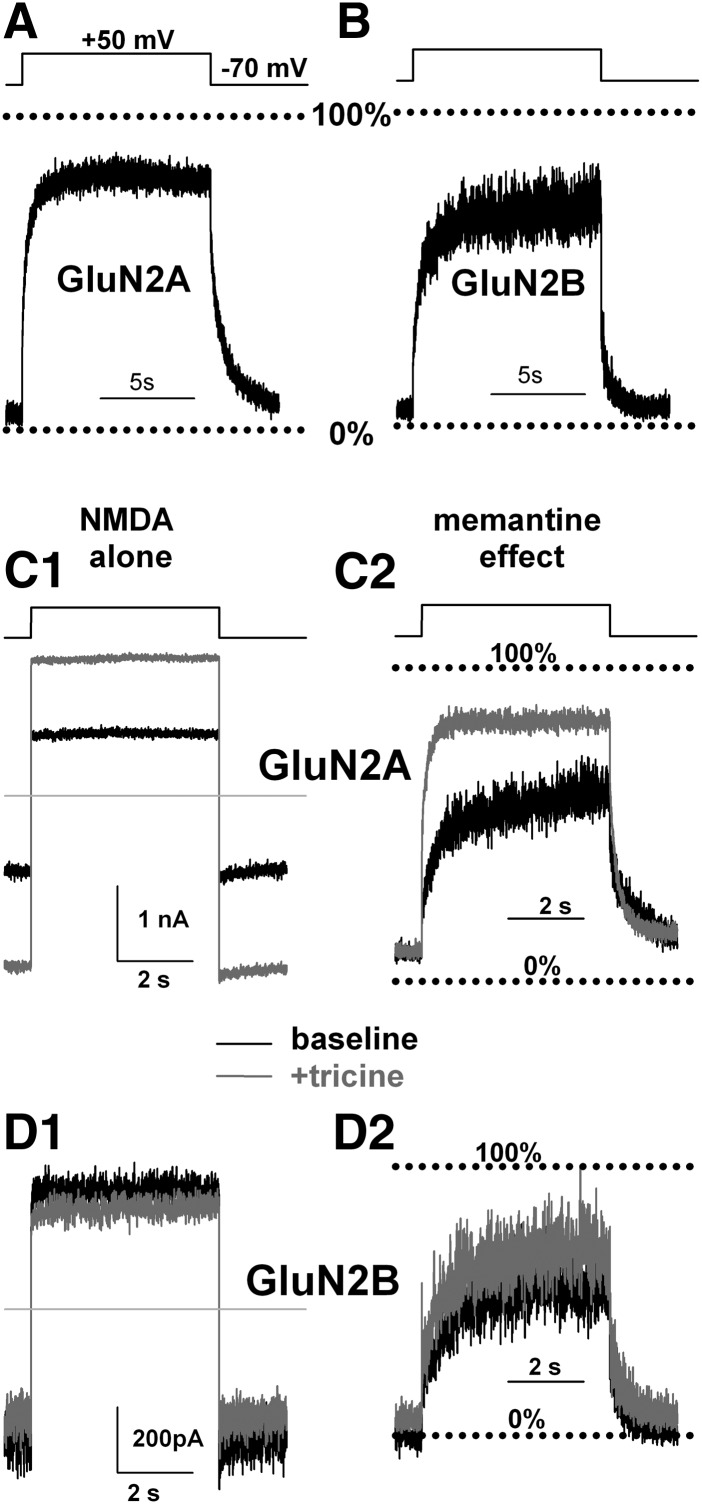
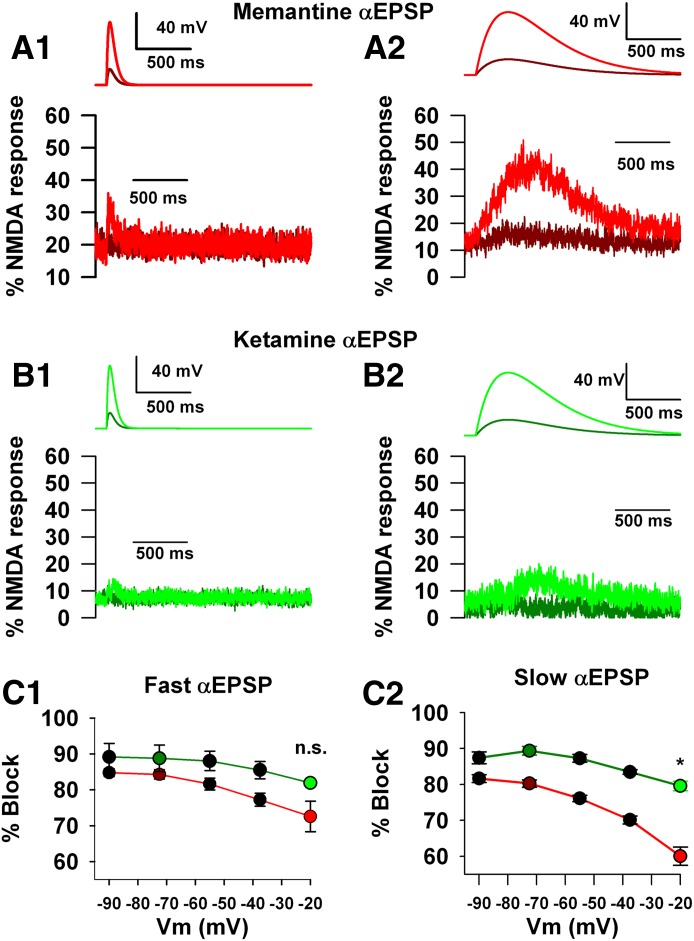
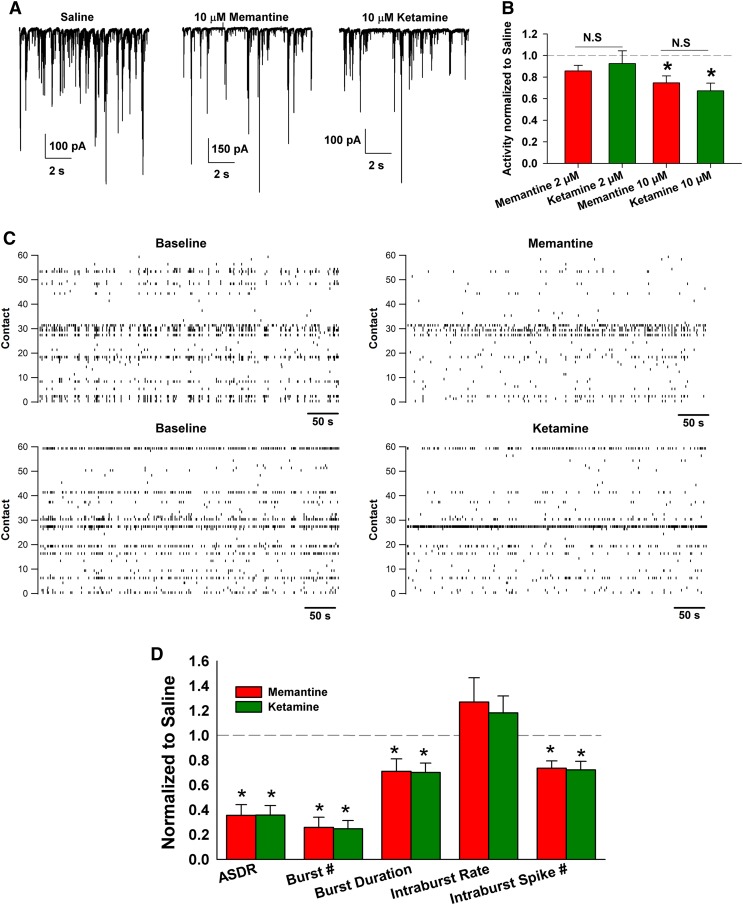
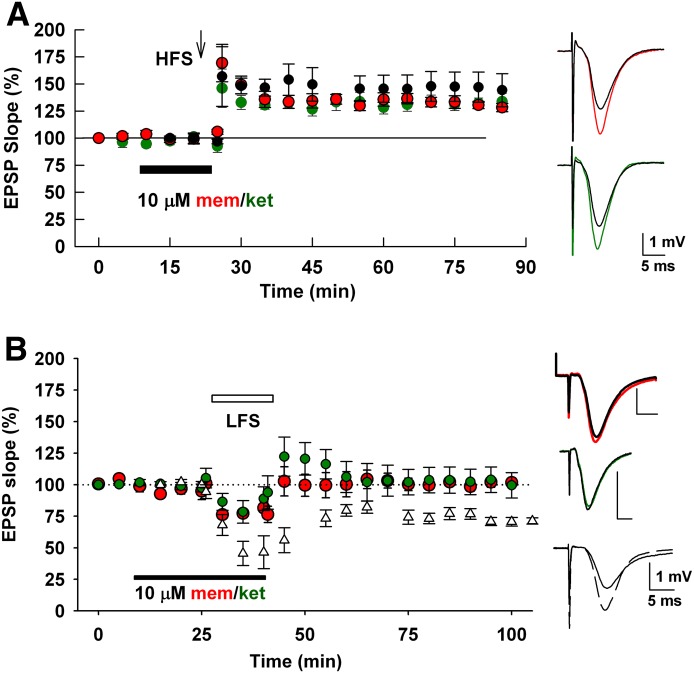
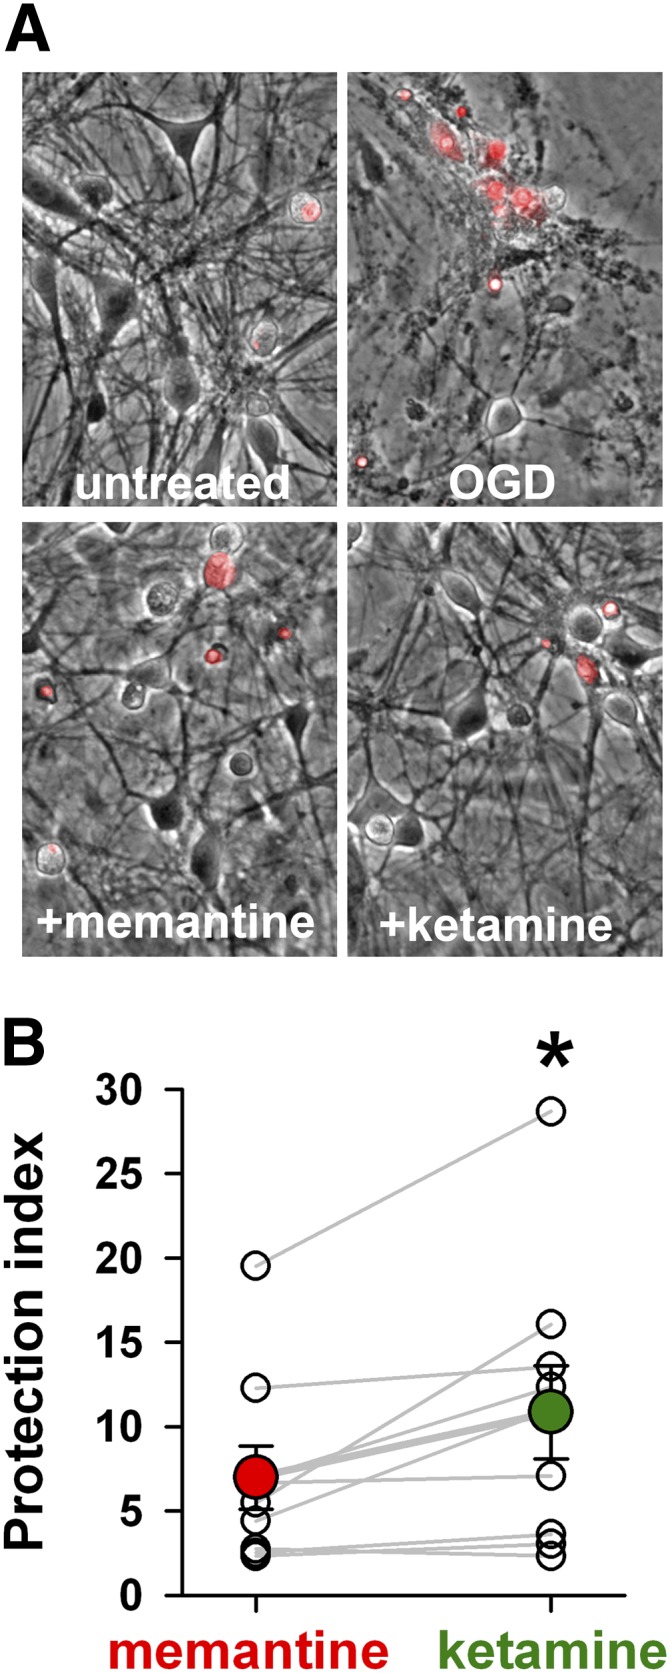
Memantine and ketamine, voltage- and activation-dependent channel blockers of N-methyl-d-aspartate (NMDA) receptors (NMDARs), have enjoyed a recent resurgence in clinical interest. Steady-state pharmacodynamic differences between these blockers have been reported, but it is unclear whether the compounds differentially affect dynamic physiologic signaling. In this study, we explored nonequilibrium conditions relevant to synaptic transmission in hippocampal networks in dissociated culture and hippocampal slices. Equimolar memantine and ketamine had indistinguishable effects on the following measures: steady-state NMDA currents, NMDAR excitatory postsynaptic current (EPSC) decay kinetics, progressive EPSC inhibition during repetitive stimulation, and extrasynaptic NMDAR inhibition. Therapeutic drug efficacy and tolerability of memantine have been attributed to fast kinetics and strong voltage dependence. However, pulse depolarization in drug presence revealed a surprisingly slow and similar time course of equilibration for the two compounds, although memantine produced a more prominent fast component (62% versus 48%) of re-equilibration. Simulations predicted that low gating efficacy underlies the slow voltage-dependent relief from block. This prediction was empirically supported by faster voltage-dependent blocker re-equilibration with several experimental manipulations of gating efficacy. Excitatory postsynaptic potential-like voltage commands produced drug differences only with large, prolonged depolarizations unlikely to be attained physiologically. In fact, we found no difference between drugs on measures of spontaneous network activity or acute effects on plasticity in hippocampal slices. Despite indistinguishable synaptic pharmacodynamics, ketamine provided significantly greater neuroprotection from damage induced by oxygen glucose deprivation, consistent with the idea that under extreme depolarizing conditions, the biophysical difference between drugs becomes detectable. We conclude that despite subtle differences in voltage dependence, during physiologic activity, blocker pharmacodynamics are largely indistinguishable and largely voltage independent.


Figures

Fig. 1.
Fig. 1.
Memantine and ketamine have indistinguishable IC50s (A and B). Inhibition of NMDAR current was evaluated for memantine (A) and ketamine (B) as indicated in dissociated hippocampal cultures at day in vitro 9 and 10. Increasing concentrations of the drugs (0.1, 1, 10, 100 μM) were applied to hippocampal neurons in the constant presence of 30 μM NMDA. Peak current is truncated for clarity. (C) Concentration-response curves, with IC50 values estimated from fits to the Hill equation (nN = 6). Memantine IC50: 2.1 µM; ketamine IC50: 1.5 µM.
Fig. 2.
Fig. 2.
Memantine and ketamine effects on NMDAR EPSCs are indistinguishable. (A) Autaptic EPSCs from solitary neurons 10–12 days in vitro were measured in the presence of saline, memantine (10 μM), and ketamine (10 μM). Memantine and ketamine sweeps alternated with saline (5 sweeps) to restore EPSC to baseline. Two or three replicate sweeps for each condition were averaged. Biexponential fits for the three conditions (blue, saline; red, memantine; green, ketamine) are overlaid on the raw traces. Inset shows scaled traces on an expanded time scale to indicate the fit of the initial fast component and the similarity of drug effects. (B) Parameters from biexponential curve fitting of the decay phase of the EPSC. Memantine and ketamine both significantly accelerated the biexponential decay kinetics of the EPSC (fast and slow τ and the relative contribution, *P < 0.05, Student’s t test), but effects did not differ between drugs (n = 8).
Fig. 3.
Fig. 3.
Memantine and ketamine reach maximal synaptic block with similar time course. (A) Memantine (10 μM) block of autaptic NMDAR EPSCs generated with 0.04-Hz stimulation. Indicated are saline (black), first memantine application (dark red), and final memantine sweep (bright red). (B) Identical protocol with 10 μM ketamine: dark green is first application, bright green is final sweep. (C) Amplitudes of successive sweeps are graphed as a percentage of initial baseline amplitude. Memantine and ketamine did not differ in the degree or rate of block over successive applications (n = 5, P > 0.05, Student’s t test). Memantine data are reproduced from Wroge et al. (2012).
Fig. 4.
Fig. 4.
Memantine and ketamine block extrasynaptic NMDARs equally. (A1 and B1) Synaptic NMDARs were blocked by the slowly reversible open-channel blocker MK-801 (10 µM) during stimulation of autaptic EPSCs (0.04 Hz). (A2 and B2) Isolated extrasynaptic NMDARs were activated by 30 µM NMDA and challenged with an IC50 concentration of memantine (A2, 2 µM) or ketamine (B2, 2 μM). The relative block achieved by memantine or ketamine at the end of the application compared with steady-state control NMDA response measured immediately before drug application did not differ between the two drugs (see Results for values, P > 0.05 Student’s t test, n = 6).
Fig. 5.
Fig. 5.
Memantine exhibits a significantly larger fast component of voltage-dependent re-equilibration after a voltage-pulse depolarization. (A1 and A2) 300 μM NMDA alone (black) or during steady-state block current of 10 μM memantine (A1, red) or 10 μM ketamine (A2, green) during a voltage step from −70 to +50 mV. Drugs were interleaved on the same cell, with NMDA application to relieve block. Traces are displayed after digital baseline saline subtraction. Gray line indicates 0 pA. Memantine and ketamine effects are shown as a percentage of baseline NMDA control (obtained by digital ratio) below original traces. (B) The percent block of NMDA currents achieved by both memantine and ketamine at −70 mV (before the voltage step) were identical, but inhibition at +50 mV was significantly lower for memantine than ketamine (n = 14 *P < 0.05). Two-way analysis of variance (ANOVA) with replication and Bonferroni correction for multiple comparisons). (C) The relaxation from block at −70 mV to the new steady state at +50 mV was fit with a biexponential curve. Memantine traces showed a significantly stronger fast component compared with ketamine (n = 14,*P < 0.05, Student t test). n.s., not significant.
Fig. 6.
Fig. 6.
Simulations demonstrate that low Popen slows voltage-dependent re-equilibration of blocker. (A) Kinetic scheme used in the simulations. Rate constants were adapted from Blanpied et al. (1997) and were ka+ = 2 µM−1 s−1, ka-= 40 sec−1, β = 5.2 sec−1, α = 130 sec−1, kon = 14.9 µM−1 s−1, koff = 7.6 sec−1, β′ = 0.3 sec−1, α′ = 35.4 sec−1, ka+′ = 0.2 µM−1 s−1, ka-′ = 0.02 sec−1, [NMDA] = 300 µM, [blocker] = 10 µM. A2R* and A2R*B represent the open channel in its unblocked and blocked state, respectively. (B) Output of the simulation replicating a voltage jump in the presence (gray) and absence (black) of a voltage-dependent open-channel blocker of the NMDAR. Voltage dependence of the open channel blocker was achieved by decreasing koff by e-fold per 31.5 mV (Kotermanski and Johnson, 2009). Colored traces are as depicted in the legend. See Materials and Methods for more details of the simulation. Simulation output (representing channels in the A2R* state) was normalized to initial NMDA-only amplitude (3.8% of receptors for the black, gray, and blue traces; 28.6% for the red trace). Changing blocker dissociation (blue) reduced steady-state block but did not appreciably alter the re-equilibration kinetics at +50 mV. By contrast, accelerating channel opening (red) sped re-equilibration kinetics during wash on/off at −70 mV and after the pulse to +50 mV. (C) Calculated rate constants derived from tau of re-equilibration at positive potentials at varying efficacies, plotted as a function of Popen (altered by incrementing β and β′ in10-fold steps). Simulation output (black line) is compared with simulation input (gray line). Popen needed to approach 1 (0.97) to retrieve values of the same order of magnitude of simulation input. Calculated rate constants for memantine from our data in Fig. 5 are also plotted as red lines. Horizontal lines are for reference purposes and are not a function of Popen.
Fig. 7.
Fig. 7.
Experimentally increasing Popen speeds re-equilibration. (A and B) GluN2A-containing NMDA receptors exhibit faster re-equilibration than GluN2B-containing receptors. (C1 and D1) 10 mM Tricine potentiates NMDA currents in GluN1/GluN2A-transfected HEK cells but not GluN1/GluN2B cells. (C2 and D2) Tricine speeds re-equilibration of memantine at positive voltages in GluN2A-containing but not GluN2B-containing receptors. See Results for quantification.
Fig. 8.
Fig. 8.
Differences in voltage dependence are detectable only with large, broad depolarizations. (A1 and A2) Hippocampal neurons were voltage clamped using an αEPSP voltage command waveform of short (A1, τ = 30 milliseconds) or long (A2, τ = 300 milliseconds) duration. Cells were bathed in saline, NMDA alone (300 μM), then memantine (2 μM) plus NMDA. In each condition, from a Vm of –90 mV, consecutive sweeps simulated EPSPs of increasing amplitude (Vm at maximum: −72.5, −55, −37.5,−20 mV). Leak currents in saline were subtracted from each experimental condition. Traces represent percent inhibition of the NMDA-only current during the smallest depolarization (–72.5 mV, dark red) and largest (−20 mV, bright red), so upward excursion of the traces represents relief from drug-induced inhibition. (B1 and B2) Same protocol for ketamine (2 μM) (traces, dark green: −72.5 mV, bright green: −20 mV). (C1 and C2) Peak block at each potential for each EPSP duration for memantine and ketamine. Colored circles correspond to the conditions represented by the traces in A and B. No significant interaction was found between drug and voltage with the brief αEPSPs [C1, two-way analysis of variance (ANOVA)]. However a significant interaction emerged with prolonged αEPSPs, with memantine exhibiting more unblock than ketamine on strong depolarization (C2, *P < 0.05, drug by voltage interaction, two-way ANOVA, n = 5 to 6). n.s., not significant.
Fig. 9.
Fig. 9.
Network effects of memantine and ketamine. (A) A neuron was voltage clamped at −70 mV in a blocker-free external solution containing 1 µM glycine. Network activity was measured as AMPA-driven spontaneous EPSCs onto the neuron over 60-second intervals. Network activity was allowed to stabilize for 2 minutes before baseline data collection, and drugs were allowed 60 seconds of equilibration before recording. Memantine and ketamine (10 µM) were interleaved between saline recordings, and the presentation order was reversed from cell to cell. (B) Synaptic activity was quantified as synaptic charge exceeding a threshold of 7.5 pA over the 60 seconds of recording time. Activity in drug was compared with the average activity during baseline and washout conditions. At 2 µM, no significant effect of either drug on synaptic activity (n = 6) was seen. However, at 10 µM, both drugs depressed activity (*P < 0.05, unpaired t test to normalized baseline), but depression did not significantly differ between drugs (n = 12). (C) MEA recordings from cultures in the presence of control media (baseline) or 10 µM memantine or ketamine. Representative raster plots are shown from one experiment using sibling cultures for memantine and ketamine. (D) Overall statistics for array-wide and network properties summarized and normalized to baseline. Asterisks indicate significant differences (P < 0.05, two-tailed unpaired t test) from baseline (indicated by dotted gray line). Memantine and ketamine did not significantly differ from each other in any parameter tested (n = 10, two-tailed, unpaired t test). Bursts were defined as described in Materials and Methods.
Fig. 10.
Fig. 10.
Memantine and ketamine’s effects on LTP and LTD induction. (A) LTP induction [100 Hz for 1 second, arrow, high-frequency stimulus (HFS)] was unaffected by 10 µM memantine or ketamine (preapplied for 15 minutes as indicated). (B) LTD induction (1 Hz for 15 minutes white bar) was blocked by both drugs (10 µM, preapplied for 15 minutes). Drugs were administered for the durations shown by the black bars. LTP and LTD in control slices are shown by black circles (A) and white triangles (B). Six slices were tested for each experimental condition in A and B. Insets show representative fEPSP waveforms.
Fig. 11.
Fig. 11.
Ketamine promotes stronger neuroprotection than memantine against OGD. (A) Representative fields from DIV13-15 hippocampal cultures exposed to 2.5 hours OGD, allowed to recover for 24 hours, then assayed with propidium iodide (red, 3 μM) to stain nuclei of compromised neurons. Propidium iodide image is superimposed on a phase contrast image. Drugs were evaluated at 10 µM and were present during OGD only. (B) Protection index of memantine and ketamine was calculated by normalizing survival in all OGD conditions to survival of an untreated sibling dish and plotting drug effects relative to OGD alone. Open circles and gray lines indicate the results of individual experiments using sibling cultures treated at the same time (n = 9). Colored circles are averages across all experiments. Ketamine neuroprotection was significantly greater than that with memantine (*P = 0.01, paired t test).
Fig. 12.
Fig. 12.
Altering receptor gating while blocker is bound recapitulates experimentally observed differences between memantine and ketamine. Simulation output depicted as percent NMDA response in the presence of blocker using the kinetic scheme in Fig. 6 (0% at dotted line represents full block) for baseline (black, β′: 0.3 sec−1, α′: 35.4 sec−1, same as Fig. 6) and adjusted rate constants (red, β′: 0.6 sec−1, α′: 55.4 sec−1). Adjusted kinetic values were reached by doubling β′ and then manipulating α′ to yield similar steady-state block at −70 mV. Faster kinetics of gating in the blocked states resulted in a faster time course of re-equilibration (gray lines represent exponential fits; τ = 883 milliseconds for red 1393 milliseconds for black) and increased apparent steady-state voltage dependence, similar to the experimental difference between memantine (faster, more voltage dependence) and ketamine (slower, weaker voltage dependence).

Similar articles

Cited by

References

    1. Aan Het Rot M, Zarate CA, Jr, Charney DS, Mathew SJ. (2012) Ketamine for depression: where do we go from here? Biol Psychiatry 72:537–547 - PMC - PubMed
    1. Adams PR. (1977) Voltage jump analysis of procaine action at frog end-plate. J Physiol 268:291–318 - PMC - PubMed
    1. Amico-Ruvio SA, Murthy SE, Smith TP, Popescu GK. (2011) Zinc effects on NMDA receptor gating kinetics. Biophys J 100:1910–1918 - PMC - PubMed
    1. Autry AE, Adachi M, Nosyreva E, Na ES, Los MF, Cheng PF, Kavalali ET, Monteggia LM. (2011) NMDA receptor blockade at rest triggers rapid behavioural antidepressant responses. Nature 475:91–95 - PMC - PubMed
    1. Bear MF. (1995) Mechanism for a sliding synaptic modification threshold. Neuron 15:1–4 - PubMed

Publication types

MeSH terms

LinkOut - more resources