. 2013 Oct 21;210(11):2415-33.
doi: 10.1084/jem.20130150. Epub 2013 Oct 7.

Regulated vesicle fusion generates signaling nanoterritories that control T cell activation at the immunological synapse

Affiliations

Regulated vesicle fusion generates signaling nanoterritories that control T cell activation at the immunological synapse

Helena Soares et al. J Exp Med. .

Abstract

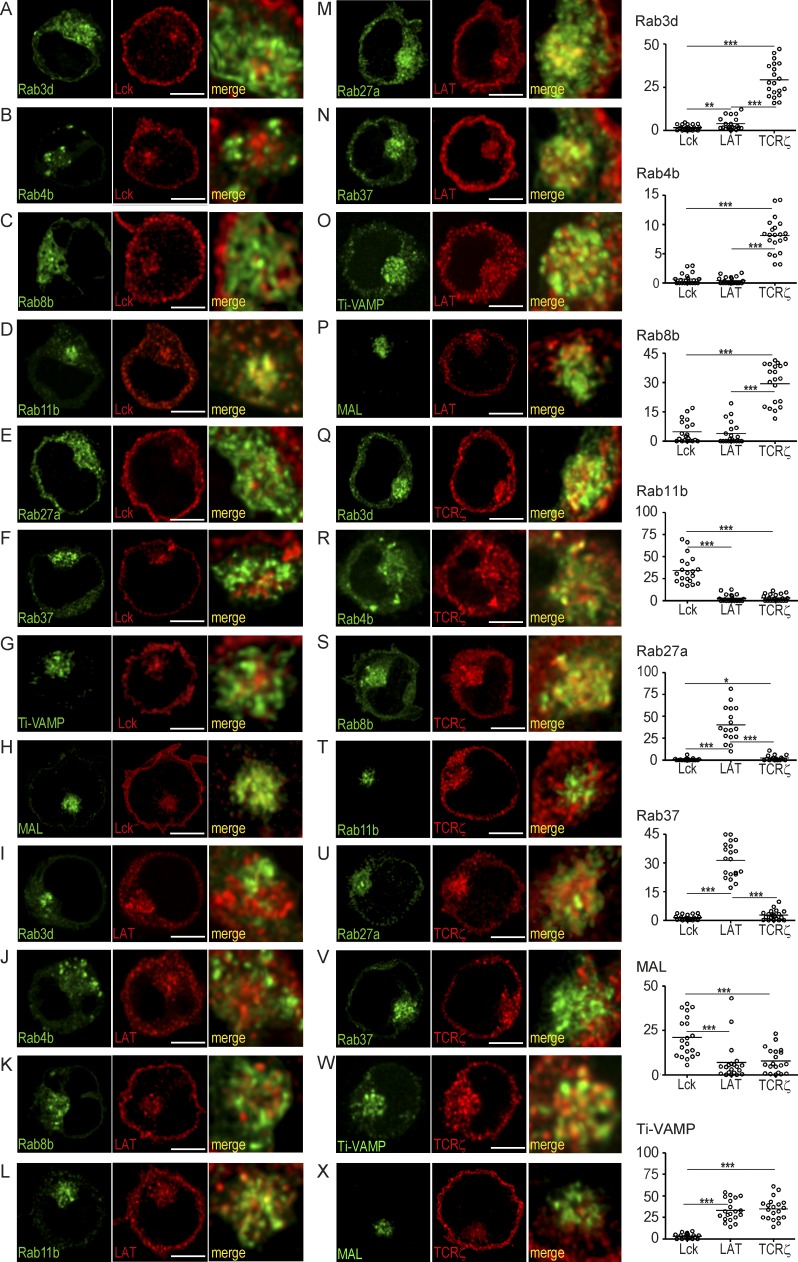
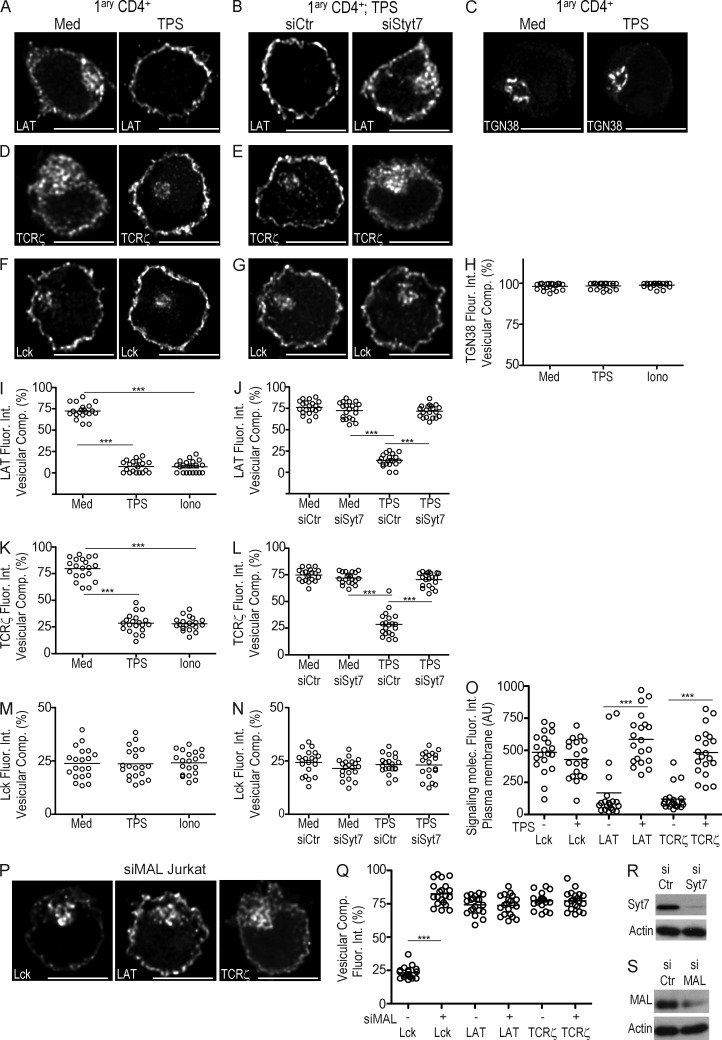
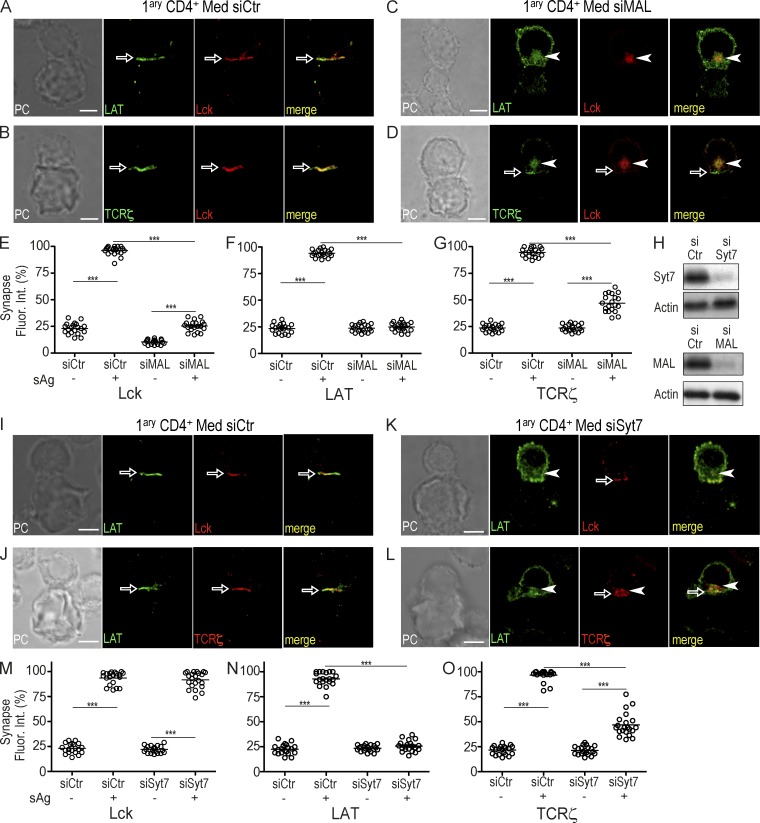
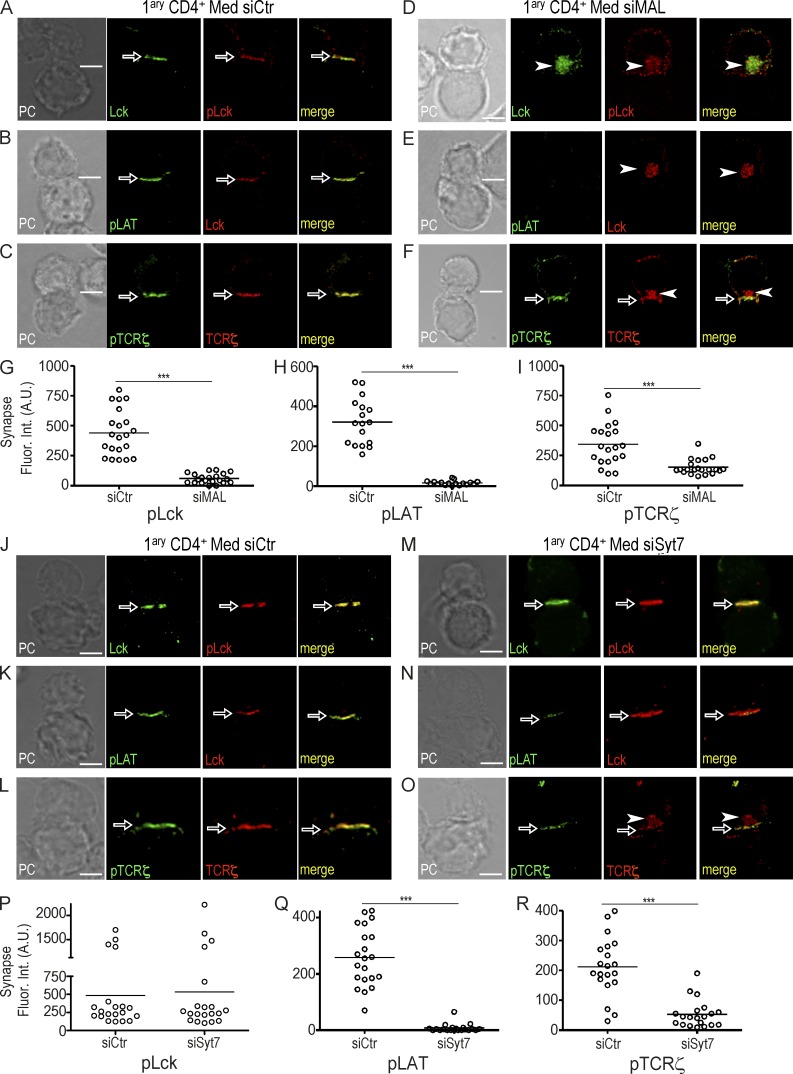
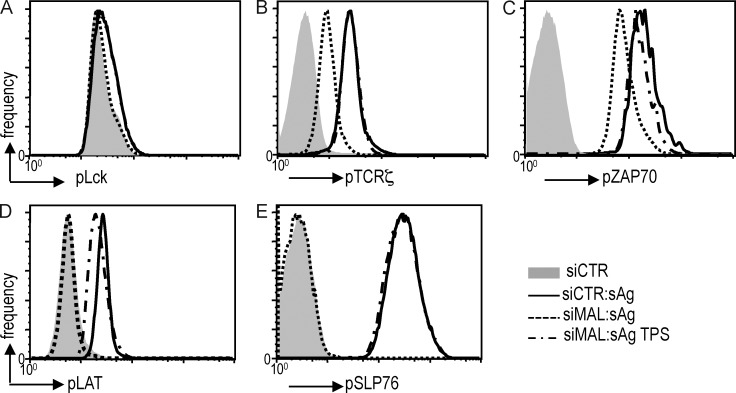
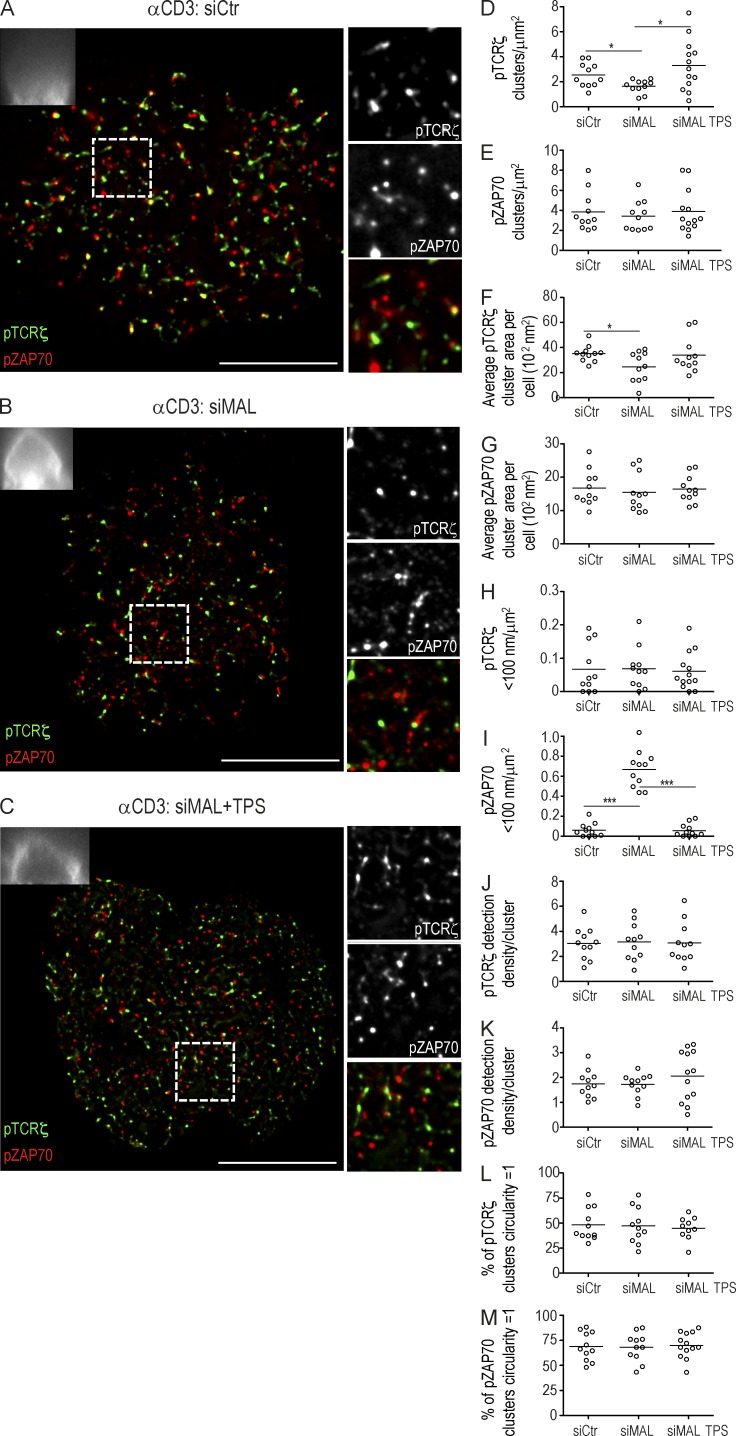
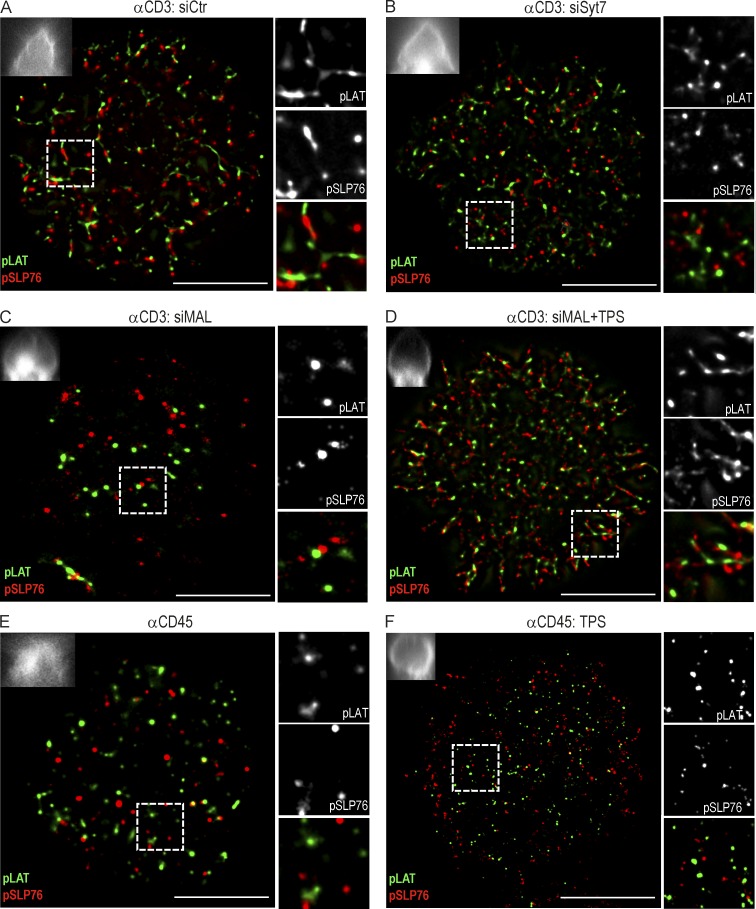
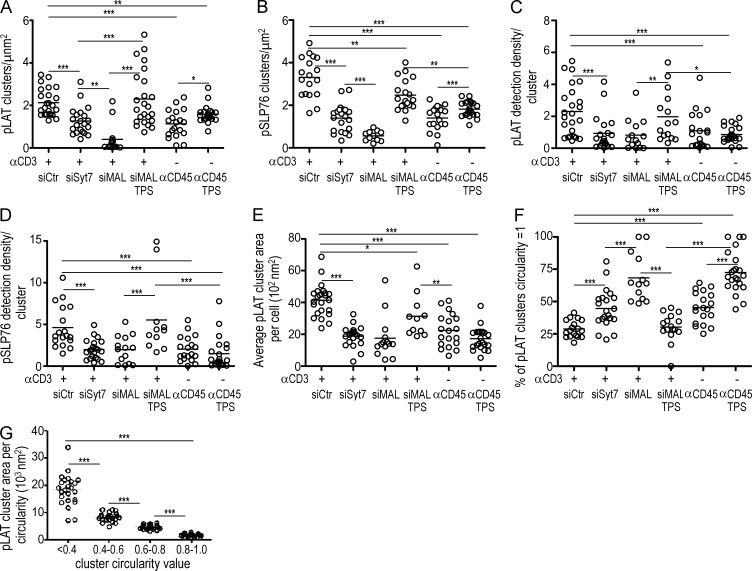
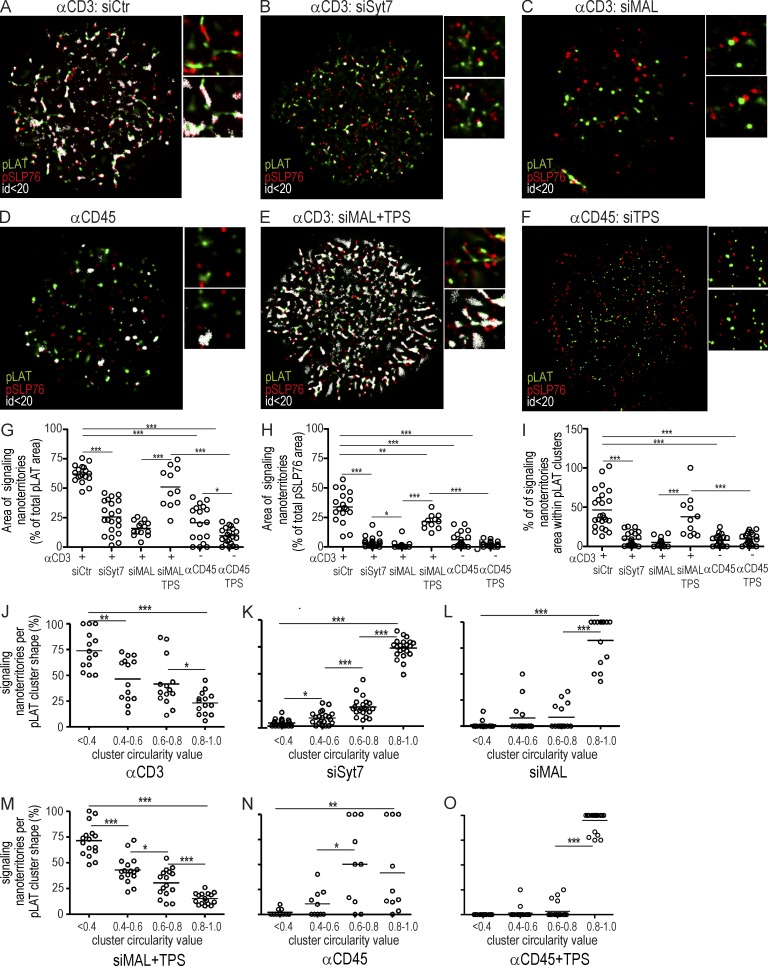
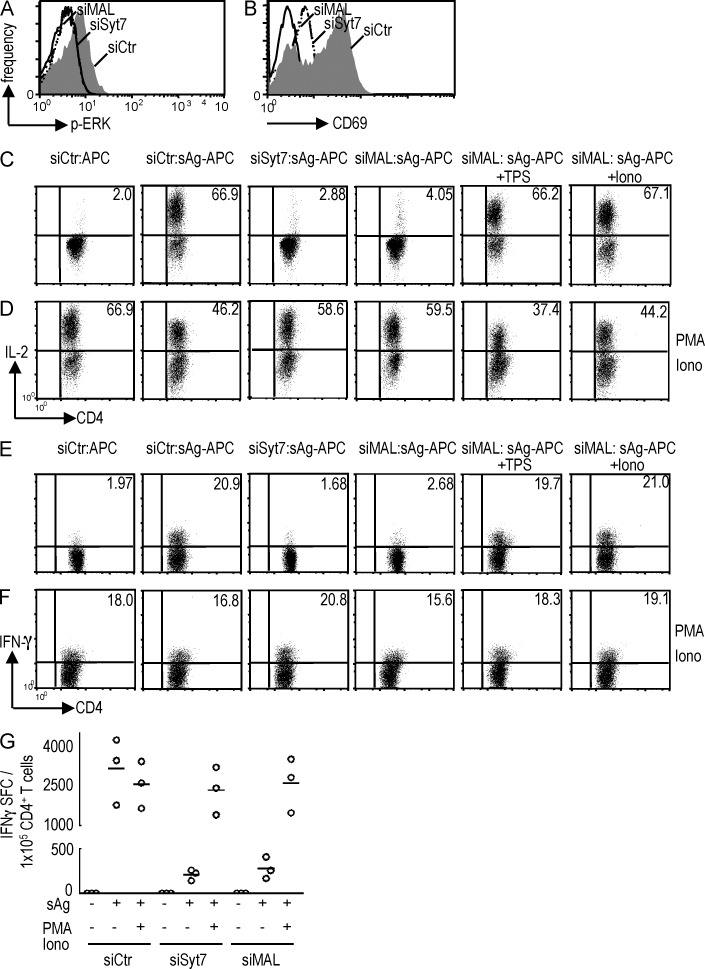
How the vesicular traffic of signaling molecules contributes to T cell receptor (TCR) signal transduction at the immunological synapse remains poorly understood. In this study, we show that the protein tyrosine kinase Lck, the TCRζ subunit, and the adapter LAT traffic through distinct exocytic compartments, which are released at the immunological synapse in a differentially regulated manner. Lck vesicular release depends on MAL protein. Synaptic Lck, in turn, conditions the calcium- and synaptotagmin-7-dependent fusion of LAT and TCRζ containing vesicles. Fusion of vesicles containing TCRζ and LAT at the synaptic membrane determines not only the nanoscale organization of phosphorylated TCRζ, ZAP70, LAT, and SLP76 clusters but also the presence of phosphorylated LAT and SLP76 in interacting signaling nanoterritories. This mechanism is required for priming IL-2 and IFN-γ production and may contribute to fine-tuning T cell activation breadth in response to different stimulatory conditions.


Figures

Figure 1.
Figure 1.
Lck, TCRζ, and LAT traffic through distinct exocytic compartments. Jurkat cells were transfected with GFP-tagged Rab3d (A, I, and Q), Rab4b (B, J, and R), Rab8b (C, K, and S), Rab11b (D, L, and T), Rab27a (E, M, and U), Rab37 (F, N, and V), Ti-VAMP (G, O, and W), and MAL (H, P, and X). Cells were then stained for Lck (A–H), LAT (I–P), and TCRζ (R–X). 3D confocal images were post-treated by deconvolution. A 1-µm-thick medial stack is shown. Right panels show a zoomed image of the vesicular compartment (frame). Plots in the far right column depict the population analysis of the co-localization volume between Lck, LAT, and TCRζ and each one of the traffic regulators analyzed for at least 20 cells per group. ***, P ≤ 0.0001; **, P ≤ 0.01; *, P ≤ 0.05; Mann-Whitney test. Images representative of three experiments. Bar, 5 µm.
Figure 2.
Figure 2.
Intracellular calcium increase and Syt7 regulate the release of LAT and TCRζ from their vesicular compartments to the plasma membrane, whereas MAL specifically regulates Lck traffic. (A–G) Primary CD4 T cells were transfected with siRNA against Syt7, a nonrelevant sequence (siCtr), or left untransfected (Med) and then treated with 5 µM thapsigargin (TPS) for 30 min. Cells were stained for LAT (A and B), TGN38 (C), TCRζ (D and E), and Lck (F and G) and analyzed by 3D confocal microscopy. (H–N) Population analysis quantifying the 3D fluorescence intensity in the vesicular compartment (see Materials and methods) relative to total fluorescence of TGN38 (H), LAT (I and J), TCRζ (K and L), and Lck (M and N) of at least 20 cells per group processed as in A–G. (O) Population analysis of n = 20 cells per group quantifying Lck, TCRζ, and LAT localized at the plasma membrane in cells untreated (−), or treated with TPS (+) for 30 min and processed as in A–G. (P) Jurkat cells were transfected with siRNA against MAL or a nonrelevant sequence (siCtr). Cells were stained for LAT (middle), TCRζ (right), and Lck (left) and analyzed by 3D confocal microscopy. (Q) Population analysis of n = 20 cells per group, quantifying Lck, LAT, and TCRζ in the vesicular compartment relative to total cellular fluorescence (see Materials and methods) in MAL-silenced cells (siMAL+) compared with control (siMAL), treated as in P. (R and S) Syt7, MAL, and actin (control) levels in primary CD4 T cells transfected with siRNA control (siCtr), siRNA Syt7 (siSyt7), or siRNA MAL (siMAL). Cell lysates were analyzed by Western blot. Confocal images were post-treated by deconvolution. A 1-µm-thick medial stack is shown. Each dot in plots represents one cell. ***, P ≤ 0.0001; **, P ≤ 0.01; *, P ≤ 0.05; Mann-Whitney test. Images representative of three experiments. Bar, 5 µm.
Figure 3.
Figure 3.
Lck instructs LAT and TCRζ vesicular release at the immunological synapse. (A–D) Primary CD4 T cells were transfected with a siRNA control (siCtr; A and B) or a siRNA MAL (siMAL; C and D) and allowed to form immunological synapses with superantigen-loaded Raji cells for 30 min. Cells were stained for Lck and LAT (A and C) or Lck and TCRζ (B and D), and then analyzed by 3D confocal microscopy. (E–G) Population analysis of at least 20 conjugates per group quantifying the 3D fluorescence at the synapse relative to total cell fluorescence in cells processed in the same way as cells in A–D in the presence (sAg+) or in the absence (sAg) of superantigen. (H) Primary CD4 T cells were transfected with siRNA control (siCtr), siRNA MAL (siMAL), or siRNA Syt7 (siSyt7) and cell lysates were analyzed for MAL, Syt7, and actin expression by Western blot. (I–L) Primary CD4 T cells were transfected with a siRNA control (siCtr; I and J) or a siRNA Syt7 (siSyt7; K and L) and allowed to form immunological synapses with superantigen-loaded Raji cells for 30 min. Cells were stained for Lck and LAT (I and K) or LAT and TCRζ (J and L). (M–O) Population analysis of at least 20 conjugates per group, quantifying the 3D fluorescence at the cell junction relative to total cell fluorescence in cells processed in the same way as cells in I–L and activated in the presence (sAg+) or in absence (sAg) of superantigen and analyzed by 3D confocal microscopy. Confocal images were post-treated by deconvolution and 1 µm-thick medial stack is shown. Synaptic clustering and intracellular compartments are highlighted by arrows and arrowheads, respectively. Each dot in plots represents one conjugate. ***, P ≤ 0.0001; **, P ≤ 0.01; *, P ≤ 0.05; Mann-Whitney test. Images are representative of three experiments. Bar, 5 µm.
Figure 4.
Figure 4.
LAT and TCRζ vesicle fusion at the immunological synapse is required for signal amplification. (A–F) Primary CD4 T cells were transfected with a siRNA control (siCtr; A–C) or a siRNA MAL (siMAL; D–F), and allowed to form conjugates with superantigen-loaded Raji cells for 30 min. Cells were stained for Lck and pLck (A and D), Lck and pLAT (B and E), or TCRζ and pTCRζ (C and F) and analyzed by 3D confocal microscopy. (G–I) Population analysis of primary CD4 T cells transfected with siRNA control (siCtr), or siRNA MAL (siMAL) of pLck (G), pLAT (H) and pTCRζ (I) fluorescence intensity at the immunological synapse of at least 20 conjugates per group. (J–O) Primary CD4 T cells were transfected with a siRNA control (siCtr; J–L) or siRNA Syt7 (siSyt7; M–O) and allowed to form conjugates with superantigen-loaded Raji cells. Cells were stained for Lck and pLck (J and M), Lck and pLAT (K and N), or TCRζ and pTCRζ (L and O) and analyzed by 3D confocal microscopy. (P–R) Population analysis of pLck (P), pLAT (Q), and pTCRζ (R) fluorescence intensity at the synapse of at least 20 conjugates per group, processed as in J–O. Confocal images were post-treated by deconvolution. A 1-µm-thick medial stack is shown. Synaptic clustering and intracellular compartments are highlighted by arrows and arrowheads, respectively. Each dot in plots represents one conjugate. . ***, P ≤ 0.0001; **, P ≤ 0.01; *, P ≤ 0.05; Mann-Whitney test. Images are representative of three experiments. Bar, 5 µm.
Figure 5.
Figure 5.
Effect of MAL-silencing on TCRζ, ZAP70, LAT, and SLP76 phosphorylation levels. (A–E) Primary CD4 T cells were transfected with a siRNA control (siCtr; J–L), or siRNA MAL (siSyt7; M–O) and allowed to form conjugates with superantigen-loaded Raji cells for 30 min. Cells were stained pLck (A), pTCRζ (B), pZAP70 (C), pLAT (D), or pSLP76 (E), and cellular levels were determined by intracellular fluorescence cytometry. Representative of two experiments.
Figure 6.
Figure 6.
Effect of MAL-silencing on TCRζ and ZAP70 recruitment and phosphorylation at the immunological synapse. (A–C) Jurkat cells were transfected with either siCtr (A), or siMAL (B and C) in the absence (A and B) or the presence (C) of thapsigargin and allowed to spread for 3 min on an αCD3-coated coverslips. Cells were stained for pTCRζ and pZAP70 and analyzed by dSTORM-TIRF imaging. Top left insets depict the correspondent zx-stack widefield image projection of GFP-TCRζ. Right panels show a magnified image of a region of interest (frame). pTCRζ, green; pZAP70, red. (D–L) Population analysis in Jurkat cells processed as in A–C (n = 11) of the number of pTCRζ or pZAP70 clusters per square micrometer (D and E), the mean pTCRζ or pZAP cluster area per cell (F and G), the number of pTCRζ or pZAP70 clusters <100 nm for each cell analyzed (H and I), the number of pTCRζ or pZAP70 detections per individual cluster for each cell analyzed (J and K), and the percentage of clusters whose circularity is equal to one. Value is given by the ratio between the largest and the smallest feret diameters for all the clusters detected and plotted as the mean for each analyzed cell (L and M). Images representative of three experiments. ***, P ≤ 0.0001; **, P ≤ 0.01; *, P ≤ 0.05; Mann-Whitney test. Each circle represents a cell. Bar, 10 µm.
Figure 7.
Figure 7.
LAT vesicle fusion determines pLAT and pSLP76 nanoscale organization at the immunological synapse. (A–F) Jurkat cells were transfected with siCtr (A), siSyt7 (B), or siMAL (C and D) in the absence (A–C and E) or presence (D and F) of thapsigargin, and allowed to spread for 3 min on an αCD3- (A–D) or αCD45-coated (E and F) coverslip. Cells were stained for pLAT and pSLP76 and analyzed by dSTORM-TIRF imaging. Top left insets depict the correspondent zx-stack widefield image projection. Right panels show a magnified image of a region of interest (frame). pLAT in green, pSLP76 in red. Images are representative of three experiments. Bar, 10 µm.
Figure 8.
Figure 8.
LAT vesicle fusion determines the number, density, and morphology of pLAT and pSLP76 nanoclusters at the immunological synapse. (A–G) Population analysis of pLAT and pSLP76 clusters in Jurkat cells processed as in Fig. 7. (A) Number of clusters per square micrometer is as follows: siCtr, n = 24; siSyt7, n = 21; siMAL, n = 14; siMAL TPS, n = 11; αCD45, n = 20; and αCD45 TPS, n = 22. (B) Number of clusters per square micrometer is as follows: siCtr, n = 18; siSyt7, n = 21; siMAL, n = 14; siMAL TPS, n = 11; αCD45, n = 19; and αCD45 TPS, n = 22. (C and D) Number of pLAT (C) and pSLP76 (D) detections per individual cluster for each cell analyzed for n ≥ 11 cells. (E) Mean pLAT cluster area per cell, n ≥ 11 cells. (F) Percentage of clusters whose circularity is equal to 1 per cell. Circularity value is given by the ratio between the large and the small feret diameters for all the clusters detected n ≥ 11 cells. (G) Mean area of pLAT clusters per cell according to circularity, measured as in F (n = 24). ***, P ≤ 0.0001; **, P ≤ 0.01; *, P ≤ 0.05; Mann-Whitney test. Each circle represents a cell. Representative of three experiments.
Figure 9.
Figure 9.
Vesicle fusion generates pLAT synaptic clusters at interacting distances from pSLP76 clusters: signaling nanoterritories. (A–F) Jurkat cells were transfected with siCtr (A), siSyt7 (B), or siMAL (C and E) in the absence (A–D), or presence (E and F) of thapsigargin, and allowed to spread for 3 min on an αCD3- (A–C and E) or αCD45-coated (D and F) coverslips. Cells were stained for pLAT and pSLP76 and analyzed by dSTORM-TIRF imaging. Right panels show a magnified image of a region of interest (frame). pLAT, green; pSLP76, red; pLAT and pSLP76 detections that are distant to each other by less than 20 nm (signaling nanoterritories), white. (G–O) Population analysis of pLAT and pSLP76 signaling nanoterritories in Jurkat cells processed as in A–F. (G–H) Mean percentage per cell of the area occupied by signaling nanoterritories with respect to the total pLAT (G) and pSLP76 (H). (G) Number of clusters per square micrometer is as follows: siCtr, n = 24; siSyt7, n = 21; siMAL, n = 14; siMAL TPS, n = 11; αCD45, n = 20; and αCD45 TPS, n = 22. (H) Number of clusters per square micrometer is as follows: siCtr, n = 18; siSyt7, n = 21; siMAL, n = 14; siMAL TPS, n = 11; αCD45, n = 19; and αCD45 TPS, n = 22. (I) Mean percentage per cell of the area occupied by signaling nanoterritories within each individual pLAT cluster n ≥ 11 cells. (J–O) Percentage of the area occupied by signaling nanoterritories with respect to the total pLAT area (as in G) in function of cluster circularity value bracket for n ≥ 11 cells. Images representative of three experiments. ***, P ≤ 0.0001; **, P ≤ 0.01; *, P ≤ 0.05; Mann-Whitney test. Each circle represents a cell. Bar, 10 µm.
Figure 10.
Figure 10.
Syt7 or MAL silencing inhibit T cell activation. Primary CD4 T cells transfected with siRNA Syt7 (siSyt7), siRNA MAL (siMAL), or siRNA control (siCTR) were activated with superantigen-pulsed Raji cells for 10 min (A), 4 h (B), or 16 h (C–G). MAL-silenced cells were antigen-stimulated in the absence (siMAL) or in the presence of thapsigargin (siMAL TPS) or ionomycin (siMAL Iono). Calcium ionophore and phorbol myristate acetate (PMA-iono) were added as positive control (D, F, and G). Cells were analyzed by flow cytometry. (A) Erk activation by CD4 T cells determined by intracellular staining gated on CD4+ cells. (B) Frequency of CD69+CD3+ T cells determined by surface staining. (C–F) IL-2 and IFN-γ production by CD4 T cells was determined by intracellular cytokine staining gated on CD4+ cells. (G) Number of IFN-γ–secreting cells revealed by ELISPOT, each open circle represents an individual experiment. Images representative of three experiments.

References

    1. Acuto O., Di Bartolo V., Michel F. 2008. Tailoring T-cell receptor signals by proximal negative feedback mechanisms. Nat. Rev. Immunol. 8:699–712 10.1038/nri2397 - DOI - PubMed
    1. Alcover A., Thoulouze M.I. 2010. Vesicle traffic to the immunological synapse: a multifunctional process targeted by lymphotropic viruses. Curr. Top. Microbiol. Immunol. 340:191–207 10.1007/978-3-642-03858-7_10 - DOI - PubMed
    1. Antón O., Batista A., Millán J., Andrés-Delgado L., Puertollano R., Correas I., Alonso M.A. 2008. An essential role for the MAL protein in targeting Lck to the plasma membrane of human T lymphocytes. J. Exp. Med. 205:3201–3213 10.1084/jem.20080552 - DOI - PMC - PubMed
    1. Balagopalan L., Barr V.A., Kortum R.L., Park A.K., Samelson L.E. 2013. Cutting edge: cell surface linker for activation of T cells is recruited to microclusters and is active in signaling. J. Immunol. 190:3849–3853 10.4049/jimmunol.1202760 - DOI - PMC - PubMed
    1. Bates M., Huang B., Dempsey G.T., Zhuang X. 2007. Multicolor super-resolution imaging with photo-switchable fluorescent probes. Science. 317:1749–1753 10.1126/science.1146598 - DOI - PMC - PubMed

Publication types

MeSH terms

Substances