. 2013 Oct 21;210(11):2305-20.
doi: 10.1084/jem.20130958. Epub 2013 Oct 7.

Antigen-loaded MR1 tetramers define T cell receptor heterogeneity in mucosal-associated invariant T cells

Affiliations

Antigen-loaded MR1 tetramers define T cell receptor heterogeneity in mucosal-associated invariant T cells

Rangsima Reantragoon et al. J Exp Med. .

Abstract

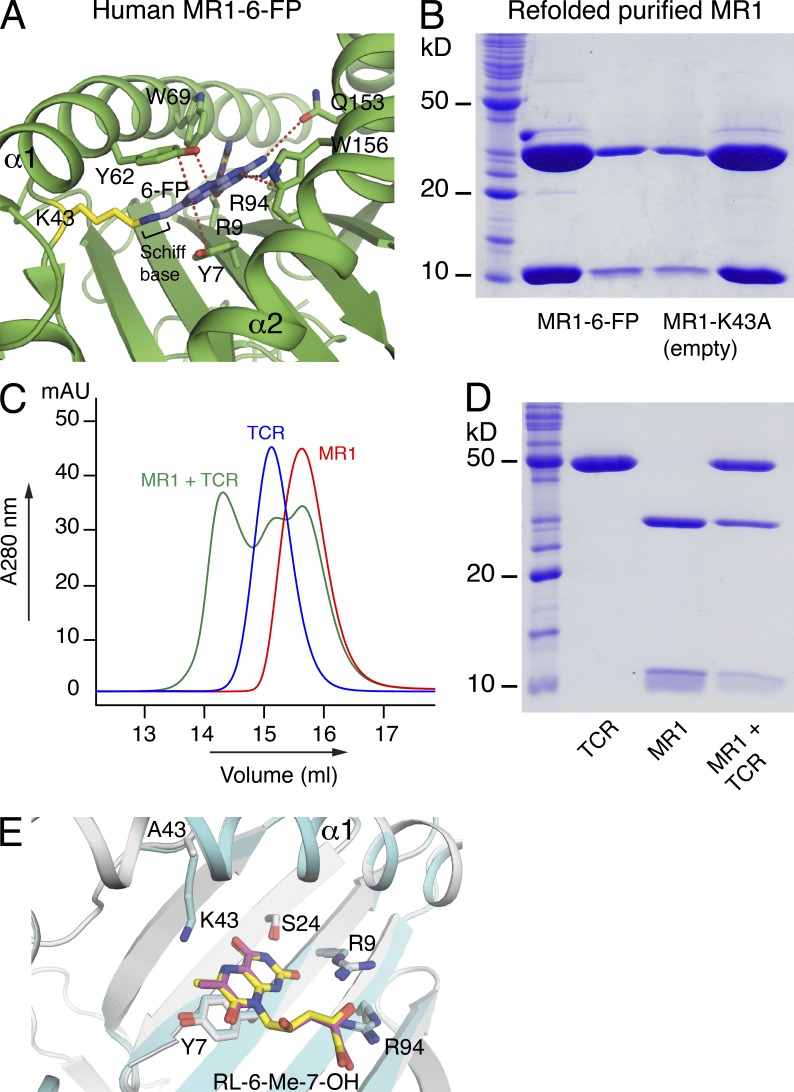
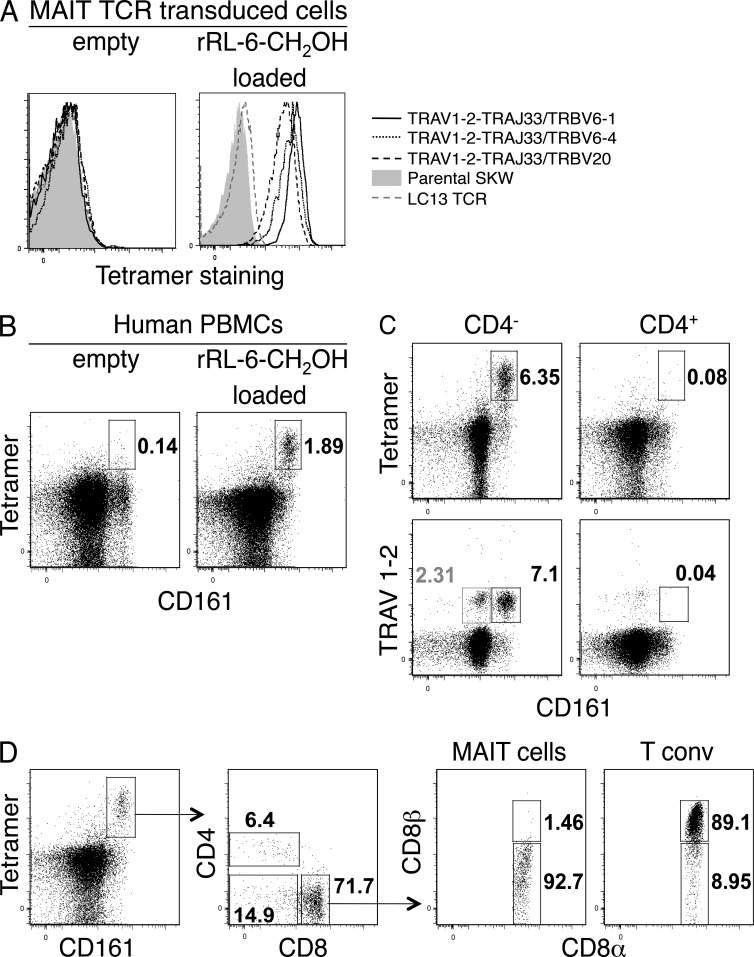
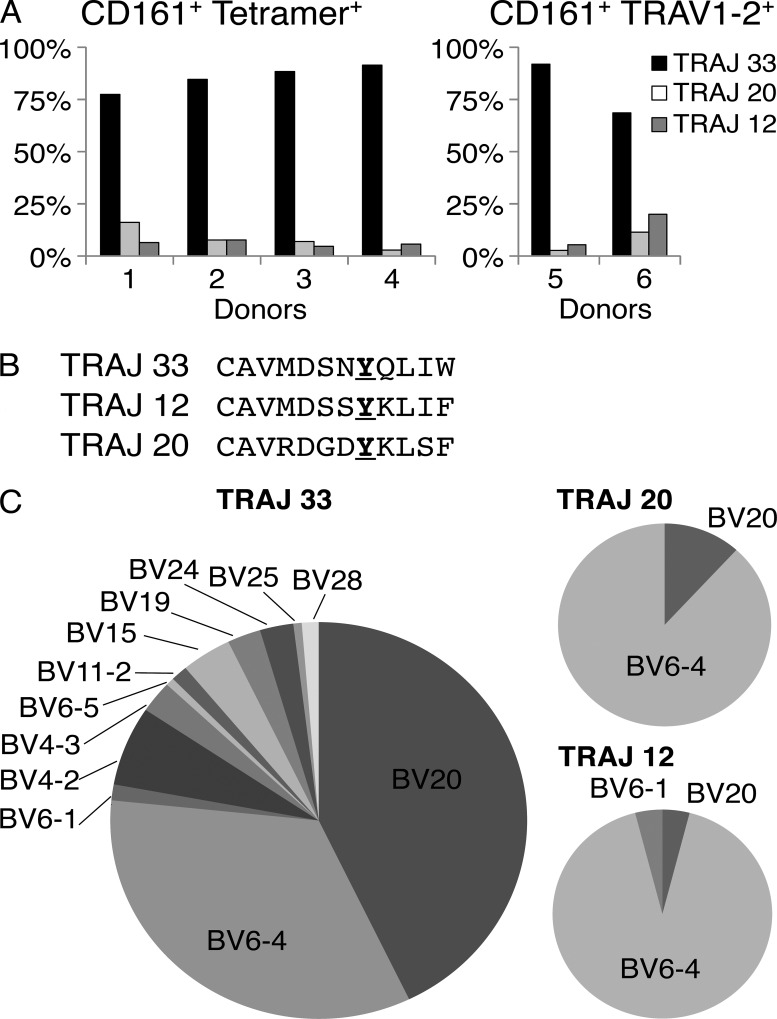
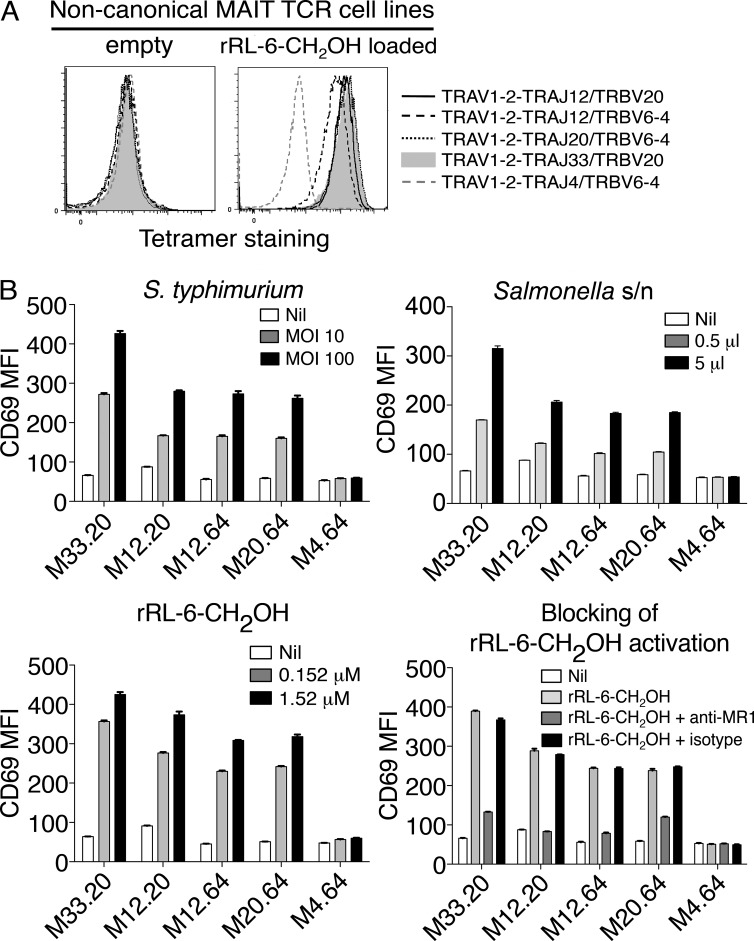
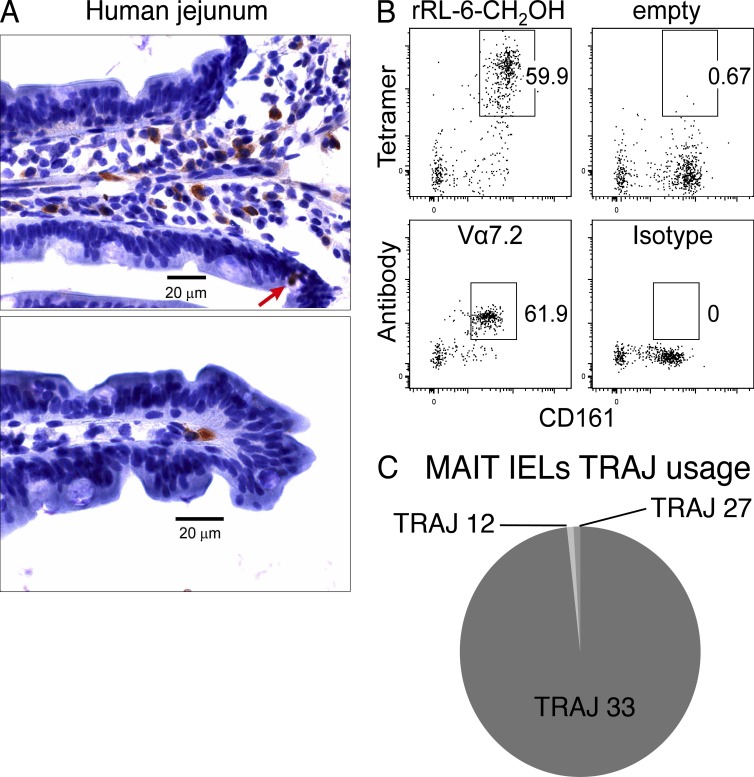
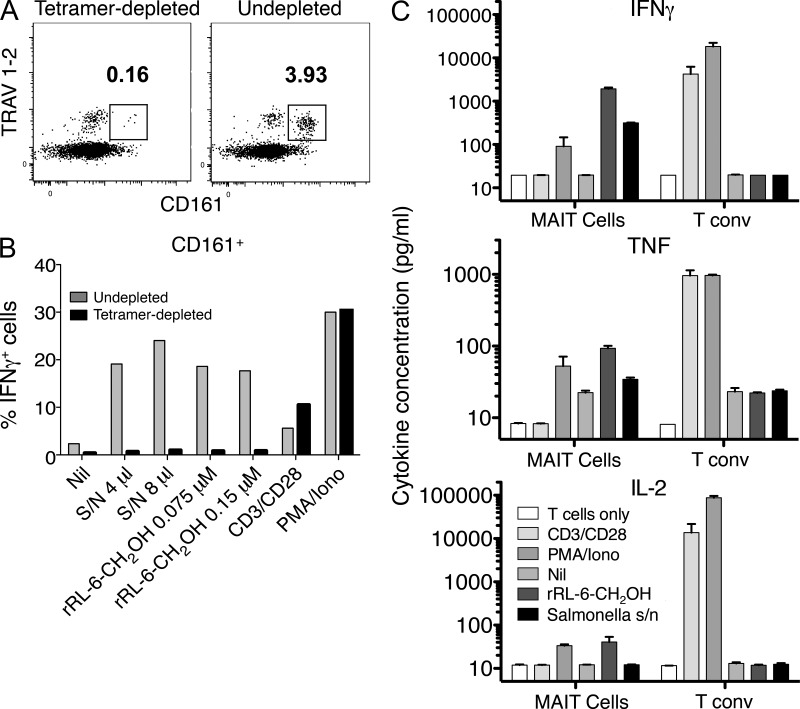
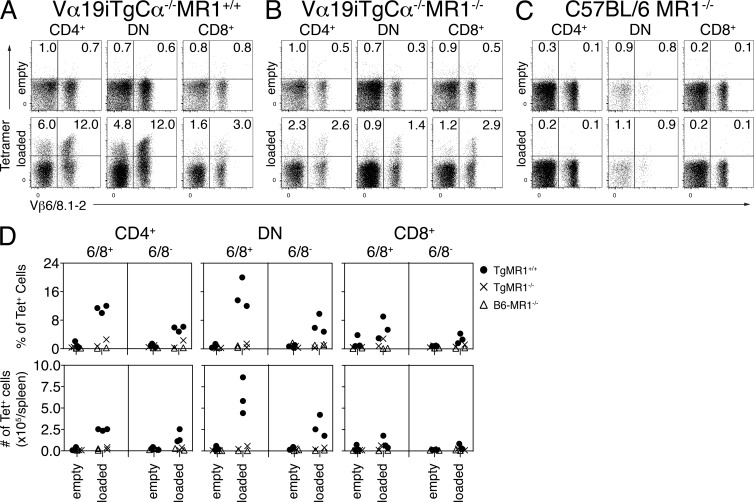
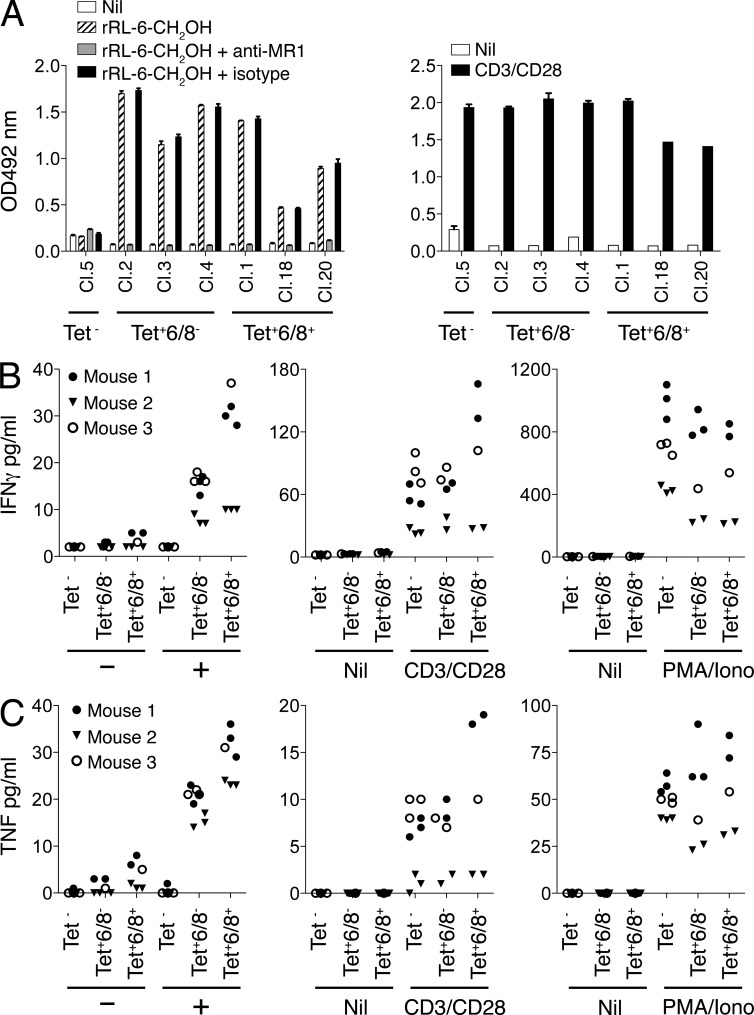
Mucosal-associated invariant T cells (MAIT cells) express a semi-invariant T cell receptor (TCR) α-chain, TRAV1-2-TRAJ33, and are activated by vitamin B metabolites bound by the major histocompatibility complex (MHC)-related class I-like molecule, MR1. Understanding MAIT cell biology has been restrained by the lack of reagents to specifically identify and characterize these cells. Furthermore, the use of surrogate markers may misrepresent the MAIT cell population. We show that modified human MR1 tetramers loaded with the potent MAIT cell ligand, reduced 6-hydroxymethyl-8-D-ribityllumazine (rRL-6-CH₂OH), specifically detect all human MAIT cells. Tetramer(+) MAIT subsets were predominantly CD8(+) or CD4(-)CD8(-), although a small subset of CD4(+) MAIT cells was also detected. Notably, most human CD8(+) MAIT cells were CD8α(+)CD8β(-/lo), implying predominant expression of CD8αα homodimers. Tetramer-sorted MAIT cells displayed a T(H)1 cytokine phenotype upon antigen-specific activation. Similarly, mouse MR1-rRL-6-CH₂OH tetramers detected CD4(+), CD4(-)CD8(-) and CD8(+) MAIT cells in Vα19 transgenic mice. Both human and mouse MAIT cells expressed a broad TCR-β repertoire, and although the majority of human MAIT cells expressed TRAV1-2-TRAJ33, some expressed TRAJ12 or TRAJ20 genes in conjunction with TRAV1-2. Accordingly, MR1 tetramers allow precise phenotypic characterization of human and mouse MAIT cells and revealed unanticipated TCR heterogeneity in this population.


Figures

Figure 1.
Figure 1.
Refolding and subsequent loading of mutant Lys43→Ala MR1 (MR1-K43A) with rRL-6-CH2OH. (A) Structure of wild-type human MR1 (green) with 6-FP (blue) forming a Schiff base with lysine 43 (K43; yellow). Van der Waal contacts (red) and hydrogen bonds (black) are shown (Kjer-Nielsen et al., 2012). (B) 15% SDS-PAGE of graded amounts of refolded and purified wild-type MR1 (MR1–6-FP; refolded with 6-FP), and empty MR1-K43A. Molecular mass markers are indicated in kilodaltons. This experiment was performed three times; shown is a representative experiment. (C) Gel filtration (S200 10/300 GL; GE Healthcare) purification of ternary complex: MR1-K43A (MR1) was loaded with rRL-6-CH2OH and subsequently complexed with soluble MAIT TCR (TCR). Ternary complex (MR1 + TCR) elutes at an earlier retention time than MR1 and MAIT TCR alone. Absorption at 280 nm and volume (ml) are shown on the y and x axis, respectively. (D) 15% SDS-PAGE of the ternary complex of MR1-K43A (loaded with rRL-6-CH2OH) and soluble MAIT TCR (purified by gel filtration as shown in C). Shown are molecular mass markers (in kilodaltons) and MAIT TCR (TCR), MR1-K43A (MR1), and ternary complex (MR1 + TCR) as indicated. (C and D) These experiments were performed twice; shown are representative experiments. (E) Overlay of ternary MR1-K43A–RL-6-Me-7-OH–MAIT TCR complex, with wild-type MR1–RL-6-Me-7-OH–MAIT TCR complex (Patel et al., 2013), viewed down into the Ag-binding cleft. RL-6-Me-7-OH in MR1-K43A–RL-6-Me-7-OH–MAIT TCR complex, yellow; RL-6-Me-7-OH in wild-type MR1–RL-6-Me-7-OH–MAIT TCR complex, magenta; MR1 in MR1-K43A–RL-6-Me-7-OH–MAIT TCR complex, gray; MR1 in wild-type MR1–RL-6-Me-7-OH–MAIT TCR complex, cyan; oxygen, red; nitrogen, blue.
Figure 2.
Figure 2.
Ag-specific identification of human MAIT cells. (A) Direct immunofluorescent staining of SKW3 cells expressing MAIT TCRs: TRAV1-2–TRAJ33 with TRBV6-1, TRBV6-4, or TRBV20, with empty (left) or rRL-6-CH2OH–loaded (right) human MR1 tetramer. Controls include nontransduced SKW3 (Parental SKW) and SKW3-transduced with an irrelevant TCR (LC13 TCR). (B) Human PBMCs were stained with CD3- and CD161-reactive mAbs and human MR1 tetramer. Shown are dot plots of CD3+ cells stained with empty (left) or rRL-6-CH2OH–loaded (right) human MR1 tetramer. Percentages of cells within boxed regions are indicated. Tetramer and CD161 staining are shown on the y and x axis, respectively. (C) Staining of human PBMCs comparing percentages of CD3+CD4 (left) and CD3+CD4+ (right) T cells detected by human MR1-Ag tetramer or TRAV1-2 mAb. Percentages of cells within (black) boxed regions are indicated. Also indicated is the percentage (gray) of CD3+CD4TRAV1-2+CD161lo cells within the gray box (bottom left plot). Tetramer or TRAV1-2 and CD161 staining are shown on the y and x axis, respectively. Experiments in A–C were performed three times with similar results; shown are representative experiments. (D) Coreceptor expression on CD161+tetramer+ MAIT cells. CD3+CD161+tetramer+ cells were stained for cell surface expression of CD4, CD8α, and CD8β. CD8αα (CD8α+CD8β) and CD8αβ (CD8α+CD8β+) expression on CD8+ MAIT cells was subsequently compared with expression on conventional CD8+ T cells (n = 6; shown is a representative staining experiment).
Figure 3.
Figure 3.
Characterization of MR1-Ag tetramer-reactive MAIT cells. (A) Bar graphs showing TRAJ usage of CD3+CD4CD161hitetramer+ cells (all of which expressed TRAV1-2; left, donors 1–4) or CD3+CD4CD161hiTRAV1-2+ cells (stained with the TRAV1-2–specific mAb 3C10; right, donors 5 and 6). Bars represent percentage of total sequences (n = 32 [donor 1], 13 [donor 2], 43 [donor 3], 35 [donor 4], 37 [donor 5], and 35 [donor 6]) obtained from PCR amplification. (B) Alignment of CDR3α regions of TRAV1-2 TCR α-chains containing TRAJ33, TRAJ12, and TRAJ20 segments from CD161+tetramer+ cells. The conserved Tyr95α residue is highlighted in bold and underlined. (C) Pie charts comparing TRBV usage of MAIT cells with TRAV1-2 α-chains containing either TRAJ33 (left), TRAJ20 (top right), or TRAJ12 segments (bottom right; n, total number of paired sequences pooled from donors 1–6, = 154 [TRAJ33], 17 [TRAJ20], and 25 [TRAJ12]).
Figure 4.
Figure 4.
T cells expressing TRAV1-2–TRAJ12 and TRAV1-2–TRAJ20 α-chains reconstitute features of canonical TRAV1-2–TRAJ33 MAIT cells. (A) Direct immunofluorescent staining of SKW3 cells expressing noncanonical MAIT TCRs: TRAV1-2–TRAJ12 with TRBV20 or TRBV6-4 and TRAV1-2–TRAJ20 with TRBV6-4, with empty (left) or human MR1-Ag tetramer (rRL-6-CH2OH loaded; right). Controls include a canonical MAIT TCR comprising TRAV1-2–TRAJ33 and TRBV20 α- and β-chains and a non-MAIT TCR comprising TRAV1-2–TRAJ4 and TRBV6-4 α- and β-chains. This experiment was performed twice with similar results. (B) SKW3 cells expressing noncanonical MAIT TCRs using TRAV1-2 joined with different TRAJs (M33.20, TRAV1-2–TRAJ33 plus TRBV20; M12.20, TRAV1-2–TRAJ12 plus TRBV20; M12.64, TRAV1-2–TRAJ12 plus TRBV6-4; M20.64, TRAV1-2–TRAJ20 plus TRBV6-4; and control non-MAIT TCR M4.64, TRAV1-2–TRAJ4 plus TRBV6-4) were activated by either infection with S. typhimurium (top left) or by addition of S. typhimurium supernatant (s/n; top right), rRL-6-CH2OH (bottom left), or rRL-6-CH2OH in the absence or presence of the anti-MR1 mAb (26.5) or an isotype control mAb (W6/32; bottom right). CD69 mean fluorescence intensity (MFI) is shown on the y axis. The tetramer-staining experiment was performed twice; the S. typhimurium infection, addition of S. typhimurium supernatant, and addition of rRL-6-CH2-OH experiments were performed once, three times, and three times, respectively, with similar results. Error bars show SEM of triplicates. Representative results are shown.
Figure 5.
Figure 5.
In situ localization and TCR repertoire analysis of jejunal MAIT cells. (A) Immunohistochemical staining of MAIT cells in the lamina propria in a human jejunal tissue section. Brown indicates TRAV1-2 (D5 mAb) staining detected with peroxidase-conjugated secondary antibody. The red arrow shows an example of a TRAV1-2+ intraepithelial MAIT cell stained with the D5 mAb. (B) Flow analysis of human IELs prepared from jejunal sections with mAbs against CD3, CD4, and CD161 and either human MR1-Ag tetramer (rRL-6-CH2OH; top left) or empty MR1-tetramer (top right) or TRAV1-2–reactive mAb (Vα7.2; bottom left) or isotype control (bottom right). Tetramer or TRAV1-2 and CD161 staining are shown on the y and x axis, respectively. This staining experiment was performed three times with similar results. (C) Pie chart showing TRAJ usage of MAIT IELs (CD161hiTRAV1-2+). Proportions are calculated from a total of 113 sequences.
Figure 6.
Figure 6.
MR1-Ag tetramer detects all MAIT cells. (A and B) Human PBMCs were depleted of MAIT cells by staining with rRL-6-CH2OH–loaded human MR1 tetramer and subsequent sorting by flow cytometry. Two-dimensional dot plots show analytical staining of a fraction of cells after sorting with TRAV1-2 staining (y axis; using the anti–TRAV1-2–specific mAb D5) versus CD161 staining (x axis) after tetramer depletion (left) or with control undepleted cells (right). Cells subsequently used in the experiment depicted in B were not subjected to prior treatment with mAbs. Undepleted and tetramer-depleted PBMCs were treated with rRL-6-CH2OH or S. typhimurium supernatant (S/N) or had no treatment (Nil) in the presence of C1R.MR1 cells or were treated with anti-CD3/anti-CD28 beads or PMA/ionomycin (Iono). Bar graphs shown are gated on CD3+CD4CD161+ T cells. Bars represent percentage of IFN-γ–producing cells (% IFNγ+ cells). This MAIT tetramer depletion experiment was performed three times; a representative experiment is shown. The experiment was performed in triplicate, and shown are means. (C) Human PBMCs were stained with CD3- and CD161-reactive mAbs, and rRL-6-CH2OH–loaded MR1 tetramer and CD3+CD161hi MR1-Ag tetramer+ cells were then sorted before either no treatment (T cells only) or treatment with anti-CD3/anti-CD28 beads (CD3/CD28) or PMA/ionomycin or were coincubated with C1R.MR1 cells in the absence of treatment (Nil) or with the addition of rRL-6-CH2OH or S. typhimurium supernatant. Production (pg/ml) of IFN-γ, TNF, and IL-2 by MAIT cells or control CD3+CD161 MR1-Ag tetramer T cells (T conv) was measured using a CBA assay. The mean of duplicate samples is shown, with error bars indicating SEM.
Figure 7.
Figure 7.
Detection of mouse MAIT cells in Vα19iMR1+/+ Tg mice. (A–C) Staining of splenic pan T cells from Vα19iTg-Cα−/−MR1+/+ (A), Vα19iTg-Cα−/−MR1−/− (B), and C57BL/6-MR1−/− (C) mice with empty (top) or rRL-6-CH2OH–loaded (bottom) mouse MR1 tetramer in conjunction with mAbs reactive to Vβ6, Vβ8.1, and Vβ8.2. Representative dot plots from one of three experiments show staining of CD4+ (left), CD4CD8 DN (middle), or CD8+ (right) cell populations. Tetramer and Vβ6, Vβ8.1, Vβ8.2 staining is shown on the y and x axis, respectively. (D) Composite data from three separate experiments showing percentages (top row) and absolute numbers (bottom row) of splenocytes from Vα19iTg-Cα−/−MR1+/+ (TgMR1+/+), Vα19iTg-Cα−/−MR1−/− (TgMR1−/−), or C57BL/6-MR1−/− (B6-MR1−/−) mice stained with empty or rRL-6-CH2OH–loaded mouse MR1 tetramer. Shown are staining of CD4+ (left), CD4CD8 DN (middle), or CD8+ (right) splenocytes that were either MR1-Ag+ and Vβ6/Vβ8.1/Vβ8.2+ (6/8+) or Vβ6/Vβ8.1/Vβ8.2 (6/8).
Figure 8.
Figure 8.
Characterization of MR1-Ag tetramer–reactive mouse MAIT cells. (A) Activation of both Vβ6/Vβ8 and Vβ6/Vβ8+ BW5147-MAIT hybridomas by rRL-6-CH2OH. BW5147-MAIT hybridomas, either nonreactive with rRL-6-CH2OH–loaded MR1 tetramer (Tet; Clone 5: Cl.5) or either MR1-Ag tetramer+Vβ6/Vβ8 (Tet+6/8; Cl.2,3,4) or MR1-Ag tetramer+Vβ6/Vβ8+ (Tet+6/8+; Cl.1,18,20) were then (left) coincubated with M12.C3.MR1 cells in the absence (Nil) or presence of 15.2 µM rRL-6-CH2OH or presence of 15.2 µM rRL-6-CH2OH with prior addition of either the MR1-reactive mAb 26.5 (+anti-MR1) or an isotype control mAb, W6/32 (+isotype). Alternatively (right), BW5147-MAIT hybridomas were incubated alone (Nil) or in the presence of CD3- and CD28-reactive mAbs. IL-2 release by BW5147-MAIT hybridomas was measured by the conversion of o-phenylenediamine dihydrochloride by horseradish peroxidase in an indirect ELISA assay, and absorption at 492 nm is shown on the y axis. Results are shown as mean and SEM of triplicates. This experiment was performed three times; shown is a representative experiment. (B and C) Activation of both Vα19iTg+ Vβ6/Vβ8 and Vβ6/Vβ8+ MAIT cells by rRL-6-CH2OH. Mouse splenocytes from three separate Vα19iTg-Cα−/−MR1+ littermates were stained with CD3- and Vβ6/Vβ8-reactive mAbs and rRL-6-CH2OH–loaded MR1 tetramer. Sorted CD3+MR1-Ag tetramer (Tet), CD3+MR1-Ag tetramer+Vβ6/Vβ8 (Tet+6/8), or CD3+MR1-Ag tetramer+Vβ6/Vβ8+ (Tet+6/8+) cells were then coincubated with M12.C3.MR1 cells in the absence (−) or presence (+) of 15.2 µM rRL-6-CH2OH. Sorted T cells were also treated with either CD3- and CD28-reactive mAbs (CD3/CD28) or PMA and ionomycin (PMA/iono) or left untreated (Nil). Production (pg/ml) of IFN-γ (B) and TNF (C) by MAIT cells or control MR1-Ag tetramer–negative T cells was measured using a CBA assay after 24 h. These data are representative of two independent experiments. In this experiment, MAIT cells and T cells were separately sorted from three Vα19iTg-Cα−/−MR1+ littermates (mouse 1, MR1+/+; mouse 2, MR1+/−; mouse 3, MR1+/−), with each symbol representing an individual data point. Depending on numbers of available sorted cells, one to three in vitro replicates per parameter were tested. A similar result was obtained when this experiment was repeated with MAIT and T cells separately sorted from two Vα19iTg-Cα−/−MR1+ littermates.

Similar articles

Cited by

References

    1. Altman J.D., Moss P.A., Goulder P.J., Barouch D.H., McHeyzer-Williams M.G., Bell J.I., McMichael A.J., Davis M.M. 1996. Phenotypic analysis of antigen-specific T lymphocytes. Science. 274:94–96 10.1126/science.274.5284.94 - DOI - PubMed
    1. Benlagha K., Weiss A., Beavis A., Teyton L., Bendelac A. 2000. In vivo identification of glycolipid antigen-specific T cells using fluorescent CD1d tetramers. J. Exp. Med. 191:1895–1903 10.1084/jem.191.11.1895 - DOI - PMC - PubMed
    1. Chiba A., Tajima R., Tomi C., Miyazaki Y., Yamamura T., Miyake S. 2012. Mucosal-associated invariant T cells promote inflammation and exacerbate disease in murine models of arthritis. Arthritis Rheum. 64:153–161 10.1002/art.33314 - DOI - PubMed
    1. Chua W.J., Truscott S.M., Eickhoff C.S., Blazevic A., Hoft D.F., Hansen T.H. 2012. Polyclonal mucosa-associated invariant T cells have unique innate functions in bacterial infection. Infect. Immun. 80:3256–3267 10.1128/IAI.00279-12 - DOI - PMC - PubMed
    1. Cosgrove C., Ussher J.E., Rauch A., Gärtner K., Kurioka A., Hühn M.H., Adelmann K., Kang Y.H., Fergusson J.R., Simmonds P., et al. 2013. Early and nonreversible decrease of CD161++ /MAIT cells in HIV infection. Blood. 121:951–961 10.1182/blood-2012-06-436436 - DOI - PMC - PubMed

Publication types

MeSH terms