

Regulation of p53 is critical for vertebrate limb regeneration
- PMID: 24101460
- PMCID: PMC3808590
- DOI: 10.1073/pnas.1310519110
Regulation of p53 is critical for vertebrate limb regeneration
Abstract
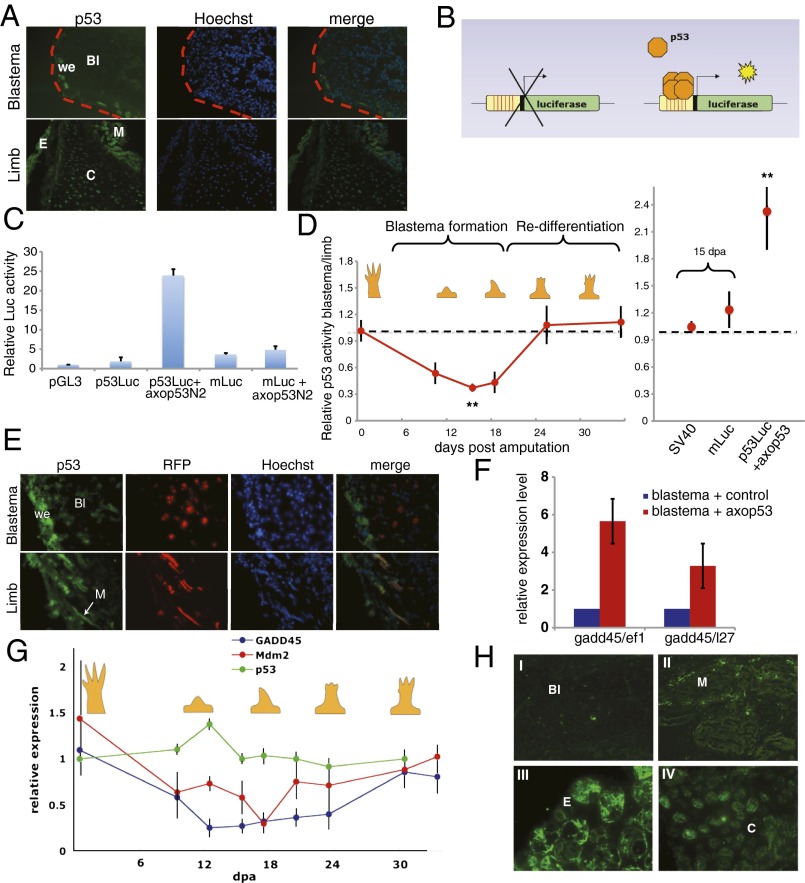
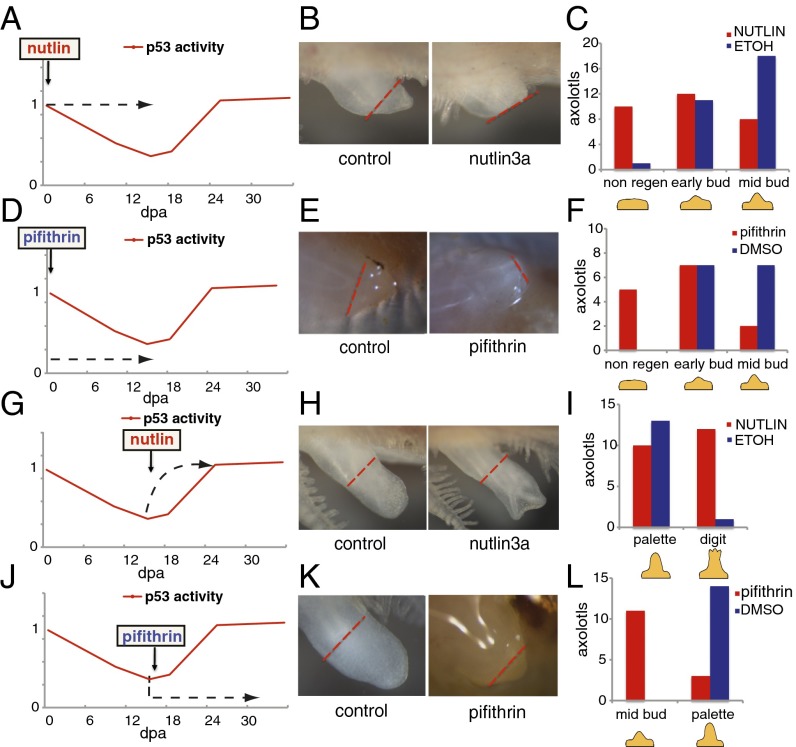
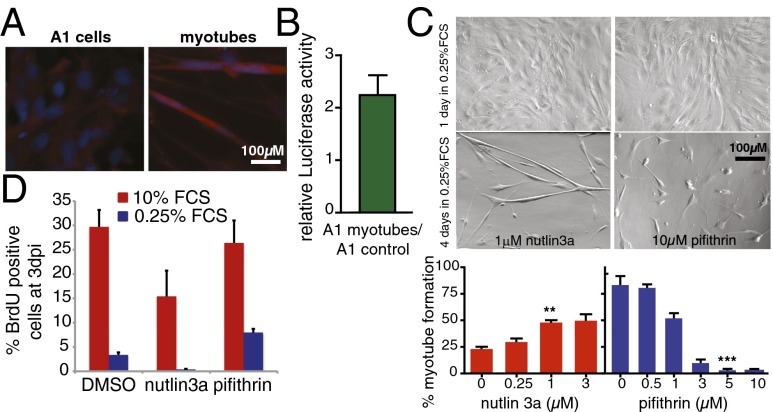
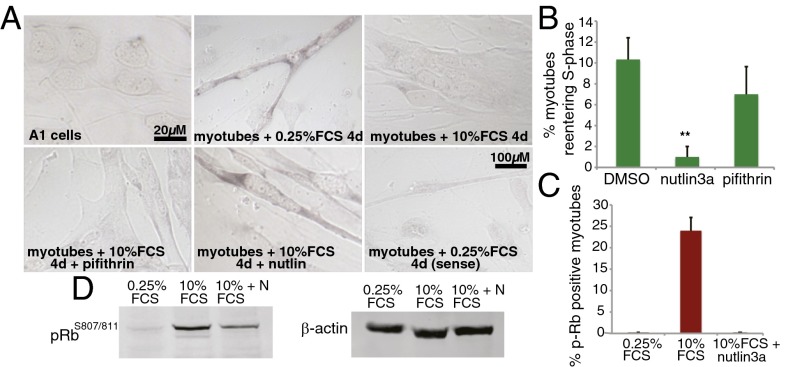
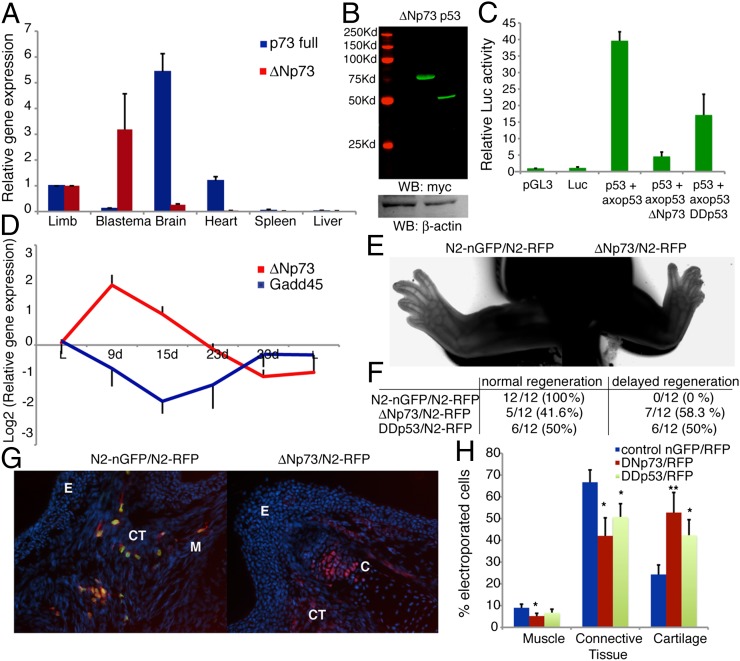
Extensive regeneration of the vertebrate body plan is found in salamander and fish species. In these organisms, regeneration takes place through reprogramming of differentiated cells, proliferation, and subsequent redifferentiation of adult tissues. Such plasticity is rarely found in adult mammalian tissues, and this has been proposed as the basis of their inability to regenerate complex structures. Despite their importance, the mechanisms underlying the regulation of the differentiated state during regeneration remain unclear. Here, we analyzed the role of the tumor-suppressor p53 during salamander limb regeneration. The activity of p53 initially decreases and then returns to baseline. Its down-regulation is required for formation of the blastema, and its up-regulation is necessary for the redifferentiation phase. Importantly, we show that a decrease in the level of p53 activity is critical for cell cycle reentry of postmitotic, differentiated cells, whereas an increase is required for muscle differentiation. In addition, we have uncovered a potential mechanism for the regulation of p53 during limb regeneration, based on its competitive inhibition by ΔNp73. Our results suggest that the regulation of p53 activity is a pivotal mechanism that controls the plasticity of the differentiated state during regeneration.
Keywords: carcinogenesis; chondrogenesis; myogenesis; p73.
Conflict of interest statement
The authors declare no conflict of interest.
Figures
Similar articles
-
Spatiotemporal regulation of keratin 5 and 17 in the axolotl limb.Dev Dyn. 2012 Oct;241(10):1616-24. doi: 10.1002/dvdy.23839. Epub 2012 Aug 24. Dev Dyn. 2012. PMID: 22836940
-
Blastema induction in aneurogenic state and Prrx-1 regulation by MMPs and FGFs in Ambystoma mexicanum limb regeneration.Dev Biol. 2011 Jul 15;355(2):263-74. doi: 10.1016/j.ydbio.2011.04.017. Epub 2011 Apr 22. Dev Biol. 2011. PMID: 21539833
-
Expression of fibroblast growth factors 4, 8, and 10 in limbs, flanks, and blastemas of Ambystoma.Dev Dyn. 2002 Mar;223(2):193-203. doi: 10.1002/dvdy.10049. Dev Dyn. 2002. PMID: 11836784
-
Limb blastema cell: a stem cell for morphological regeneration.Dev Growth Differ. 2010 Jan;52(1):89-99. doi: 10.1111/j.1440-169X.2009.01144.x. Epub 2009 Nov 5. Dev Growth Differ. 2010. PMID: 19891640 Review.
-
An integrative framework for salamander and mouse limb regeneration.Int J Dev Biol. 2018;62(6-7-8):393-402. doi: 10.1387/ijdb.180002jw. Int J Dev Biol. 2018. PMID: 29943379 Review.
Cited by
-
Connective tissue fibroblasts from highly regenerative mammals are refractory to ROS-induced cellular senescence.Nat Commun. 2019 Sep 27;10(1):4400. doi: 10.1038/s41467-019-12398-w. Nat Commun. 2019. PMID: 31562333 Free PMC article.
-
Sustained ERK activation underlies reprogramming in regeneration-competent salamander cells and distinguishes them from their mammalian counterparts.Stem Cell Reports. 2014 Jun 19;3(1):15-23. doi: 10.1016/j.stemcr.2014.05.009. eCollection 2014 Jul 8. Stem Cell Reports. 2014. PMID: 25068118 Free PMC article.
-
Regulation of Genomic Output and (Pluri)potency in Regeneration.Annu Rev Genet. 2019 Dec 3;53:327-346. doi: 10.1146/annurev-genet-112618-043733. Epub 2019 Sep 10. Annu Rev Genet. 2019. PMID: 31505134 Free PMC article. Review.
-
Adaptive homeostasis and the p53 isoform network.EMBO Rep. 2021 Dec 6;22(12):e53085. doi: 10.15252/embr.202153085. Epub 2021 Nov 15. EMBO Rep. 2021. PMID: 34779563 Free PMC article. Review.
-
Identification and requirements of enhancers that direct gene expression during zebrafish fin regeneration.Development. 2020 Jul 30;147(14):dev191262. doi: 10.1242/dev.191262. Development. 2020. PMID: 32665240 Free PMC article.
References
-
- Brockes JP, Kumar A. Comparative aspects of animal regeneration. Annu Rev Cell Dev Biol. 2008;24:525–549. - PubMed
-
- Brockes JP, Kumar A. Plasticity and reprogramming of differentiated cells in amphibian regeneration. Nat Rev Mol Cell Biol. 2002;3(8):566–574. - PubMed
-
- Kragl M, et al. Cells keep a memory of their tissue origin during axolotl limb regeneration. Nature. 2009;460(7251):60–65. - PubMed
-
- Hay ED, Fischman DA. Origin of the blastema in regenerating limbs of the newt Triturus viridescens. An autoradiographic study using tritiated thymidine to follow cell proliferation and migration. Dev Biol. 1961;3:26–59. - PubMed
Publication types
MeSH terms
Substances
Grants and funding
LinkOut - more resources
Full Text Sources
Other Literature Sources
Research Materials
Miscellaneous
