. 2013 Oct 22;110(43):17588-93.
doi: 10.1073/pnas.1310644110. Epub 2013 Oct 7.

CDC5, a DNA binding protein, positively regulates posttranscriptional processing and/or transcription of primary microRNA transcripts

Affiliations

CDC5, a DNA binding protein, positively regulates posttranscriptional processing and/or transcription of primary microRNA transcripts

Shuxin Zhang et al. Proc Natl Acad Sci U S A. .

Abstract

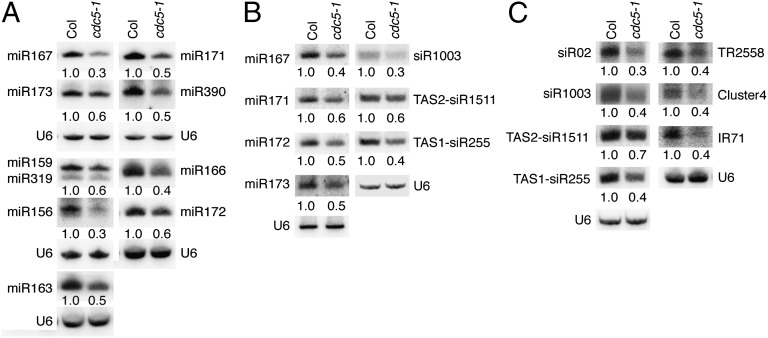
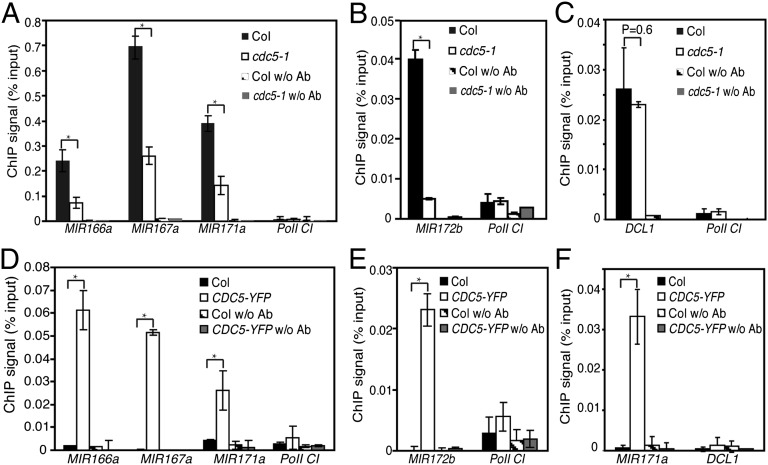
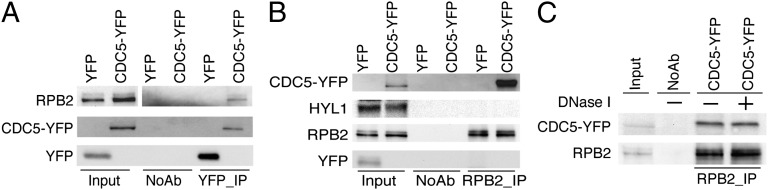
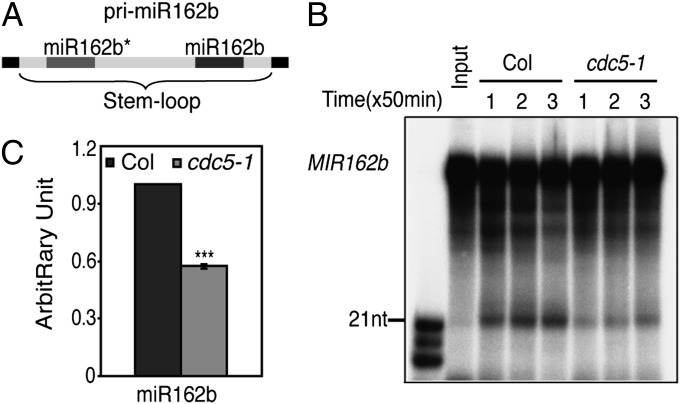
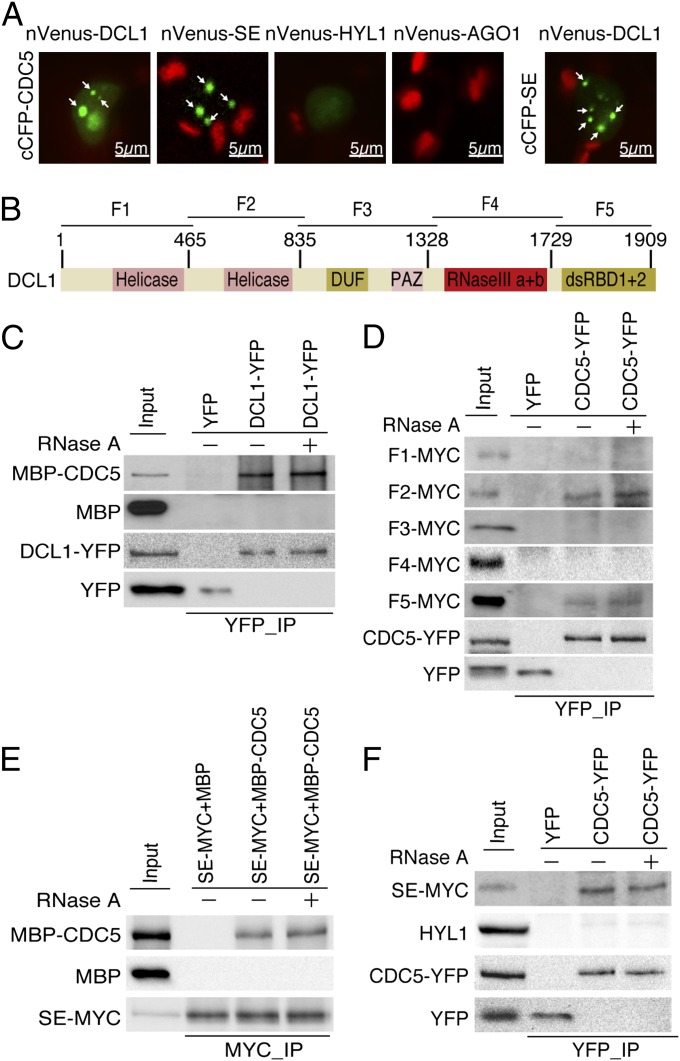
CDC5 is a MYB-related protein that exists in plants, animals, and fungi. In Arabidopsis, CDC5 regulates both growth and immunity through unknown mechanisms. Here, we show that CDC5 from Arabidopsis positively regulates the accumulation of microRNAs (miRNAs), which control many biological processes including development and adaptations to environments in plants. CDC5 interacts with both the promoters of genes encoding miRNAs (MIR) and the DNA-dependent RNA polymerase II. As a consequence, lack of CDC5 reduces the occupancy of polymerase II at MIR promoters, as well as MIR promoter activities. In addition, CDC5 is associated with the DICER-LIKE1 complex, which generates miRNAs from their primary transcripts and is required for efficient miRNA production. These results suggest that CDC5 may have dual roles in miRNA biogenesis: functioning as a positive transcription factor of MIR and/or acting as a component of the DICER-LIKE1 complex to enhance primary miRNA processing.


Conflict of interest statement

The authors declare no conflict of interest.

Figures

Fig. 1.
Fig. 1.
cdc5-1 reduces the accumulation of miRNAs and siRNAs. (A) miRNA abundance in inflorescences of cdc5-1 and Col. (B) miRNA abundance in leaves of cdc5-1 and Col. (C) siRNA abundance in inflorescences cdc5-1 and Col. Col: wild-type control of cdc5-1. U6: spliceosomal RNA U6. Small RNAs were detected by Northern blot. After Northern blot, the radioactive signals were detected with phosphor imager and quantified with ImageQuant (V5.2). To determine relative abundance of small RNAs in cdc5-1, the amount of a miRNA or siRNA in cdc5-1 was normalized to U6 RNA and compared with that in Col. Value of miRNAs or siRNAs in Col was set as 1. The number below cdc5-1 indicated the relative abundance of miRNAs or siRNAs, which is the average value of three repeats. P < 0.05; except for siR255 in Fig. 1C (t test). For miR159/319, the upper band was miR159 and the lower band was miR319.
Fig. 2.
Fig. 2.
cdc5-1 reduces the promoter activity of MIR. (A) The transcript levels of various pri-miRNAs in inflorescences of cdc5-1 and Col determined by qRT-PCR. The abundance of pri-miRNAs in cdc5-1 was normalized to that of UBQUITIN5 (UBQ5) and compared with that in Col. Value of Col was set to 1. SD of three technical replications was shown as error bars. (B) The levels of GUS in CDC5+ and cdc5-1 harboring pMIR172b::GUS. CDC5+:CDC5/CDC5, or CDC5/cdc5-1. Twenty plants containing GUS were analyzed for each of CDC5+ and cdc5-1 genotypes. An image for each genotype is shown. (C) The transcript levels of GUS driven by MIR172b promoter in CDC5+ and cdc5-1. GUS transcript levels were determined by qRT-PCR. The GUS mRNA levels in cdc5-1 were normalized to UBQ5 and compared with those in CDC5+. *P < 0.05, **P < 0.01, and ***P < 0.001 (t test).
Fig. 3.
Fig. 3.
CDC5 is required for the recruitment of Pol II to MIR promoters. (A–C) The occupancy of Pol II at various promoters detected by ChIP using anti-RBP2 antibody in cdc5-1 and Col. (D–F) The association of CDC5 with various promoters detected by ChIP using anti-YFP antibody in plants containing pCDC5::CDC5-YFP. DNA copurified with CDC5 or Pol II was analyzed with qRT-PCR. The intergenic region between At2g17470 and At2g17460 (Pol II C1) that is not occupied by Pol II was used as a negative control. ChIP with no antibodies was performed as another control. Means and standard derivations of three technical repeats are presented, and three biological replicates gave similar results. Please note that the results of Pol II C1 in RBP2 ChIP (A and B) and in CDC5 ChIP (D and E) were showed twice, respectively, for control purposes. *P < 0.05 (t test).
Fig. 4.
Fig. 4.
CDC5 interacts with Pol II. (A and B) Co-IP between CDC5–YFP and Pol II. (C) Co-IP between CDC5–YFP and Pol II is DNA-independent. Protein extracts isolated from inflorescences of plants containing CDC5–YFP or YFP were used to perform IP, using either Anti-YFP or Anti-RBP2. YFP, CDC5–YFP, and RBP2 were detected by Western blot, using anti-YFP antibody and anti-RPB2, respectively, and labeled on the left side of the picture. Two percent of input proteins were used for RPB2, whereas 20% input proteins were used for YFP and DCL1–YFP, respectively.
Fig. 5.
Fig. 5.
cdc5-1 reduces the accumulation of miR162 in an in vitro processing assay. (A) Schematic diagram of the pri-miR162b fragment (MIR162b) used in the in vitro processing assay. (B) MIR162b processing by protein extracts from cdc5-1 and Col. After reaction, RNAs were extracted, resolved on PAGE gel, and detected with a phosphor imager. (C) Quantification of miR162 production in cdc5-1 relative to Col. The quantitative analysis was performed for the reaction stopped at 100 min, as shown in B. The radioactive signal of miR162 was quantified with ImageQuant (V5.2) and then normalized to input to determine the amount of miR162 produced by cdc5-1 or Col protein extracts (miR162cdc5-1 or miR162Col). The relative level of miR162 produced by cdc5-1 was calculated as miR162cdc5-1 divided by miR162Col. The value of miR162Col was set as 1. The value represents mean of three repeats. ***P < 0.001 (t test).
Fig. 6.
Fig. 6.
CDC5 interacts with the DCL1 complex. (A) BiFC analysis of CDC5 with DCL1, SE, HYL1, and AGO1. Respective pairs of cCFP (cCFP–CDC5, cCFP–SE) and nVenus (nVenus–DCL1, nVenus–HYL1, nVenus–SE, and nVenus–AGO1) fused proteins were coinfiltrated into N. benthamiana leaves. Yellow fluorescence (green in image) signals were examined at 48 h after infiltration by confocal microscopy. Arrow indicates the BiFC signal. The red spot was inflorescence from chlorophyll. Thirty nuclei were examined for each pair, and an image is shown. (B) Schematic diagram of DCL1 domains and truncated DCL1 fragments used for protein interaction assay. (C) Coimmunoprecipitation between CDC5 and DCL1. The protein pairs in the protein extracts were indicated by the labels on the left side of and on top of the picture. DCL1–YFP/YFP and MBP–CDC5/MBP were detected by Western blot, using anti-YFP and anti-MBP, respectively, and labeled on the left side of the picture. One percent input protein was used for MBP–CDC5 and MBP. Twenty percent input proteins were used for DCL1–YFP and YFP. (D) Coimmunoprecipitation between CDC5 with the helicase and dsRNA binding domains of DCL1. Truncated DCL1 proteins fused with a MYC tag at their N terminus were expressed in N. benthamiana leaves. The protein pairs in the protein extracts were indicated by the labels on the left side of and on top of the picture. Anti-MYC antibody was used to detect MYC fusion proteins in Western blots. Labels on the left side of picture indicate proteins detected by Western blot. Five percent input proteins were used for MYC tagged proteins, whereas 20% inputs were used for DCL1–YFP and YFP. Please note only one IP picture was shown for CDC5–YFP and YFP, respectively. (E and F) Coimmunoprecipitation between CDC5 and SERRATE (SE). The protein pairs in the protein extracts were indicated by the labels on the left side of and on top of the picture. Proteins detected by Western blot were indicated on the left side of the picture. Two percent of input proteins were used for SE–MYC. Twenty percent inputs proteins were used for MBP and YFP tagged proteins.

References

    1. Bartel DP. MicroRNAs: Genomics, biogenesis, mechanism, and function. Cell. 2004;116(2):281–297. - PubMed
    1. Chen X. MicroRNA biogenesis and function in plants. FEBS Lett. 2005;579(26):5923–5931. - PMC - PubMed
    1. Voinnet O. Origin, biogenesis, and activity of plant microRNAs. Cell. 2009;136(4):669–687. - PubMed
    1. Vazquez F. Arabidopsis endogenous small RNAs: Highways and byways. Trends Plant Sci. 2006;11(9):460–468. - PubMed
    1. Brodersen P, Voinnet O. The diversity of RNA silencing pathways in plants. Trends Genet. 2006;22(5):268–280. - PubMed

Publication types

MeSH terms