. 2013 Oct 22;110(43):17253-8.
doi: 10.1073/pnas.1308887110. Epub 2013 Oct 7.

Modulation of macrophage phenotype by cell shape

Affiliations

Modulation of macrophage phenotype by cell shape

Frances Y McWhorter et al. Proc Natl Acad Sci U S A. .

Abstract

Phenotypic polarization of macrophages is regulated by a milieu of cues in the local tissue microenvironment. Although much is known about how soluble factors influence macrophage polarization, relatively little is known about how physical cues present in the extracellular environment might modulate proinflammatory (M1) vs. prohealing (M2) activation. Specifically, the role of cell shape has not been explored, even though it has been observed that macrophages adopt different geometries in vivo. We and others observed that macrophages polarized toward different phenotypes in vitro exhibit dramatic changes in cell shape: M2 cells exhibit an elongated shape compared with M1 cells. Using a micropatterning approach to control macrophage cell shape directly, we demonstrate here that elongation itself, without exogenous cytokines, leads to the expression of M2 phenotype markers and reduces the secretion of inflammatory cytokines. Moreover, elongation enhances the effects of M2-inducing cytokines IL-4 and IL-13 and protects cells from M1-inducing stimuli LPS and IFN-γ. In addition shape- but not cytokine-induced polarization is abrogated when actin and actin/myosin contractility are inhibited by pharmacological agents, suggesting a role for the cytoskeleton in the control of macrophage polarization by cell geometry. Our studies demonstrate that alterations in cell shape associated with changes in ECM architecture may provide integral cues to modulate macrophage phenotype polarization.


Conflict of interest statement

The authors declare no conflict of interest.

Figures

Fig. 1.
Fig. 1.
Polarization of macrophages toward an M2 phenotype is associated with an elongated cell shape. (A) Phase contrast images of BMDMs left untreated (Left) or treated with LPS/IFN-γ (Center) or IL-4/IL-13 (Right). (Scale bar: 50 μm.) (B) Quantification of elongation, or length of the long axis divided by length of the short axis, for control, LPS/IFN-γ–treated, and IL-4/IL-13–treated cells. (C) Quantification of area for control, LPS/IFN-γ–treated, and IL-4/IL-13–treated cells. (D) Fluorescence images of cells immunostained for iNOS (green) and arginase-1 (red) and Hoechst nuclear counterstain (blue) of control, LPS/IFN-γ–treated, and IL-4/IL-13–treated cells. (Scale bar: 50 μm.) (E) Representative Western blot of iNOS, arginase-1, and α-tubulin of control, LPS/IFN-γ–treated, and IL-4/IL-13–treated cells and quantification of average across three separate experiments. (F) Representative Western blot of arginase-1 and α-tubulin in response to different dosages of IL-4/IL-13 and quantification of average across three separate experiments. (G) Quantification of cell elongation for macrophages treated with different IL-4/IL-13 dosages. Error bars indicate the SEM for three separate experiments. *P < 0.05 compared with control cells as determined by the Student t test. ns, not significantly different.
Fig. 2.
Fig. 2.
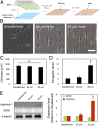
Elongation of cells by micropatterning drives macrophage polarization. (A) Schematic of method used to micropattern cells by microcontact printing of arrays of fibronectin lines of various widths. (B) Phase contrast images of unpatterned cells and cells patterned on 50-μm and 20-μm wide lines. (Scale bar: 50 μm.) (C) Quantification of cell area of unpatterned cells and cells patterned on 50-μm and 20-μm wide lines. (D) Quantification of elongation factor of unpatterned cells and cells patterned on 50-μm and 20-μm wide lines. (E) Representative Western blot of iNOS, arginase-1, and α-tubulin of unpatterned and patterned cells and quantification across three separate experiments. Error bars indicate the SEM for three separate experiments.*P < 0.05 compared with unpatterned cells as determined by the Student t test. ns, not significantly different.
Fig. 3.
Fig. 3.
Macrophage elongation up-regulates markers of M2 polarization and reduces secretion of proinflammatory cytokines. Representative flow cytometry histograms (Left) and averaged relative mean fluorescence intensity (MFI) across three separate experiments (Right) of arginase-1 (A), CD206 (B), and YM-1 (C) for unpatterned cells and cells patterned on 20-μm wide lines and for cells treated with IL-4/IL-13. (D) Graph of secreted levels of indicated cytokines for patterned cells relative to unpatterned cells. Error bars indicate the SEM for three separate experiments. *P < 0.05 compared with unpatterned cells as determined by the Student t test. CCL5, chemokine (C-C motif) ligand 5; CXCL, chemokine (C-X-C motif) ligand IP-10, interferon gamma-induced protein 10; MCP, monocyte chemotactic protein; M-CSF, macrophage-CSF; TIMP-1, TIMP metallopeptidase inhibitor 1.
Fig. 4.
Fig. 4.
Shape and cytokines synergize to modulate macrophage polarization. (A) Representative Western blot of arginase-1 and α-tubulin in unpatterned (UP) cells and cells patterned (Pat) on 20-μm wide lines treated with the indicated concentration of IL-4 and IL-13 (Left) and quantification of average across three separate experiments (Right). (B) Representative Western blot of iNOS and α-tubulin in unpatterned cells and cells patterned on 20-μm wide lines treated with the indicated concentration of IFN-γ and LPS (Left) and quantification of average across three separate experiments (Right). Error bars indicate the SEM for three separate experiments. *P < 0.05 compared with unpatterned cells treated with the same dose of cytokines as determined by the Student t test.
Fig. 5.
Fig. 5.
Cytoskeletal contractility is required for shape-induced M2 polarization. (A and B) Fluorescence images of phalloidin-labeled unpatterned cells and cells patterned on 20-μm wide lines treated with the indicated pharmacological agents or soluble stimuli. (Scale bar: 50 μm.) Quantification of cell area (C) and quantification of cell elongation (D) of cells shown in A and B. (E) Relative arginase-1 expression of cells shown in A and B, as measured by immunofluorescence cytometry. Error bars indicate the SEM for three separate experiments. *P < 0.05 compared with unpatterned cells treated with the same drug as determined by the Student t test. Bleb, blebbistatin; CytoD, cytochalasin D.

References

    1. Mosser DM, Edwards JP. Exploring the full spectrum of macrophage activation. Nat Rev Immunol. 2008;8(12):958–969. - PMC - PubMed
    1. Lucas T, et al. Differential roles of macrophages in diverse phases of skin repair. J Immunol. 2010;184(7):3964–3977. - PubMed
    1. Daley JM, et al. Modulation of macrophage phenotype by soluble product(s) released from neutrophils. J Immunol. 2005;174(4):2265–2272. - PubMed
    1. Van Goethem E, Poincloux R, Gauffre F, Maridonneau-Parini I, Le Cabec V. Matrix architecture dictates three-dimensional migration modes of human macrophages: Differential involvement of proteases and podosome-like structures. J Immunol. 2010;184(2):1049–1061. - PubMed
    1. Chinetti-Gbaguidi G, et al. Human atherosclerotic plaque alternative macrophages display low cholesterol handling but high phagocytosis because of distinct activities of the PPARγ and LXRα pathways. Circ Res. 2011;108(8):985–995. - PMC - PubMed

Publication types

MeSH terms

Substances