Vegetation controls on the maximum size of coastal dunes
- PMID: 24101481
- PMCID: PMC3808624
- DOI: 10.1073/pnas.1307580110
Vegetation controls on the maximum size of coastal dunes
Abstract
Coastal dunes, in particular foredunes, support a resilient ecosystem and reduce coastal vulnerability to storms. In contrast to dry desert dunes, coastal dunes arise from interactions between biological and physical processes. Ecologists have traditionally addressed coastal ecosystems by assuming that they adapt to preexisting dune topography, whereas geomorphologists have studied the properties of foredunes primarily in connection to physical, not biological, factors. Here, we study foredune development using an ecomorphodynamic model that resolves the coevolution of topography and vegetation in response to both physical and ecological factors. We find that foredune growth is eventually limited by a negative feedback between wind flow and topography. As a consequence, steady-state foredunes are scale invariant, which allows us to derive scaling relations for maximum foredune height and formation time. These relations suggest that plant zonation (in particular for strand "dune-building" species) is the primary factor controlling the maximum size of foredunes and therefore the amount of sand stored in a coastal dune system. We also find that aeolian sand supply to the dunes determines the timescale of foredune formation. These results offer a potential explanation for the empirical relation between beach type and foredune size, in which large (small) foredunes are found on dissipative (reflective) beaches. Higher waves associated with dissipative beaches increase the disturbance of strand species, which shifts foredune formation landward and thus leads to larger foredunes. In this scenario, plants play a much more active role in modifying their habitat and altering coastal vulnerability than previously thought.
Keywords: dune stabilization; ecomorphodynamic modeling; sediment budget.
Conflict of interest statement
The authors declare no conflict of interest.
Figures

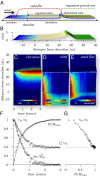
 and undisturbed wind shear stress
  , where
  is the threshold shear stress for dry sand (vegetation cover fraction is green). (C) Evolution of the central cross-shore slice of the foredune elevation, (D) wind shear stress, and (E) sand flux. (F) Evolution of the foredune height H rescaled by the maximum height
  , the computed wind shear stress at the shoreline
  rescaled by the undisturbed shear stress over a flat bed
  and the computed sand flux into the foredune
  rescaled by the saturated (maximum) flux
  over a flat bed
  . Solid lines correspond to exponential fits with constant relaxation time. (G) Proportionality between the rescaled wind shear stress at the shoreline
  and the rescaled foredune height
  . The dashed line is the rescaled transport threshold for dry sand
  . For a realistic timescale it is assumed transport only takes place 20% of the time.
 , and vegetation limits
  . (Inset) Rescaled profiles. (B) Evolution of foredune height for different vegetation limits and
  . (Inset) Rescaled evolution curves;
  and
and  are given by Eqs. 2 and 3.
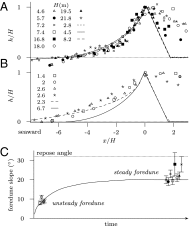
 (39)
(39)  (1), Canada (×) (40), Florida
 (41), and Netherlands
  (17). (B) Incipient foredunes: simulation (dashed line) and measurements from Australia
  (2) and Netherlands
  (17, 42). A simulated mature foredune is shown for comparison (solid line). Notice that the model underestimates the downwind dune profile as it simulates sand transport via saltation and neglects suspended sand transport, which can be significant (and occur above the vegetation canopy) during storms (42). (C) Evolution of the characteristic slope of a simulated dune, defined as
  (solid line). Superimposed symbols: slopes of measured mature (steady) and incipient (unsteady) foredunes, from A and B, respectively. Sand repose (avalanche) angle is shown for comparison (dotted line). All simulations were performed for
  . For simplicity the origin of the x coordinate is set at the foredune crest.
 (17): rescaled profile (dashed line), vegetation cover (gray areas), and sand flux q rescaled by its maximum value at the beach
  (the scattering is due to different wind velocities). Solid lines: simulation for
  and
and  . Flux reduction in nonvegetated areas is due to flow–form interaction; closer to the crest is due to vegetation.
 for beaches in Australia (
 , modified from ref. 2), Oregon (
 , ref. 21), and Brazil (
 , ref. 45). The solid line corresponds to the model prediction for a wind
  and assuming plant zonation increases linearly with wave height as
  , with a fit parameter
  .
.
 for a vegetation growth rate
  , down from 0.3 m/d in previous simulations): (A) spontaneous nucleation of a transgressive dune field in the absence of vegetation (46); (B) stable foredune for a narrow plant zonation; (C) unstable foredune, followed by blowouts, parabolic and crescent dunes, for an intermediate plant zonation; and (D) unstable foredunes and formation of a transgressive dune field for a wide zonation. (E) Evolution of the total volume per unit area deposited by aeolian transport for different vegetation limits. (Inset) Rescaled volume per unit area. For a realistic timescale it is assumed transport takes place 20% of the time.
References
-
- Short AD, Hesp PA. Wave, beach and dune interactions in southeastern Australia. Mar Geol. 1982;48:259–284.
-
- Hesp P. Surfzone, beach, and foredune interactions on the Australian South East Coast. J Coast Res. 1988;(Special issue 3):15–23.
-
- Hesp PA. Foredunes and blowouts: Initiation, geomorphology and dynamics. Geomorphology. 2002;48(1-3):245–268.
-
- Psuty N. The coastal foredune: A morphological basis for regional coastal dune development. In: Martínez ML, Psuty NP, editors. Coastal Dunes. Vol 171. Berlin: Springer; 2008. pp. 11–27.
-
- Oosting H. Tolerance to salt spray of plants of coastal dunes. Ecology. 1945;26:85–89.
Publication types
MeSH terms
Substances
LinkOut - more resources
Full Text Sources
Other Literature Sources
Research Materials

