. 2013 Oct 22;110(43):E4108-17.
doi: 10.1073/pnas.1317019110. Epub 2013 Oct 7.

Network model of top-down influences on local gain and contextual interactions in visual cortex

Affiliations

Network model of top-down influences on local gain and contextual interactions in visual cortex

Valentin Piëch et al. Proc Natl Acad Sci U S A. .

Abstract

The visual system uses continuity as a cue for grouping oriented line segments that define object boundaries in complex visual scenes. Many studies support the idea that long-range intrinsic horizontal connections in early visual cortex contribute to this grouping. Top-down influences in primary visual cortex (V1) play an important role in the processes of contour integration and perceptual saliency, with contour-related responses being task dependent. This suggests an interaction between recurrent inputs to V1 and intrinsic connections within V1 that enables V1 neurons to respond differently under different conditions. We created a network model that simulates parametrically the control of local gain by hypothetical top-down modification of local recurrence. These local gain changes, as a consequence of network dynamics in our model, enable modulation of contextual interactions in a task-dependent manner. Our model displays contour-related facilitation of neuronal responses and differential foreground vs. background responses over the neuronal ensemble, accounting for the perceptual pop-out of salient contours. It quantitatively reproduces the results of single-unit recording experiments in V1, highlighting salient contours and replicating the time course of contextual influences. We show by means of phase-plane analysis that the model operates stably even in the presence of large inputs. Our model shows how a simple form of top-down modulation of the effective connectivity of intrinsic cortical connections among biophysically realistic neurons can account for some of the response changes seen in perceptual learning and task switching.

Keywords: feedback; gating; long-range horizontal connections; reentrant.


Conflict of interest statement

The authors declare no conflict of interest.

Figures

Fig. 1.
Fig. 1.
Schematic of network circuit and long-range connectivity. (A) Local circuit consisting of an excitatory (+) and a subtractive or divisive inhibitory (−) network node. The circles indicate excitatory connections; bars, inhibitory. Conductances gxx, etc., are replaced by connection strengths, Jxx, respectively, in the current-based models. FBgain and FBset point are alternative parameterizations of the connection strengths as discussed in the text. FBgain changes gxx and gxy proportionally, whereas FBset point changes the ratio between gxx and gxy. (B) Local circuit with long-range horizontal connections. The local excitatory network node connects to other excitatory network nodes at different spatial positions with connection strength Lxx, and to other inhibitory nodes with connection strength Lyx. The connection patterns of Lxx and Lyx can be seen in C and D for a network node responding optimally to a horizontally oriented bar. (C) Part of the full network illustrating four hypercolumns (hexagons), with varying orientation selectivity suggested by the different colored wedges. Example long-range connectivity is shown for an orientation column with horizontal orientation preference in yellow, connecting to other network nodes of similar orientation. Network nodes representing collinear geometries terminate on the excitatory network node (green connections), whereas those encoding flanking bars terminate on the inhibitory network node (red connections). The blue arrows represent top-down influences from higher cortical areas. (D) Long-range connectivity for an excitatory node with a horizontal orientation preference. The green oriented bars represent connections to other excitatory nodes; the red bars represent connections to inhibitory nodes. These are reflected in the contextual interactions surrounding the RF, namely, that collinear interactions have been shown to be mainly excitatory (green), and those by parallel bars in the flanking position inhibitory (red), both by physiology and by psychophysics (62). The orientation of each bar depicts the orientation of the node it is connecting to, while both the thickness and the intensity of the color represent the connection strength. The green graph at the Top and the red one to the Right of the main graph additionally show the connection density decay, which is modeled by a Gaussian curve with a SD of three hypercolumn distances, in agreement with experimental data (12). Both excitatory and inhibitory connections follow the rule of cocircularity (and collinearity, which is a special case of cocircularity) for the optimal connection strength at a given spatial position, as can be seen by comparing the gray circles with the bars, in agreement with the statistics of natural images (ref. ; which could thus serve as a basis of developing these kernels).
Fig. 2.
Fig. 2.
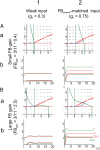
Behavior of the conductance-based model with subtractive inhibition at different feedback gain levels. (Column 1) Network behavior to a weak, suprathreshold input. The input is enhanced by the network with the higher FBgain. (Column 2) Network behavior to an intermediate strength input when the FBset point is matched to the input strength. The steady-state activities and responses are independent of the FBgain. (Aa and Ab) Small FBgain (3/11 * 0.4) leading to little processing of the input, similar to the current-based model with divisive inhibition (compare with Supporting Information). (Ba and Bb) Large FBgain (3/11 * 2.5) leading to stronger processing of the input, similar to the current-based model with divisive inhibition (compare with Supporting Information). (Aa and Ba) Phase-plane analysis. The solid green lines depict the excitatory nullclines, and the solid red lines, the inhibitory nullclines. The excitatory thresholds are depicted by vertical dotted green lines at x = 1, and the inhibitory thresholds by horizontal dotted red lines at y = 1. The approximation of the inhibitory nullcline with the response rate relationship (Eq. 23) is plotted with a dashed red line. The solid black circles with attached solid blue lines indicate examples of initial conditions in the phase plane and the trajectories of the network activities for those starting conditions. (Ab and Bb) Activity and response time courses. The dotted green and red lines depict the excitatory and inhibitory node activities, and the solid green and red lines, the excitatory and inhibitory response rates.
Fig. 3.
Fig. 3.
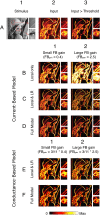
Current-based model with divisive inhibition and conductance-based model with subtractive inhibition responding to a naturalistic stimulus at different FBgain levels. (A1) The raw test stimulus. Insets are magnification of the areas in the red boxes. (A2) The input going into the network after retinal, LGN, and complex-cell preprocessing (see text) including subthreshold activity. Only the input strength at the optimal orientation at each location is shown. (A3) The input going into the network that would be able to elicit a suprathreshold response in the absence of local and long-range connections. (B–D) Current-based model with divisive inhibition. The network behavior is very similar to that of the conductance-based with subtractive inhibition in E and F. (E and F) Conductance-based model with subtractive inhibition. (B) The output of the strongest-responding cell at each location in the absence of long-range connections with a FBset point of 2. Increasing the FBgain results in an amplification of weak inputs (as in Fig. 2 Ba1 and Bb1, and Supporting Information), and a suppression of the strongest inputs (as in Supporting Information). (C) Same as B except with long-range horizontal connections included. The FBset point is not locally adjusted. Increasing the FBgain results in an amplification of the weakest inputs and directional contour integration, and “sharpening” of the object contours through the long-range connectivity. (D) Same as B except with long-range connections at a FBset point that is matched to the input in such a way that changing the FBgain has no effect on the activity and responses driven by bottom-up inputs (Fig. 2 Ba2 and Bb2). The result is that only directional contour integration and sharpening of the object contours take place without a direct amplification of weak inputs. (E) The feedback set point is equivalent to a feedback set point of 2 in the current-based model with divisive inhibition (see Supporting Information). (F) Same as in E, but with the feedback set point matched to the input strength. Similar to D, in this full model simulation, only the long-range horizontal connections contribute directly to processing of the inputs.
Fig. 4.
Fig. 4.
Pop-out of collinear elements embedded in a random background and robustness of the current-based network to noisy inputs. (A1) Network input (black bars) consisting of nine vertical collinear elements embedded in a background of randomly oriented elements. The color codes the FBgain; to simulate spatial attention at the location of the stimulus, a Gaussian kernel with the same width as the long-range horizontal connections was convolved with a nine-element vertical line at the location of the embedded contour, giving a FBgain ranging from 1.0 in the background to a maximum of ∼3.0 at the contour center (see color scale). All simulations here use the same FBgain distribution, even for shorter one- and five-bar contours, to simulate the animal’s expecting a nine-bar contour on an individual trial. The FBgain is not orientation specific, in agreement with experimental data that the feedback connections from V2 lack orientation specificity (12). (A2) Output of the current-based model with divisive inhibition at the optimal orientation averaged over 50 cell time constants. Note the pop-out of the embedded contour and the suppression of the surrounding random bars. (B and C) The dashed lines indicate the responses to a single bar without background. The lightest solid lines depict the responses to single bars with a background consisting of random lines; the darker ones, the responses to an embedded five-bar stimulus; and the darkest ones, the responses to the nine-bar stimulus. (B) Network output for excitatory (B1) and inhibitory (B2) network nodes at the optimal orientation and the center of the stimulus. Both the excitatory and inhibitory nodes show very similar time courses. Note the agreement with the extracellular recordings in C1 and C2. (C) Time course for putative excitatory (C1) and inhibitory (C2) neurons in vivo identified by the shape of the spike waveform from extracellular recordings. Note the similarity between both types of neurons except for the seemingly larger variability caused by the much smaller number of inhibitory (n = 6) compared with excitatory (n = 24) neurons. Post hoc analysis of the data of monkey A in ref. . (D1, E1, F1) Average response rate at the optimal orientation at each location on the test stimulus over a simulation duration of 20 cell time constants. (D2, E2, F2) Response time course of every 40th network node in the x and y directions. (D) The network output in the absence of noise, as in the simulations in Fig. 3C, but with an intermediate feedback gain of 1 (the network behavior to noise is similar with a lower or a higher feedback gain). (E) The network output in the presence of Gaussian noise with an amplitude of σn = 0.2. Note that the input in our simulations is scaled from 0 to 2 (plus 0.75 background input), so this is equivalent to a SD of 10% of the maximum input. (F) The network response when the Gaussian noise amplitude is doubled to σn = 0.4. Increasing the noise much beyond this point would make a subset of network nodes reach threshold regularly because the background input is 0.75 and the threshold is 1.

Similar articles

Cited by

References

    1. Wertheimer M. Untersuchung zur Lehre von der Gestalt. Psychol Forsch. 1923;4(1):301–350.
    1. Li W, Piëch V, Gilbert CD. Contour saliency in primary visual cortex. Neuron. 2006;50(6):951–962. - PubMed
    1. Li W, Piëch V, Gilbert CD. Learning to link visual contours. Neuron. 2008;57(3):442–451. - PMC - PubMed
    1. Ernst UA, Mandon S, Pawelzik KR, Kreiter AK. How ideal do macaque monkeys integrate contours? Neurocomputing. 2004;58–60:971–977.
    1. Gintautas V, et al. Model cortical association fields account for the time course and dependence on target complexity of human contour perception. PLoS Comput Biol. 2011;7(10):e1002162. - PMC - PubMed

Publication types

LinkOut - more resources