

miRNA and mRNA cancer signatures determined by analysis of expression levels in large cohorts of patients
- PMID: 24101511
- PMCID: PMC3839764
- DOI: 10.1073/pnas.1316991110
miRNA and mRNA cancer signatures determined by analysis of expression levels in large cohorts of patients
Abstract
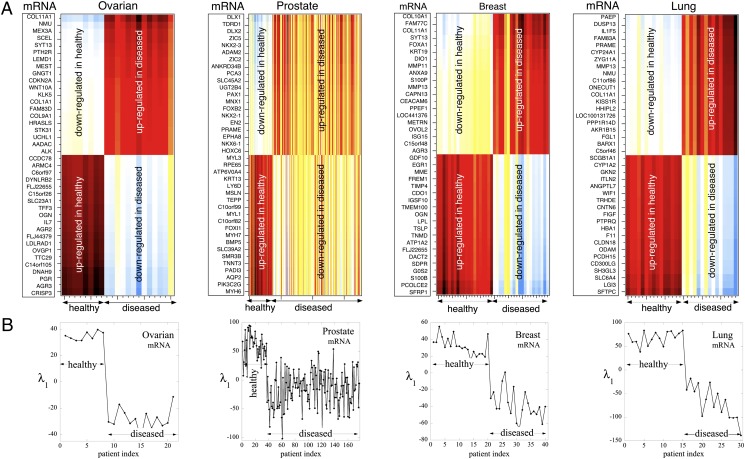
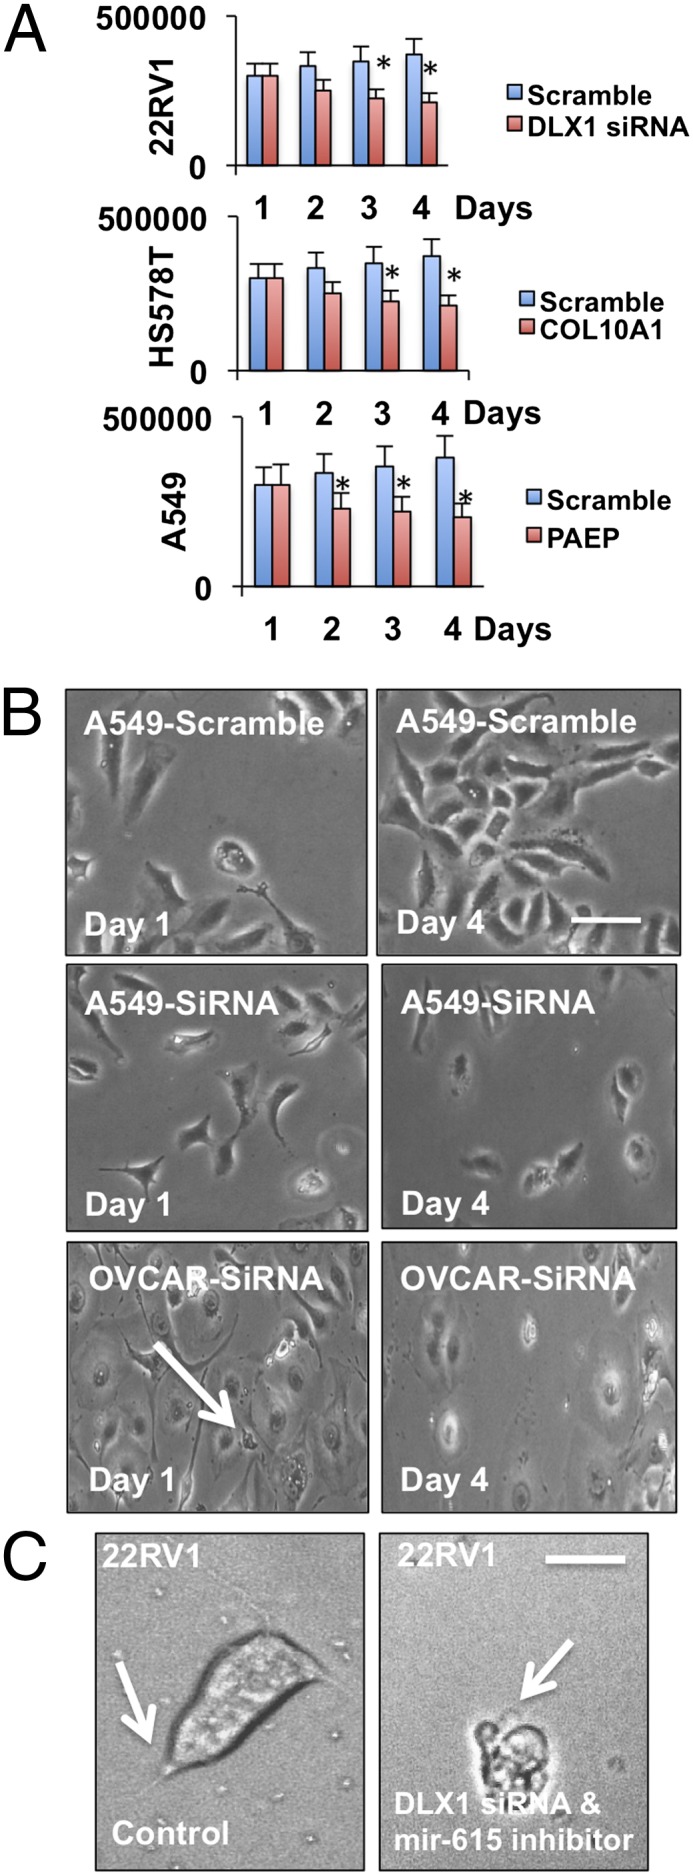
Toward identifying a cancer-specific gene signature we applied surprisal analysis to the RNAs expression behavior for a large cohort of breast, lung, ovarian, and prostate carcinoma patients. We characterize the cancer phenotypic state as a shared response of a set of mRNA or microRNAs (miRNAs) in cancer patients versus noncancer controls. The resulting signature is robust with respect to individual patient variability and distinguishes with high fidelity between cancer and noncancer patients. The mRNAs and miRNAs that are implicated in the signature are correlated and are known to contribute to the regulation of cancer-signaling pathways. The miRNA and mRNA networks are common to the noncancer and cancer patients, but the disease modulates the strength of the connectivities. Furthermore, we experimentally assessed the cancer-specific signatures as possible therapeutic targets. Specifically we restructured a single dominant connectivity in the cancer-specific gene network in vitro. We find a deflection from the cancer phenotype, significantly reducing cancer cell proliferation and altering cancer cellular physiology. Our approach is grounded in thermodynamics augmented by information theory. The thermodynamic reasoning is demonstrated to ensure that the derived signature is bias-free and shows that the most significant redistribution of free energy occurs in programming a system between the noncancer and cancer states. This paper introduces a platform that can elucidate miRNA and mRNA behavior on a systems level and provides a comprehensive systematic view of both the energetics of the expression levels of RNAs and of their changes during tumorigenicity.
Keywords: biomarker; deep sequencing; maximal entropy; microarray; network connectivity.
Conflict of interest statement
The authors declare no conflict of interest.
Figures
 , as described in Eq. 1, plotted versus the same scale of patient index, n, as the heat map in A. The sign of
  is opposite for healthy and diseased patients, thereby providing a disease signature.
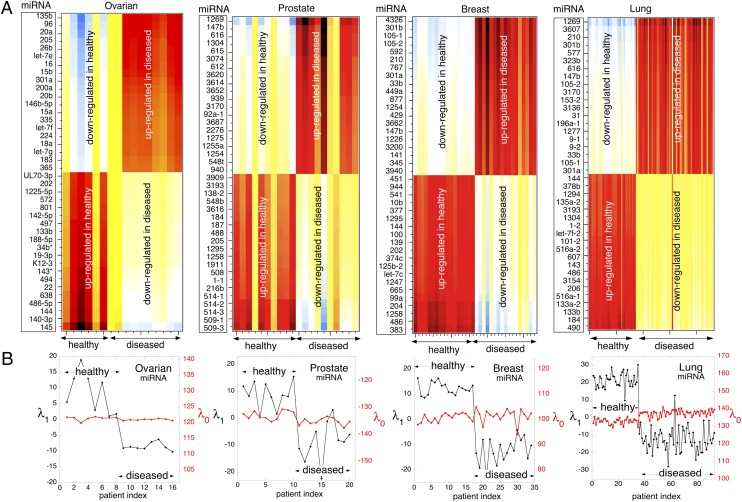
 (Eq. 1) for the cancer signature versus the patient index n. Also in this way of representing the data it is clear that patient variability in the values of
  is moderate compared with the change in sign between the healthy and diseased patients. Both healthy and disease signatures are deviations in opposite direction from the balance state.
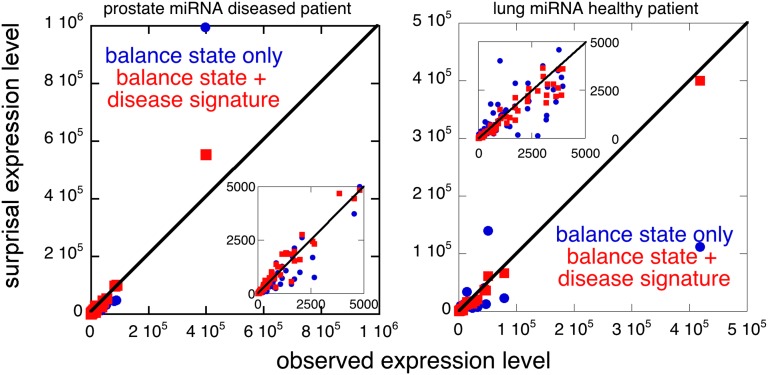
Comment in
-
Thermodynamically inspired classifier for molecular phenotypes of health and disease.Proc Natl Acad Sci U S A. 2013 Nov 26;110(48):19181-2. doi: 10.1073/pnas.1317876110. Epub 2013 Nov 7. Proc Natl Acad Sci U S A. 2013. PMID: 24204030 Free PMC article. No abstract available.
References
-
- Rhodes DR, Chinnaiyan AM. Integrative analysis of the cancer transcriptome. Nat Genet. 2005;37(Suppl):S31–S37. - PubMed
-
- Segal E, Friedman N, Kaminski N, Regev A, Koller D. From signatures to models: Understanding cancer using microarrays. Nat Genet. 2005;37(Suppl):S38–S45. - PubMed
-
- Golub TR, et al. Molecular classification of cancer: Class discovery and class prediction by gene expression monitoring. Science. 1999;286(5439):531–537. - PubMed
Publication types
MeSH terms
Substances
LinkOut - more resources
Full Text Sources
Other Literature Sources
