. 2013 Dec 15;126(Pt 24):5714-24.
doi: 10.1242/jcs.136549. Epub 2013 Oct 7.

Regulation of endoplasmic reticulum Ca(2+) oscillations in mammalian eggs

Affiliations

Regulation of endoplasmic reticulum Ca(2+) oscillations in mammalian eggs

Takuya Wakai et al. J Cell Sci. .

Abstract

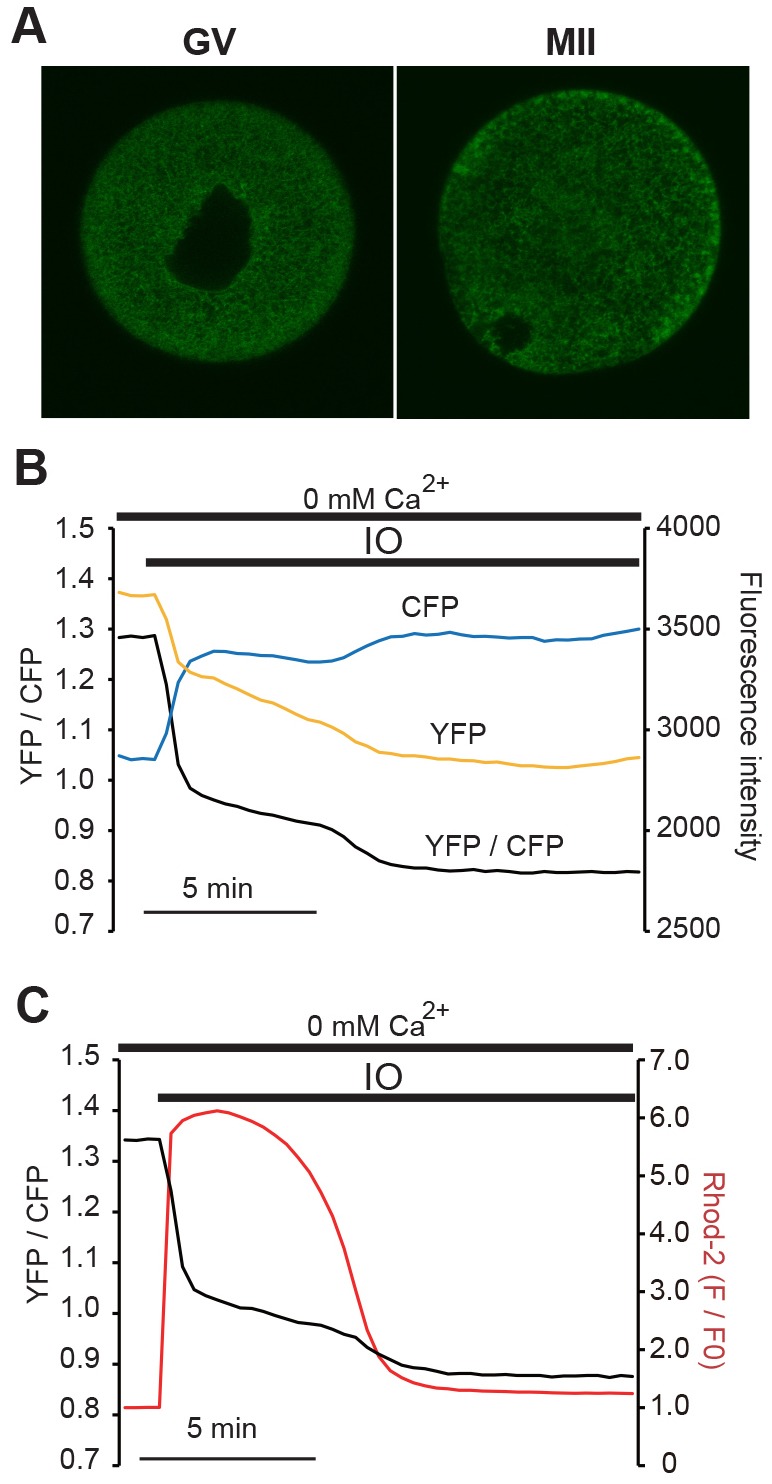
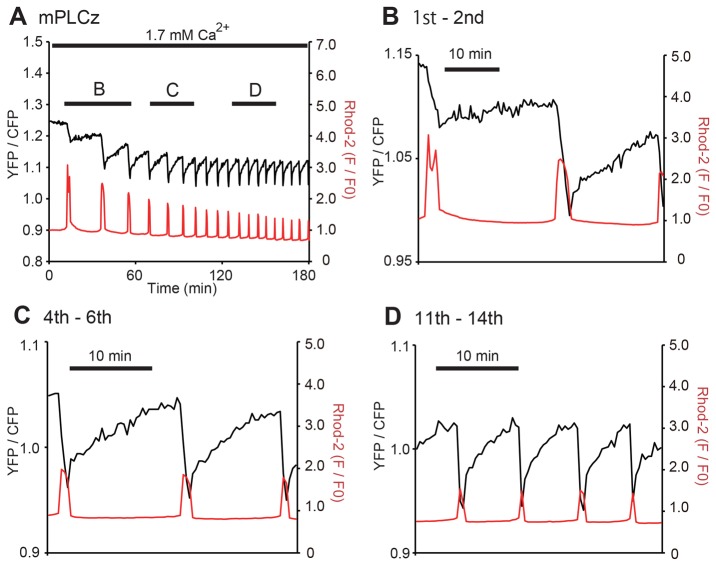
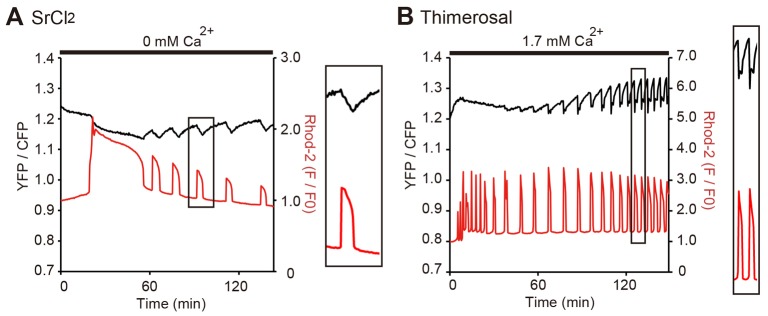
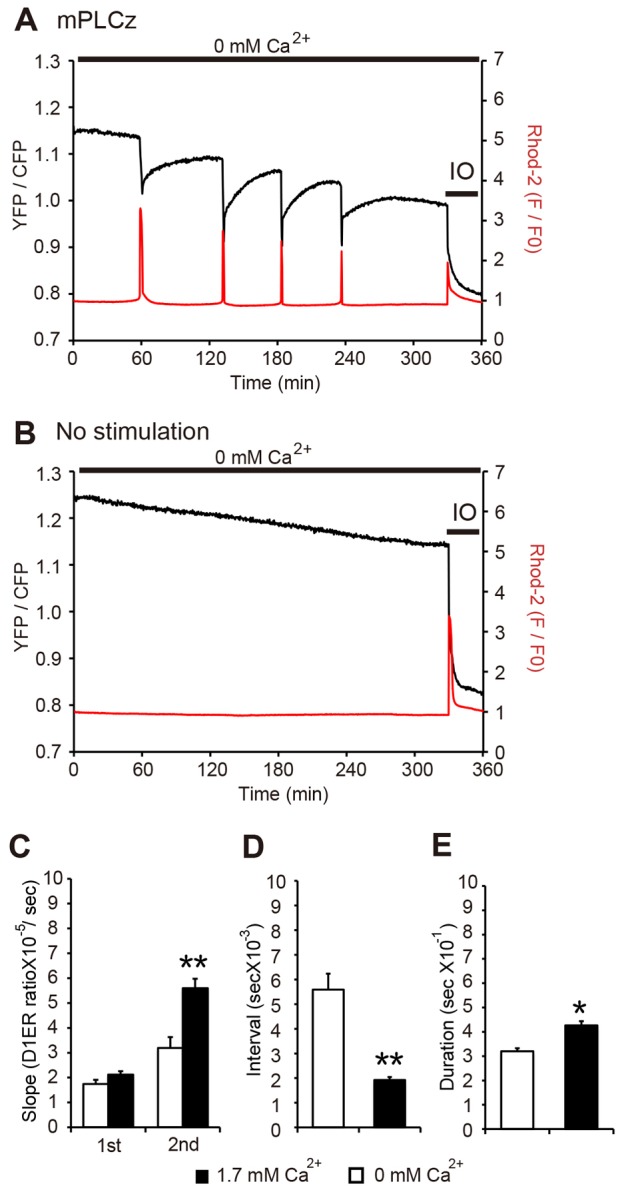
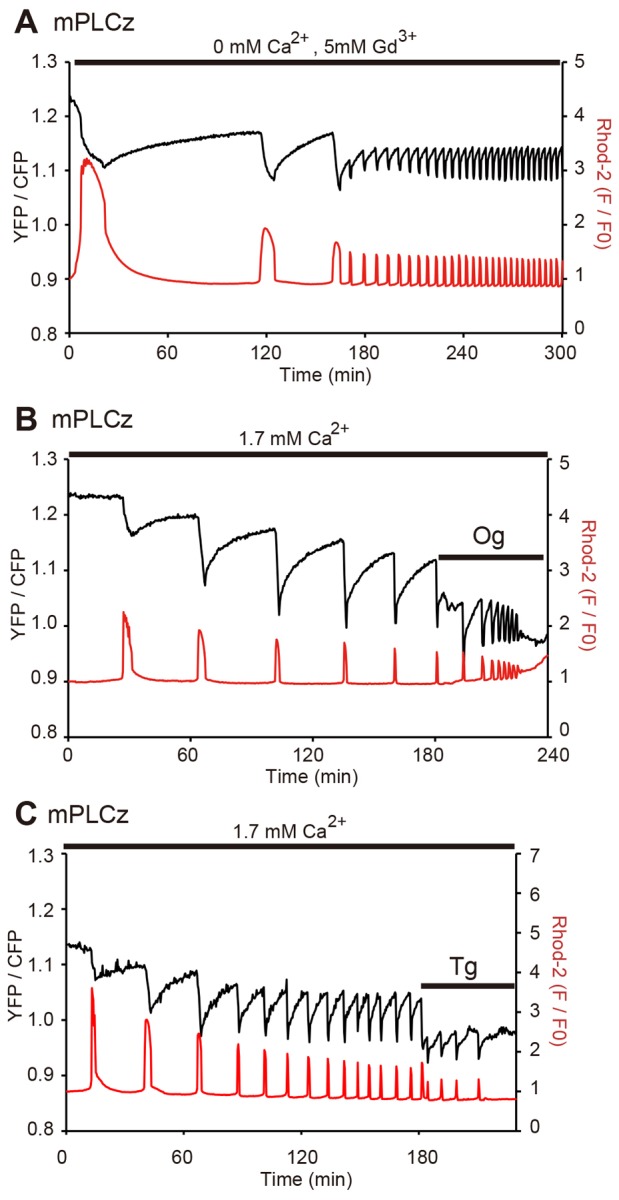
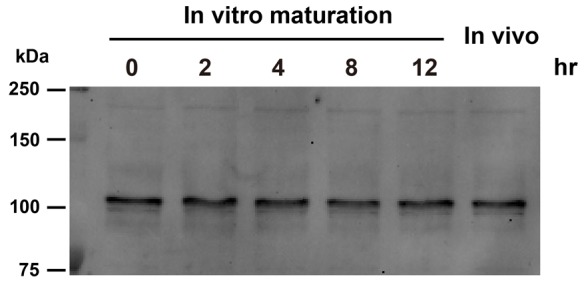
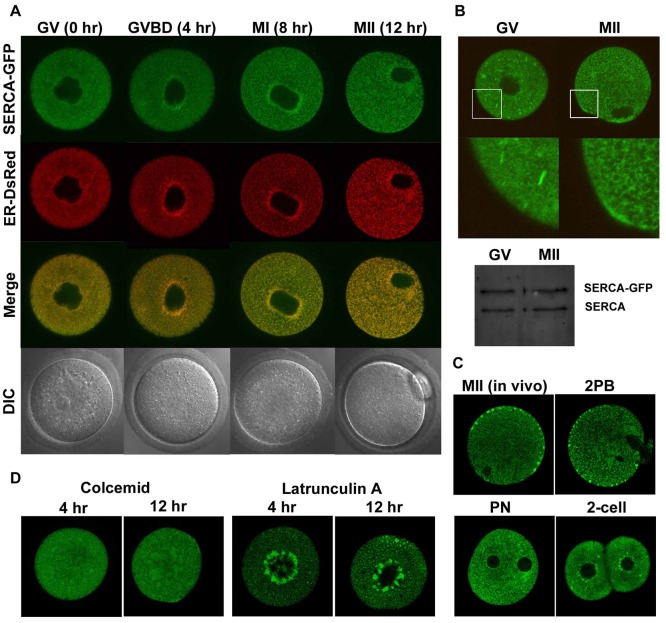
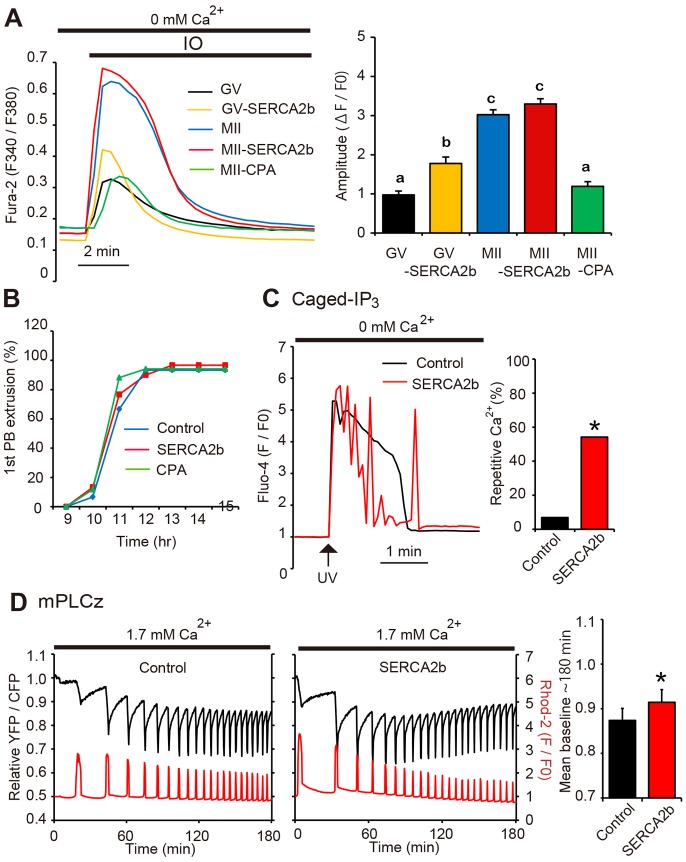
Changes in the intracellular concentration of free calcium ([Ca(2+)]i) regulate diverse cellular processes including fertilization. In mammalian eggs, the [Ca(2+)]i changes induced by the sperm unfold in a pattern of periodical rises, also known as [Ca(2+)]i oscillations. The source of Ca(2+) during oscillations is the endoplasmic reticulum ([Ca(2+)]ER), but it is presently unknown how [Ca(2+)]ER is regulated. Here, we show using mouse eggs that [Ca(2+)]i oscillations induced by a variety of agonists, including PLCζ, SrCl2 and thimerosal, provoke simultaneous but opposite changes in [Ca(2+)]ER and cause differential effects on the refilling and overall load of [Ca(2+)]ER. We also found that Ca(2+) influx is required to refill [Ca(2+)]ER, because the loss of [Ca(2+)]ER was accelerated in medium devoid of Ca(2+). Pharmacological inactivation of the function of the mitochondria and of the Ca(2+)-ATPase pumps PMCA and SERCA altered the pattern of oscillations and abruptly reduced [Ca(2+)]ER, especially after inactivation of mitochondria and SERCA functions. We also examined the expression of SERCA2b protein and found that it was expressed throughout oocyte maturation and attained a conspicuous cortical cluster organization in mature eggs. We show that its overexpression reduces the duration of inositol-1,4,5-trisphosphate-induced [Ca(2+)]i rises, promotes initiation of oscillations and enhances refilling of [Ca(2+)]ER. Collectively, our results provide novel insights on the regulation of [Ca(2+)]ER oscillations, which underlie the unique Ca(2+)-signalling system that activates the developmental program in mammalian eggs.

Keywords: Ca2+ oscillations; Egg activation; Endoplasmic reticulum; Fertilization; Oocyte maturation; SERCA.


Figures

Fig. 1.
Fig. 1.
Measurement of [Ca2+]ER in oocytes and eggs using cameleon D1ER. (A) Confocal images of D1ER fluorescence in GV oocytes and MII eggs. (B,C) Emission ratios of D1ER (YFP/CFP; left axis) after addition of 5 µM ionomycin (IO) in Ca2+-free medium. The intensities of CFP fluorescence and YFP fluorescence shifted in opposite directions (B). To perform simultaneous measurements of [Ca2+]ER and [Ca2+]i, the latter was recorded using Rhod-2 (red trace, right axis) (C).
Fig. 2.
Fig. 2.
[Ca2+]ER and [Ca2+]i responses during PLCζ-induced oscillations. (A–D) Representative Ca2+ responses induced by injection of mouse PLCζ cRNA (0.05 µg/µl) (n = 18). [Ca2+]ER (black trace, left axis) and [Ca2+]i (red trace, right axis) undergo simultaneous but opposite changes in concentration during oscillations (A). (B–D) Magnified views of first and second (B), fourth to sixth (C) and eleventh to fourteenth Ca2+ responses induced by injection of PLCζ cRNA.
Fig. 3.
Fig. 3.
[Ca2+]ER and [Ca2+]i during Sr2+- and thimerosal-induced oscillations. (A,B) Simultaneous measurements of changes in [Ca2+]ER and [Ca2+]i in eggs exposed to 10 mM SrCl2 (n = 16) (A) or 50 µM thimerosal (n = 20) (B). Right panels are magnified views of boxed areas on the main traces.
Fig. 4.
Fig. 4.
[Ca2+]ER and [Ca2+]i responses induced by PLCζ cRNA injection in the absence of [Ca2+]e. (A,B) Representative traces of Ca2+ responses induced by mouse PLCζ cRNA injection (n = 20) (A) or in uninjected controls (n = 5) (B) in eggs maintained in Ca2+-free conditions. [Ca2+]ER and [Ca2+]i were monitored as in previous experiments. When oscillations ceased, 2 µM ionomycin was applied. (C–E) Comparisons of several parameters of [Ca2+]i rises of PLCζ cRNA injection-induced oscillations in eggs oscillating in Ca2+-containing (n = 17) or in Ca2+-free-medium (n = 20). The recovery of [Ca2+]ER after the first and second [Ca2+]i transients was estimated by comparing the slope of refilling and plotted as changes in emission ratios of D1ER per second (C), the interval between first and second [Ca2+]i rises (sec) (D) and duration of first [Ca2+]i rise (F). Error bars represent s.e.m. *P<0.005; **P<0.001.
Fig. 5.
Fig. 5.
Inhibition of the Ca2+-buffering and Ca2+-sequestering capacity of eggs alters [Ca2+]ER and [Ca2+]i responses during oscillations. (A–C) Representative traces of the changes in [Ca2+]ER (YFP/CFP; black trace) and [Ca2+]i (Rhod-2; red trace) during PLCζ-induced oscillations under conditions where Ca2+ efflux or influx (n = 22) (A), mitochondrial function (n = 16) (B) or SERCA (n = 18) (C) were pharmacologically inactivated. (A) Simultaneous measurements were performed in Ca2+-free HBSS medium containing 5 mM GdCl3. (B,C) Oligomycin and thapsigargin were added to oscillating eggs at concentrations of 5 µM and 20 µM, respectively.
Fig. 6.
Fig. 6.
SERCA2b is expressed throughout oocyte maturation. Western blot analysis of oocytes at different stages of maturation. Lysates of 100 oocytes were probed with an antibody specific for SERCA2b. A representative result of two similar independent experiments is shown.
Fig. 7.
Fig. 7.
SERCA2b undergoes reorganization during oocyte maturation and forms cortical clusters in MII eggs. (A) The subcellular distribution of SERCA2b and ER was analyzed using EGFP (top panel) and DsRed-tagged (middle panel) fusion proteins, respectively. Representative images taken at the equatorial plane are shown. The observations were performed at 0, 4, 8 and 12 hours after initiation of in vitro maturation, which corresponded with GV, GVBD, MI and MII stages, respectively; corresponding DIC images are shown in the bottom panel. (B) Images of high expression of SERCA2b-EGFP in GV oocytes and in-vitro-matured MII eggs (top panel), which was achieved by injection of 1 µg/µl cRNA, and higher magnification views of the selected area (middle panel) where differences in SERCA2b distribution between the two stages can be observed. Levels of SERCA2b-EGFP expression were confirmed by western blot analysis (50 oocytes/eggs per lane) using antibody specific to SERCA2b (bottom panel). (C) Expression of SERCA2b-EGFP in in-vivo-matured MII eggs, 2PB or PN zygotes and two-cell embryo. (D) GV oocytes expressing SERCA2b-EGFP were matured in the presence of 100 ng/ml colcemid or 1 µM Latruculin A and observations were performed at 4 and 12 hours of in vitro maturation; typical equatorial sections are shown.
Fig. 8.
Fig. 8.
SERCA2b overexpression alters Ca2+ responses in oocytes/eggs. (A) [Ca2+]ER levels were estimated from [Ca2+]i responses induced by addition of 2 µM ionomycin in Ca2+ free medium and representative traces of Fura-2 emission ratios are shown. The comparison of fluorescent [Ca2+]i peaks between stages is shown in a bar graph to the right of the traces (n = 18–26). Error bars represent s.e.m. and bars with different superscripts are significantly different (P<0.05). (B) Meiotic progression to the MII stage indicated as the percentage of oocytes with extrusion of the first polar body (n = 16–23). (C) IP3-induced Ca2+ release obtained after photolysis of cIP3 release (0.25 mM) by a flash of UV (arrow; 0.1 second). Representative traces of increases of Fluo-4 fluorescence caused by cIP3 in control (black trace; n = 29) and in oocytes overexpressing SERCA2b (red trace; n = 24) are shown. The percentage of oocytes showing repetitive [Ca2+]i rises were compared and displayed in a bar graph to the right. Asterisk indicates statistical significance (*P<0.01, Chi-squared test). (D) The relative emission ratio of D1ER (the value at the beginning of measurement was defined as 1; black line) and [Ca2+]i (Rhod-2; red trace) during PLCζ-induced oscillations were measured and representative traces are shown in control (n = 14) and in SERCA2b-overexpressing eggs (n = 20). Bar graphs show comparison of [Ca2+]ER basal levels ∼180 minutes after initiation of monitoring. *P<0.05, Student's t-test.

Similar articles

Cited by

References

    1. Berridge M. J. (2002). The endoplasmic reticulum: a multifunctional signaling organelle. Cell Calcium 32, 235–249 10.1016/S0143416002001823 - DOI - PubMed
    1. Berridge M. J., Lipp P., Bootman M. D. (2000). The versatility and universality of calcium signalling. Nat. Rev. Mol. Cell Biol. 1, 11–21 10.1038/35036035 - DOI - PubMed
    1. Bird G. S., Putney J. W., Jr (2005). Capacitative calcium entry supports calcium oscillations in human embryonic kidney cells. J. Physiol. 562, 697–706 10.1113/jphysiol.2004.077289 - DOI - PMC - PubMed
    1. Bootman M. D., Collins T. J., Peppiatt C. M., Prothero L. S., MacKenzie L., De Smet P., Travers M., Tovey S. C., Seo J. T., Berridge M. J. et al.(2001). Calcium signalling—an overview. Semin. Cell Dev. Biol. 12, 3–10 10.1006/scdb.2000.0211 - DOI - PubMed
    1. Brini M., Carafoli E. (2011). The plasma membrane Ca2+ ATPase and the plasma membrane sodium calcium exchanger cooperate in the regulation of cell calcium. Cold Spring Harb. Perspect. Biol. 3, a004168 10.1101/cshperspect.a004168 - DOI - PMC - PubMed

Publication types

MeSH terms